Economic contribution of forest products to rural livelihoods in northern mountainous villages, vietnam
Bạn đang xem bản rút gọn của tài liệu. Xem và tải ngay bản đầy đủ của tài liệu tại đây (1.19 MB, 86 trang )
Master’s Thesis
Economic Contribution of Forest Products to Rural Livelihoods in
Northern Mountainous Villages, Vietnam
M144763
TRAN ANH DUC
Graduate School for International Development and Cooperation
Hiroshima University
September 2016
TABLE OF CONTENTS
TABLE OF CONTENTS ....................................................................................................... i
LIST OF FIGURES ............................................................................................................. iii
LIST OF TABLES ............................................................................................................... iii
ABSTRACT ......................................................................................................................... 1
1
INTRODUCTION ......................................................................................................... 3
2
STUDY OBJECTIVES .................................................................................................. 5
3
LITERATURE REVIEW ............................................................................................... 6
3.1
Economic contribution of forest products ................................................................ 6
3.2
Determinants of household engagement in forest activities ...................................... 9
3.3
Forestland devolution in Vietnam.......................................................................... 11
4
STUDY AREA ............................................................................................................ 13
5
METHODS .................................................................................................................. 17
5.1
5.1.1
Household survey .......................................................................................... 17
5.1.2
Forest survey ................................................................................................. 22
5.2
6
Data collection ...................................................................................................... 17
Data analysis ......................................................................................................... 23
5.2.1
Economic contribution of forest products ....................................................... 23
5.2.2
Determinants of household engagement in forest activities............................. 24
5.2.3
Biological status of household planted forests ................................................ 26
RESULTS .................................................................................................................... 27
6.1
Household characteristics ...................................................................................... 27
6.2
Household cash income......................................................................................... 30
6.3
Detailed household forest cash income .................................................................. 33
6.4
Determinants of household engagement in forest activities .................................... 36
i
6.4.1
Determinants of household forestland and plantation area .............................. 37
6.4.2
Determinants of household absolute and relative forest income ...................... 38
6.5
7
8
Biological status of household planted forests ....................................................... 40
DISCUSSION .............................................................................................................. 44
7.1
Economic contribution of forest products .............................................................. 44
7.2
Determinants of household engagements in forest activities .................................. 46
7.3
Limitations of this study........................................................................................ 49
CONCLUSIONS AND POLICY IMPLICATIONS ..................................................... 50
ACKNOWLEDMENT ........................................................................................................ 54
REFERENCES ................................................................................................................... 55
APPENDICES .................................................................................................................... 59
ii
LIST OF FIGURES
Figure 1: Map of the study area .............................................................................................. 13
Figure 2: Distribution of household forestland, plantation area, absolute forest income and
relative cash income in 2014 ................................................................................................... 36
Figure 3: Tree species diversity ............................................................................................... 41
Figure 4: Diversity in tree trunk diameter ............................................................................... 42
Figure 5: Diversity in tree height ............................................................................................ 42
LIST OF TABLES
Table 1: Demographic and land use information of the study area ........................................ 14
Table 2: House mean characteristics by income quartiles ...................................................... 27
Table 3: Mean household absolute cash income per aeu by income quartiles and income
sources in 2014 (USD) ............................................................................................................. 30
Table 4: Mean household relative cash income per aeu by income quartiles and income sources
in 2014 (%) .............................................................................................................................. 32
Table 5: Mean household absolute forest cash income per aeu by income quartile and forest
income sources (USD) ............................................................................................................. 34
Table 6: Mean household relative forest cash income per aeu by income quartile and forest
income sources (%) .................................................................................................................. 35
Table 7: Tobit results for determinants of household forestland holding and plantation area in
2014.......................................................................................................................................... 37
Table 8: Tobit results for determinants of household absolute and relative forest cash income
in 2014 ..................................................................................................................................... 39
iii
ABSTRACT
Title of the
Master’s Thesis
Economic Contribution of Forest Products to Rural Livelihoods in
Northern Mountainous Villages, Vietnam
Student ID Number
M144763
Name of the Student
Tran Anh Duc
Main Academic Advisor
Professor Nakagoshi Nobukazu
Economic importance of forest products to the rural livelihoods has been enlightened by a
significant number of empirical studies. However, current literature often focuses on the
proximity of natural forests, which are, in most of the cases, under the management of
communities or states. Household managed forests, where local people often actively engage
in forest plantation, have been being promoted in developing world for the sake of both poverty
alleviation and forest conservation. Yet, evidences about economic significance of forest
products as well as factors determining household decisions on forest activities in such setting
remain limited.
This study captures the economic contribution of forest products to household income in the
context of household managed forests by analyzing a dataset of 308 households in two villages
of Bac Kan province, located in the northern mountainous region of Vietnam. Household
income is measured in cash income per adult equivalent unit, and comparisons among cash
income quartiles as well as income sources are performed by ANOVA tests and post-hoc tests.
In addition, determinants of household engagement in forest activities are examined by Tobit
models. Equally important, a forest survey is also conducted so as to investigate basic
biological status of household planted forests.
1
Results show cash income from forest products accounts for about 20% of household cash
income, which surpasses cash contribution of all other livelihoods but that of livestock cash
income and off-farm wages. In addition, although higher absolute forest cash income is
witnessed in short-run better-off group, no significant difference is seen in the relative forest
income among cash income quartiles. Importantly, among forest products, timber is the biggest
contributor. Tobit models demonstrate positive correlations of cropland area with forestland
holding as well as plantation area. Furthermore, older-headed families, although having larger
forestland and plantation area, derive less cash income from forest products and show less
dependency on forest cash income. Meanwhile, education level of the household head is
negatively correlated with forestland area, absolute forest income and relative forest income.
Finally, the biological status of household planted forests is concluded to be undiversified.
Only seven species are found, and two fast-growing species, Magnolia conifer and Acacia
hybrid, account for more than 90 percent of the sample. Tree height and tree trunk diameter
show concentrations in low-value classes due to relatively similar and short plantation
durations among households.
Findings of the study function as an empirical support for poverty reduction based household
managed forests. Correlation analyses from Tobit models prove the viability of a combination
between agriculture and forestry as an economic development policy. However, increasing
education level are potential obstacles for the current forest-based development. Hence, new
high-return forest products which are attractive to people of all education levels need
developing. Last but not least, diversification of planted tree species should be taken in
consideration.
2
1
INTRODUCTION
Relationships between forests and rural livelihoods have been being investigated worldwide
for the sake of forest-based poverty alleviation. Evidences from various regions have proved
the economic importance of forest sources to the rural poor. Quantitatively, contribution of
forest products to household income, on a global average, is reported at approximately 22
percent (Angelsen et al., 2014), with the poor are generally more reliant on forest income than
the better-off (Babulo et al., 2009; Cavendish, 2000; Rayamajhi, Smith-Hall, & Helles, 2012;
Vedeld, Angelsen, Bojö, Sjaastad, & Kobugabe Berg, 2007). In addition, there are ample
attempts to model factors that influence household dependency on forests as well as household
decision-making for forest related activities (e.g. Fisher 2004; Adhikari et al. 2004; Rayamajhi
et al. 2012; Sikor & Baggio 2014; Babigumira et al. 2014; Ashraf et al. 2015). Results show
that many household characteristics are significantly correlated with forest-related decisions as
well as forest income.
Nonetheless, most of the study sites have so far concentrated on state or community managed
forests, where environmental products from natural forests often play a key role. In a result of
their global-scale study, Angelsen et al. (2014) report that among 22 percent contribution of
forest sources to household income, 21 percent is from natural forests and only 1 percent
belongs to plantation. Meanwhile, in the context household-based forests management, where
active plantation is prevalent, little is known. In fact, planted forests managed by households
are increasing rapidly, especially in developing regions (FAO, 2006). Accordingly, on global
average, proportion of planted forest area managed by smallholders rose nearly threefold in 15
years, from 12% in 1990 to 27% in 2000 and to 32% in 2005. This ratio far exceeded that of
corporate ownership, which by contrast witnessed a downward patterns. Moreover, the
dramatic rising importance of smallholders was particularly seen in East Asian and some South
East Asian countries. These numbers demonstrate clearly that planted forests managed by
3
households is an emerging type of forest management, offering a compelling contextual setting
forest poverty relationship studies.
Similarly, in Vietnam, studies on economic contribution of forests are clustered in the
proximity of natural forests, which are under state or community management (e.g. Mcelwee
2008; Viet Quang & Nam Anh 2006). Whereas, FAO reported a significant increase in national
smallholder ownership of forest plantation to 64% in 2005, which was more than double public
ownership (FAO, 2006). Allocation of forestland to household has been being promoted for
decades in Vietnam. Because of a weak management of State Forestry Enterprises (SFEs) and
a need for productive land of local people in disadvantaged regions in the 1980s, forestland
ownership was shifted gradually from the state to individuals (i.e. households) (Sandewall,
Ohlsson, Sandewall, & Sy Viet, 2010; Sikor & Nguyen, 2007). Such forestland devolution is
aimed to achieve both poverty reduction and conservation of forest coverage. Nonetheless,
economic contribution of available products from household-managed plantation forest
remains ambiguous.
Inconsideration of this inadequate understandings, the study aims at quantitatively evaluating
the economic benefits from household-managed forests using a dataset of 308 households
generated from a survey in poor mountainous villages of Vietnam. Moreover, Tobit models are
utilized so as to examine the determinants of household engagement in forest activities. Last
but not least, biological status of household planted forest is investigated via a forest survey.
The rest is organized as follows. After study objectives and research questions are clarified in
section 2, section 3 provides a review of literatures about economic contribution of forest
products as well as studies on factors affecting household involvement in forest activities.
Study area and methods are described precisely in section 4 and section 5 respectively. Section
6 presents results from statistical analyses. Section 7 discusses, and section 8 concludes and
gives policy implication for decision-makers.
4
2
STUDY OBJECTIVES
With a view of examining the relationship between rural livelihoods and household-managed
forests, the study is to achieve three objectives as the followings:
Objective 1: To quantitatively evaluate the economic contribution of products from household
managed forests to rural livelihoods in mountainous villages of Vietnam
Objective 2: To identify determinants of household’s engagement in forest activities
Objective 3: To investigate biological status of household planted forests
In order to achieve the aforementioned objectives, the study is designed to answer 3 following
research questions:
Question 1: To what extent do products from household managed forests contribute to
household income in mountainous villages?
Question 2: Among household characteristics, what have significant impacts on household
forestland holding, plantation size and forest income?
Question 3: How is the biological status of planted forests managed by households?
5
3
3.1
LITERATURE REVIEW
Economic contribution of forest products
A range of quantitative studies on economic importance of forests have emerged in the last two
decades. While some of them mainly focus on environmental products from forests, some are
designated to capture all forest-related sources from non-cultivated, processed products,
plantation to forestry wages.
Forests offer a range of products for people living in the proximity, such contribution is
however often omitted by national economic datasets (Cavendish, 2000). Moreover, the
relationship between the poor and forests are controversial as forest sources have both the
advantages and disadvantages for poverty alleviation (Angelsen & Wunder, 2003). Based on
those arguments, researchers started to comprehensively quantify economic role of forestrelated income. Cavendish (2000), utilizing a panel data collected in Zimbabwe, demonstrates
that environmental sources from forests account for about one third of total rural household
income. In addition, environmental income is more important for poorer households with
approximately 40 percent of their total income coming from non-cultivated sources.
Meanwhile, larger absolute environmental income is witnessed in the richer groups. Not only
is Cavendish’s work one of the first publications to report the contribution of environmental
goods, it does introduce methods to quantitatively evaluate income from those easily omitted
products. In particular, evaluation difficulties often lie in products that are not traded or
battered on the market. According to Cavendish’s methods of evaluation, implicit prices for
those products are either household assigned values, whenever they are possible, or close and
locally-traded substitutes. In addition, for the sake of comparability of income across household,
income per adjusted adult equivalent unit (aeu) is proposed. Another pioneering and more
forest-oriented study is conducted by Fisher (2004). Using data collected in rural Malawi, the
author sheds light on the substantial reliance on forest income, representing about 30 percent
6
of household income. Forest income also lowers income equality, which is a result from Gini
analysis. Following the practices of Cavendish and Fisher, there are increasing empirical
evidences of the significance of forest natural resources in rural livelihood, mostly in African
regions (see Mamo et al., 2007; Vedeld et al., 2007; Kamanga, et al. 2009, Babulo et al., 2009) .
Their conclusions are quite homogenous. Particularly, the percentage of forest income
fluctuating from 15 to 39 percent, and the poorer the more dependent on forests (Rayamajhi et
al. 2012). Richer groups earn more absolute income from forest products is another common
result.
Although the number of studies on the topic rise dramatically, there exist several limitations.
Rayamajhi et al. (2012) summarize and point out clearly three drawbacks of previous literatures.
The very first one is a variation in the methodology of evaluating forest products. A common
utilization of one-year recall period, secondly, may lead to a remarkable underestimation of
forest income. Finally, empirical evidences cluster in particular parts of Africa and Southeast
Asia, while little is known in other regions. These weaknesses are motivation for Poverty
Environment Network (PEN) research project, which is initiated by Center for International
Forestry Research (CIFOR). The outstanding originality of studies belong to PEN is their
survey design. Specifically, quarterly surveys are used, which require households to recall their
income sources in short periods, only from 1 to 3 months. As a result, detailed and reliable
information can be reported by households. Besides, PEN study sites are selected so as to
capture environmental income in various tropical or sub-tropical forested places, from Asia to
Africa and Latin America (see Angelsen et al. (2014) for locations of PEN studies). One
contribution of this project for researchers in the same field is an explicit technical guidelines
(see PEN, 2007), clearly defining sources of income and providing questionnaire prototypes.
Findings of PEN project, which is reported in Angelsen et al. (2014), are quite similar with
those from previous evidences. The poor groups are more reliant on environmental income,
7
while higher absolute environmental income belongs to the better-off. Noticeably, although the
primary purpose of this project is to illustrate income from environmental sources, its detailed
quarterly surveys do allow investigation in the contribution of each household income sources
in. According to PEN results, forest income accounts for about 22 percent of household total
income. Within this number, approximately 21 percent is from natural forests, while only 1
percent is from plantation forests. This may result from the fact that most of PEN study sites
are in the proximity of natural forests, while planted forests are not of interest. Moreover, in
the regard of current literatures about forest and poverty links, a significant number of studies
choose state or community – based managed forest as their study site. Whereas, forests that are
managed by households receive little attention.
In Vietnam, literature about relationships between rural livelihoods and forests is fairly limited,
since the two topics are often studied separately (Sunderlin & Huynh, 2005). In an attempt to
clarify potentials of forest sources for poverty alleviation in Vietnam, Sunderlin & Huynh
(2005) emphasize a need for additional empirical research because of a serious lack of available
information. In fact, there are several studies that try to examine the importance of forest
income to rural households. Viet Quang & Nam Anh (2006) demonstrate the dependence of
forest dwellers on non-timber forest products (NTFP). Their results show that the share of cash
income from NTFP fluctuates wildly between their two study sites, being 5% and 33%
respectively. Contribution of forest environmental income is investigated by Mcelwee (2008),
with highest forest environmental cash income in both absolute and relative terms seen in the
middle class. Besides being limited in the number of publications, studies on forest and poverty
relationship in Vietnam often have modest sample sizes (n=55 in Viet Quang & Nam Anh
(2006) and n=105 in Mcelwee (2008)). Furthermore, being similar to studies in other regions,
study sites are located close to natural and community-based managed forests.
8
To sum up, many studies has proved the economic importance of forest-related income sources.
However, most of them focus on state or community managed natural forests and their
environmental sources. Meanwhile, evidences in household managed forests remain limited.
3.2
Determinants of household engagement in forest activities
Researchers studying contribution of forest income has been trying to evaluate effects of
household characteristics on forest dependency. Equally important, mechanisms of householddecision making to engage in forest-related businesses are also examined.
In order to deepen the understanding of forest and households links, a number of methods are
used to analyze the relationship between household socio-economic factors and forest income.
Cavendish (2000), by simply using descriptive statistics, shows utilization of environmental
sources is strongly different among individual age, sex as well as household headship. For
example, physically demanding activities, like hunting wild animals, logging wood and
carpentry are mainly responsible by men, but pottery and gardening are done by women.
Whereas, consumption of wild fruits and insects from forests are mostly attributed to children;
however, firewood and grass are mainly consumed by adult. In spite of a plain technique, his
result is one of the first to show differentiation of forest use among households. Being different
from this pioneering work, later publications develop regression models to empirically analyze
the impacts of household factors. Fisher (2004), after classifying forest income into high-return
forest activities and low-return ones, constructs Tobit models to estimate the correlation
between household characteristics and reliance on those two activities. His results indicate farm
size, education level of household head and livestock size are negatively correlated with
dependency on both high-return and low-return forest sources. By contrast, availability of male
labor has a positive correlation. There are also a number of other works that empirically induce
the correlations by using OLS multiple regression models. A clear overview of correlation
signs between household socio-economic factors and absolute as well as relative forest income
9
can be seen in Rayamajhi et al. (2012). In general, their model specification is quite similar to
this of Fisher (2004); additional explanatory variables are location of households and several
financial indicators such as savings, debts and remittances.
Beside attempts to examine determinants of forest income, mechanisms underlying households’
decision to get engaged in particular forest-related activities are explored in several studies.
Ashraf et al. (2015) utilize a logit regression model to inspect factors which affect household
binary decision whether or not to plant tree, regarded as small-scale plantation, in India. Their
model is specified on the basis of “agricultural decision-making premises”, and most of
variables are dummy ones. With a modest sample size (n=176) and a unbalanced design
(number of households not planting tree being only 16), significantly positive correlation are
reported in crop landholding, irrigated cropping land, monthly income and tree planting
experience. Another study which also deals with household mechanisms of tree plantation is
conducted by Sikor & Baggio (2014). For the sake of clarifying patterns, mechanisms and
processes of differentiation among households in forest plantation, they combine both
quantitative and qualitative methods in their entitlement analysis. Regarding quantitative
aspects, Heckman maximum likelihood models are chosen to examine effects of household
assets on a range of dependent variables, including binary alternatives to own forest land, to
plan trees and to invest in plantation and continuous variables of forest landholding, plantation
areas and amount of effective investment. Accordingly, the factor that have positive significant
impacts on almost all dependent variables is physical asset. As a result, richer households are
concluded to have larger probability to engage in forest plantation as well as the extent to which
they engage in. Their further qualitative analysis shows that a main reason for such
differentiation is access to land and finance. Examining a different forest-related strategy of
households, Babigumira et al. (2014) use PEN large dataset to analyze impacts of household
assets on their decision to convert forests for agriculture land as well as the area they converted.
10
Their random effect Logit and Tobit models result in a significantly positive impacts of male
labor, market-orientation and a negative one in distance to forest cover. Strikingly, better-off
households are more likely to clear forest than the poorer ones, which contradicts usual policymakers’ attention towards the latter. Model specification of the last two studies is worth
noticing. To be more specific, both researches follow livelihood framework as a foundation for
the selections of their explanatory variables. Livelihood framework has been being used by
many researchers for investigating factors affecting various rural households decisions (see
Ellis (2000); Ellis & Bahiigwa (2003) and VanWey et al. (2007) for examples). According to
this conceptual framework, household assets are classified in 5 categories, namely natural
assets, human assets, social assets, financial asset and physical assets, which then play crucially
important roles in understanding household decisions on their rural economic strategies. By
regressing household forest-related decisions on these assets together with some control
variables, Sikor & Baggio (2014) and Babigumira et al. (2014) expect to get robust results
about potential correlations.
In short, various models has been developed to quantitatively evaluate the relationship between
household characteristics and their engagement in forest activities. Among them, model
specification based on livelihood framework proves a legitimate approach.
3.3
Forestland devolution in Vietnam
Several studies have clarified the transformation of Vietnamese forest policies as well as
determinants of household forestland uptake . Sandewall et al. (2010) provides a review of
forest policy changes. According to their findings, only SFEs had rights to use and manage
forest land during the 1970s. Local people were hired for planting tree; however, they also
illegally use “logged-over” land for shifting agriculture. Forest land allocation began in 1983,
and were officially confirmed in First National Forest Policy in 1991 and Land Law in 1993.
Accordingly, SFEs were encouraged to lease land to households for the sake of small-scale
11
plantation forestry. Later legal document, by specifying the use rights of households over their
allocated forest land, systematically stimulate small-scale forest plantation. Instruments for the
allocation were either land-use certificates or management of protection contracts; nonetheless
the former, particularly in form of Red Books, are preferred. Sikor & Nguyen (2007), in their
qualitative analysis of mechanisms differentiating forest land access among households, shared
quite similar findings on forest land transition but pointed out explicitly factors influencing
land uptake. To be more specific, under the SFEs’ weak management of forest lands during the
1980s and early 1990s, households in midland and upland illegally occupied those lands for
their agricultural activities, leading to a severe decrease in forest coverage. As a solution, SFEs
and local officers signed tree-planting contracts with households on land they had claimed, or
sold off the barren hills to them. Factors influencing the forest area that a household can claim
in this period were availability of family labor and relationship with local authorities. Since the
mid-1990s, smallholders’ forest land are gradually legalized via temporary land certificates,
Green Books, and then formal land-use certificates, Red Books. Moreover, because an illegal
and spontaneous grab of forest lands is no longer available, possible ways of acquiring land are
now through land purchase and sharing among family members. Subsequently, household
financial foundation and livelihood strategy preferences between agriculture and forestry are
concluded to be key determinants of forest land access.
12
4
STUDY AREA
The study is carried out in two villages, namely Thanh Van village (22o35’5’N, 105o47’49’’E)
and Mai Lap village (21o57’46’’N, 105o51’35’’E). Those two villages are in Cho Moi district
(approx. 21º59'0"N 105º49'45" E) of Bac Kan province (approx. 22°08'29" N 105°50'19" E),
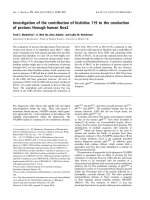
which is about 110 km from national capital Hanoi (Figure 1).
Bac Kan province is located in the northeastern mountainous region of Vietnam, and has a total
area of 21,159 ha. Total provincial population is 308,300 in 2016, and 80% of them are ethnic
minorities. The province consists of 7 districts and total 122 villages under the district level
(BKEIP, 2016). Since there is often a conflict in naming administrative unit between literatures,
PEN technical guideline is followed by using “village” to refer to the lowest official
administration level. Precise geographical of the two chosen villages are described in Figure 1.
Figure 1: Map of the study area
13
Table 1: Demographic and land use information of the study area*
Thanh Van village
Mai Lap village
Population (people)
2351
1576
Number of households
585
427
4
4
Number of poor households
91 (15.56%)
117 (27.40%)
Number of near-poor households
104 (17.78%)
93 (21.78%)
1
1
579 (98.97%)
414 (96.96%)
10
8
2713.5
4183.5
2557.0 (94.25%)
3884.5 (92.85)
Agricultural land area (ha)
141.0 (5.20%)
288.5 (6.90%)
Residential land area (ha)
15.5 (0.57%)
10.5 (0.25)
Number of ethnic groups
Number of health centers
Number
of
households
having
accessing to electricity
Number of hamlets
Total area (ha)
Forestland area (ha)
* Information is retrieved from village questionnaires answered by village leader and is updated until
31/12/2014
Being located in the Southwest of Bac Kan province, the two villages are almost next to each
other. With a tropical climate, local annual average temperature is 27oC and annual average
precipitation is from 80 to 100 mm. Both villages are characterized by huge areas of
mountainous and hilly terrains, leading to serious difficulties for economic development. Table
1 reports the basic information on demography and land use in the two villages.
High poverty rate is an outstanding characteristic of the two villages. On average, poverty rate
is 20.55%, which is more than double the national level, staying at about 8.2% in 2014 (GSO,
2014). Another typical feature of the study area which can be easily noticed from the table 1 is
14
a very high proportion of forestland. Furthermore, forest plantation has been long being
promoted for the sake of both forest coverage conservation and poverty alleviation. All those
characteristics make the two villages an intriguing study area for links between forest plantation
and the rural poor.
Local household economic strategies are highly diversified. Rice-farming is practiced by
almost all households; other main crops are corn and cassava. Households also grow various
kinds of vegetable, mostly for their own consumption, and orchards such as mandarin,
persimmon and plum. Importantly, as a result of developmental projects, banana cultivation is
very popular in both villages, especially in Thanh Van village. Livestock husbandry is one of
the most important means of living. Dominant livestock consists of pigs, buffalo and poultries.
Buffalos are raised for both meat and pulling service. Horses, goats and bees are kept by several
households at modest scales. Wage income from temporary employment is another significant
livelihood. Beside farm-related or forest-related part-time jobs, a large proportion of household
members reported their involvement in short-term construction works. Full-time jobs are
mainly officers in village governing bodies, teachers and health center employers, and there
are also household members working full-time outside the villages. In addition, a few
households have their self-own businesses. Common businesses are wine breweries, grocery
stores, small restaurants and trading agricultural products. Aquaculture is not popular because
of small fishing ponds.
Regarding forest-related activities, almost all of forestry lands in the two villages are classified
as productive forests, which means they are used for timber plantation. The local forestry land
transition follows a virtually similar pattern with what is discussed in section 3.3. From the
1980s to the 1990s, because of an inefficient management of local SFEs and a need of
additional agricultural land, local people occupied forestlands for their shifting cultivation. This
practice led to a severe decrease of vegetation coverage. There is almost no natural forests in
15
the region nowadays, because huge areas of them were cleared. After the reform of national
forest policies, households were given temporary forest management certificates, Green Books,
for the forestry land they had already grabbed, followed by afforestation movements. Those
temporary certificated were then changed to long-term certificates of forestry land-use right,
or Red Books. Productive forests land are basically solely used for forest plantation, although
some agricultural crops like corn and cassava can be cultivated as intercropping. Because the
local allocation process is about to complete, most of households in the study areas started to
grow trees on their forest parcels, which transformed barren hills to planted forest areas.
However, it is not the case that in all forestry lands tree are grown. There exist many forest
parcels left unplanted, due to either their location or household preference of their livelihoods.
Such places undergoes a natural succession process, which results in a dominance of bamboo
species and vine. There are also a few wooden tree in the unplanted parcels. The coexistence
of these secondary forests and planted forest lead to the fact the forest income in the study are
is not only from timber harvesting but also from collection of non-timber products, including
firewood, bamboo, bamboo shoots and wild fruits. Other forest income sources are wood
processing, which was reported by a fairly modest number of households, and forestry wage.
Forestry wage is income from employment, mostly part-time, in plantation based activities,
including planting, managing and logging.
16
5
5.1
METHODS
Data collection
5.1.1 Household survey
The household survey took place from August, 2015 to September, 2015. This survey was
conducted together with a project investigating the impacts of microcredit program provided
by Vietnam Bank for Social Policies (VBSP) on household welfare in the same region. As a
mutual goal of the two studies was to collect information on household characteristics and
income, there was no serious conflicts in questionnaire design and sampling. The detailed
process is described by the following sub-sections.
Questionnaires and pilot survey
As aforementioned in the literature review, quarterly surveys, which are initiated by PEN,
enable the collection of detailed information on income sources from respondents. Although
such rigorous method cannot be followed in this study because of resource constraints, PEN
prototype questionnaires are made use of for the sake of data collection. This prototype contains
questionnaires for one country survey, two village surveys, two annual household surveys and
quarterly household surveys (for more detail, see PEN prototype questionnaire version 4.4,
CIFOR (2008)). Among them, since the main survey of this study is conducted only once,
questionnaires for the first village survey (V1), first annual household survey (A1) and
quarterly household survey (Q1-Q4) were adopted. These are then modified so as to match the
features of the study area as well as available resources. In particular, as regards village survey,
because there is no forest user groups in the two villages, relevant questions are dropped from
the questionnaire. Moreover, meetings with village leaders is relatively time-limited, and focus
group discussions are impossibly conducted, leading to the exclusion of questions for “forest
resources base”. Given household-level questionnaire, the first annual household survey
questionnaire (A1) is used in order to get information on household characteristics. Similarly,
17
questions related to forest user group and “forest resources base” are removed. By contrast,
questions about household participation on microfinance services are integrated. Quarterly
household survey questionnaire is adapted for accounting household income from various
sources in 2014. Besides, household expenditures, including health, education and living
expenditure, are incorporated. Subsequently, three tentative questionnaires, namely “Village
information”, “Household characteristics” and “Household income and expenditure”, are
generated.
After the design of the survey questionnaire, a pilot survey was carried out in August, 2015.
Four investigators with university-educated level and sound experience in household survey
were hired for the conduction of this pilot survey as well as the later main one. These
investigators were judiciously explained about objectives of the study and details of
questionnaires beforehand. The very first step of the pilot survey was to meet authorities of
each village. Only by discussing with those leaders was permissions for the survey officially
obtained. Village information sheets were also distributed to them so as to obtain specific
village-level data. Importantly, village maps and lists of village households were provided by
village officers. Secondly, 45 households in the two villages were selected for pilot interviews,
which aimed mainly at testing the compatibility of the designed questionnaires. Thanks to those
interviews, initial questionnaires are significantly improved, so they are more suitable for local
practical situation. For example, since traditional house type in the locality is made from wood,
inhabitants were living in wooden houses no matter how well-off they are. Thus, questions for
housing material are removed. Significantly, household costs for their productive activities are
too miscellaneous, and a part of them are from a direct consumption of household products.
For instance, households raise chicken by corns that they have grown on their own. This
complexity, plus a one-year recall period, substantially precludes households from
remembering their production costs. As a result, though costs are desired to be collected, they
18
were reluctantly excluded. The final versions of questionnaires which are utilized for the joint
study could be seen in appendix A.
Main survey and data cleaning
In general, households are sampled based on a stratified method. With a view of taking a sample
that represents various characteristics of the study area, households in all hamlets of the two
villages are included. Since a list of households in as well as a list of VBSP members in each
village are available, non-member and member of VBSP credit program are randomly chosen
for the interviews. In addition, households in this region are classified into three economic
status: poor, near poor and medium and better-off. Such information is also available in the
household lists. Accordingly, selected households well covered all economic segments, and
there was no problematic concentrations in a particular status.
The main household survey was conducted in September, 2015, during which totally 352
households were interviews. Households were contacted in advance by the village officers, so
there was at least household heads or their spouses being at home when the interviewers visited.
One interview took about 50 minutes on average, which recorded detailed household
demographics, land use, assets, microfinance status, income from all family activities both in
cash and subsistence and some of their expenditure in 2014. After each interview, investigators
recorded GPS information of the household and took a picture of the main respondent. In
addition, investigators were required to personally rank the reliability of the whole answers
they got from the household members. There are three categories for this ranking: 1 means
poor reliability, 2 for medium reliability and 3 for very reliability. 12 households which had
been ranked 1 was then dropped from the sample. Subsequently, a total sample size of 340
households was taken to the next steps.
As regards data cleaning process, after data entry, inconsistent information are corrected by
contacting household members again via mobile phone and reconfirming the confused answers.
19
Importantly, because there is a severe difficulties of households in reporting their subsistence
income, which is a notorious drawback of the one year-recall period, this kind of income in
many activities is unavailable for a significant number of households. Meanwhile, cash
income-related information through selling home-grown products is available for all
households, which might be derived from that fact that cash income is easier to recall than
subsistence one (Mcelwee, 2008). Inconsideration of this contradiction, cash income from all
activities is taken as the sole proxy to reflect household total income. Furthermore, after total
cash income for a household is calculated, it is compared with household cash expenditure for
food to further examine the consistency of households’ responses. Household food expenditure
rather than total expenditure is chosen owing to the serious missing of data on household
savings. Although investigators did ask this item, most of the respondent refused to answer.
According to the result of this comparison, 30 households had their total cash income less than
their cash expenses for food, and 1 household rejected to report their food expenditure though
being contacted again. All these household are dropped from the sample. Next, one household
having extremely high cash income, nearly doubling that of the household with the second
highest cash income, is considered as an outlier and then also removed from the sample.
Eventually, a dataset of 308 households is processed to data analysis step.
Applied income definition
Due to the unavailability of information on costs, this study cannot follow the added value
measurement of income, which is applied in many other forest – poverty studies (e.g.
Cavendish, 2000; Fisher, 2004; Babulo et al., 2009; Rayamajhi, Smith-Hall, & Helles, 2012).
In other word, income is not subtracted by costs of input and labor. In addition, a difficulty in
recalling subsistence consumption prevent the aggregation of this income source. Thus, income
definition for almost all income categories is only cash inflow from selling products to the
market. Specific definitions of each category of cash income is described as following:
20
-
Forest cash income: Households in this region usually sell non-timber products at unit price
based on the agreement between households and traders. Hence, quantity and unit price
reported by households are used for calculating the sum of money that they get from selling
such products. Timbers are usually directly sold to traders at agreed price per cubic meter.
Some households, owing to their lacks of harvesting equipment, simply negotiate the total
price of all trees on their forest parcels with traders before selling them. Thus, quantity of
harvested timbers multiplied with unit price is used whenever they are available, otherwise
total price reported by households is used as cash income from timber products. Besides,
households also get cash inflow from forest –related part-time employments. Daily or
monthly cash wage from such activities is utilized for the calculation of annual cash income.
Another type of forest cash income is from forest management, which is available for just
5 households. Given this income sources, annual cash payment is recorded. Finally, several
households have income from wood-processing. For such activity, average monthly net
cash income, which is total revenue minus costs of timber as input, is used to calculate
income for the whole year. Justification for using net income is discussed later in self-own
business income item.
-
Crop cash income, livestock cash income and fishery cash income: Cash income from crop
consists of money from not only selling rice, corn and other staples but also from sales of
vegetable and fruits and wages from crop-related part time jobs. Livestock cash income is
all cash received from trading livestock meat, breeder and egg. Similar to non-timber
products, physical quantity and unit price reported by household are utilized to calculate
income from crop and livestock products. Regarding fishery cash income, households’
report of total cash gained from dealing in fish are used since physical unit is hard for them
to recall.
21