BẢNG TÍNH SÀN GIẢM TẢI LỘ TẺ RẠCH SỎI MẪU
Bạn đang xem bản rút gọn của tài liệu. Xem và tải ngay bản đầy đủ của tài liệu tại đây (6.1 MB, 301 trang )
ECONOMIC DEVELOPMENT
COOPERATION FUND
KOREA
Socialist Republic of Vietnam – Ministry of Transport (MOT) – Cuu Long CIPM
Lo Te – Rach Soi Highway Construction Project
August, 2015
PACKAGE CW1: KM02+104.11 – KM26+275.00
DETAILED DESIGN
Part III: Calculation Sheets – Volume 2: Soft Soil Treatment – 2.1: Pile Slab
LO TE – RACH SOI HIGHWAY CONSTRUCTION PROJECT
MINISTRY OF TRANSPORT
VIET NAM
LO TE – RACH SOI HIGHWAY CONSTRUCTION PROJECT
PACKAGE CW1: KM02+104.11 – KM26+275.00
DETAILED DESIGN
PART III: CALCULATION SHEETS
VOLUME 2: SOFT SOIL TREATMENT
2.1: PILE SLAB
August, 2015
CUU LONG CIPM
JOINT VENTURE OF
DASAN CONSULTANTS CO., LTD.
AND PYUNGHWA ENGINEERING CONSULTANTS LTD.
The Socialist Republic of Vietnam
Ministry of Transport (MOT)
Cuu Long CIPM
PACKAGE CW1: KM02+104.11 – KM26+275.00
DETAILED DESIGN
PART III: CALCULATION SHEETS
VOLUME 2: SOFT SOIL TREATMENT
2.1: PILE SLAB
This Document is revised and updated in accordance with the
Decisions no. 2809/QĐ-BGTVT dated on 05 August 2015
LO TE – RACH SOI HIGHWAY CONSTRUCTION PROJECT
Contract No.121/CIPM-HD
Name
Position
Signature
Date
Approved by
Wan Hyoung CHO
Project Manager
August, 2015
Checked by
Kwang Cheol LEE
Sr. Geotechnical Engineer
August, 2015
Prepared by
Do Thanh TUNG
Sr. Geotechnical Engineer
August, 2015
Viet Nam
Joint Venture:
DASAN Consultants Co., Ltd.
Geosong B/D, 5-66, Gumijungang-ro 42-gil,
Gumi-si, Gyengsangbuk-do, Korea
PYUNGHWA Engineering Consultants Ltd.
454, Gwanak-daero, Dongan-gu, Anyang-si,
Gyeonggi-do, Korea
Lo Te – Rach Soi Highway
Construction Project
(LTRS)
Calculation Sheets
August, 2015
Joint Venture
DASAN CONSULTANTS CO., LTD
PYUNGHWA ENGINEERING CONSULTANTS LTD
PROJECT
Lo Te – Rach Soi Highway Construction Project
STAGE
DETAILED DESIGN
CONTENT
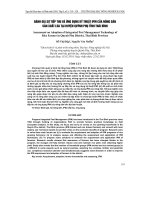
CALCULATION RESULT FOR PILE SLAB
No.
Bridge Name
1
BO AO
2
DOC DINH
3
SUA DUA
4
HAI PHO
5
TON CHAT
6
LY CHIEU
7
BON TONG
8
LANG SEN
9
THANH QUOI
10
QUAN HEN
11
QUAN BIEU
12
THAY KY
Abutment
A1
A2
A1
A2
A1
A2
A1
A2
A1
A2
A1
A2
A1
A2
A1
A2
A1
A2
A1
A2
A1
A2
A1
A2
Station
Start
End
km2+355
km2+375
km2+431
km2+451
km5+406
km5+431
km5+492
km5+512
km8+457
km8+477
km8+533
km8+543
km9+490
km9+505
km9+556
km9+576
km10+562
km10+572
km10+618
km10+648
km13+393
km13+418
km13+479
km13+499
km14+406
km14+416
km14+951
km14+981
km15+934
km15+949
km16+007
km16+027
km17+456
km17+471
km17+522
km17+542
km21+081
km21+096
km21+154
km21+184
km24+649
km24+669
km24+730
km24+750
km25+399
km25+419
km25+487
km25+517
HE
4.34
4.34
4.34
4.34
4.45
4.45
3.82
3.82
3.39
4.39
4.19
4.19
4.04
5.03
4.64
4.64
4.13
4.63
4.28
4.28
4.01
4.01
4.03
4.03
Slab length
FS
DD
20
20
20
20
20
25
20
25
10
20
10
20
20
15
20
15
30
10
30
10
20
25
20
25
30
10
30
15
20
15
20
15
20
15
20
15
30
15
30
15
20
20
20
20
30
20
30
20
Pile
length
30
31
26
29
31
31
30
29
29
30
28
30
26
25
29
27
21
26
20
26
28
25
30
29
Xn
2.20
2.20
2.20
2.20
2.20
2.20
2.30
2.30
2.40
2.20
2.20
2.20
2.30
2.10
2.10
2.10
2.20
2.10
2.20
2.20
2.30
2.30
2.30
2.30
Spacing
Yn
Xn
2.20 2.20
2.20 2.20
2.20 2.20
2.20 2.20
2.20 2.20
2.20 2.20
2.30 2.30
2.30 2.30
2.40 2.40
2.20 2.20
2.20 2.20
2.20 2.20
2.30 2.30
2.10 2.10
2.10 2.10
2.10 2.10
2.20 2.20
2.10 2.10
2.20 2.20
2.20 2.20
2.30 2.30
2.30 2.30
2.30 2.30
2.30 2.30
Yn
3.00
3.00
3.00
3.00
3.00
3.00
3.00
3.00
3.00
3.00
3.00
3.00
3.00
3.00
3.00
3.00
3.00
3.00
3.00
3.00
3.00
3.00
3.00
3.00
Bore hole
BA1-VST
BA2
DD-FS
DD1-VST
SD-FS
SD7
HP-FS
HP1-VST
TC4
TC-FS
LC-FS
LC1-VST
BT1-VST
BT13-VST
LS-FS
LS4
TQ-FS
TQ1-VST
QH-FS
QH4
QB-FS
QB1-VST
TK4
TK-FS
Internal Bearing Settlemen
force
capacity
t
595.37
618.44
48.65
595.37
644.01
43.68
588.38
649.22
37.28
588.38
590.19
40.91
609.41
624.45
65.53
609.41
646.35
70.18
599.98
624.08
61.87
599.98
601.77
71.67
623.32
642.25
53.29
637.02
650.90
61.16
571.82
629.90
63.98
571.82
595.44
67.54
644.13
677.04
49.03
615.36
670.86
46.06
584.87
622.79
64.68
584.87
832.93
60.75
584.13
610.05
53.31
583.84
585.49
42.35
602.57
632.34
52.89
602.57
628.96
48.82
612.10
616.50
41.73
612.10
668.73
56.11
608.88
653.15
20.55
608.88
829.98
27.29
Check
O.K.
O.K.
O.K.
O.K.
O.K.
O.K.
O.K.
O.K.
O.K.
O.K.
O.K.
O.K.
O.K.
O.K.
O.K.
O.K.
O.K.
O.K.
O.K.
O.K.
O.K.
O.K.
O.K.
O.K.
Joint Venture:
DASAN CONSULTANTS CO., LTD
PYUNGHWA ENGINEERING CONSULTANTS LTD
PROJECT
STAGE
CONTENT
BRIDGE
STATION
STANDARD
Lo Te – Rach Soi Highway Construction Project
DETAILED DESIGN
CALCULATION FOR PILE SLAB (PS)
BO AO BRIDGE
A_1: (KM2+355 ~ KM2+375 )
& A_2: (KM2+431 ~ KM2+451 )
22TCN-272-05
DIMENSIONS:
Content
Symbol
Value
Unit
WE
12.0
m
• Top abument elevations:
• Gradient:
• Density:
• Slope of talus:
• Thickness of pavement:
• Unit weight of structure:
Cm
i
γs
m
Δlp
γlp
6.86
1.05
18.0
1/2
0.550
22.5
m
%
kN/m³
• Top PS elevations:
• PS length:
• PS width:
Cs
Ls
W s1
2.50
20.00
29.36
m
m
m
• PS width:
W s2
28.52
m
• PS area:
♦ Embankment:
• Width of road surface:
m
kN/m³
• Pile slab:
As
578.80
m²
• PS thickness:
• Concrete pile:
• Pile diameter:
ds
0.30
m
dc
0.40
m
• Pile thickness:
tc
0.075
m
Page 1
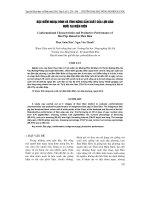
OUTLINE DRAWING
GENERAL VIEW OF PILE SLAB:
CROSS SECTION
Bmđ
Embankment
Geotextile
Pile PHC D=40cm
Embankment
ds
Bs
Geotextile
Pile PHC D=40cm
xn@yn
PILING PLAN
Bs
xn@yn
Y
a1
a1
b
xn@yn
Ls
1
2
3
4
5
6
7
8
9
10
11
12
13
14
15
16
17
18
19
20
21
22
23
24
`
0
X
b
a2
xn@yn
Bs
a2
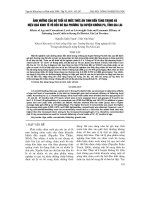
LOADS:
A- LIVE LOADS:
• HL93
Page 2
* Design truck or design tandem, Or
* Design lane load.
• Pedestrian loads
• Distribution load:
* Number
* Lane factor m
LIVE LOAD
=
=
3.0 Lane
0.85
HL93 Properties
Symbol
Value
Unit:
P1
35
kN
P2
145
kN
P3
145
kN
V1
4.3
m
V2
4.3
m
DESIGN TRUCK
OUTLINE DRAWING
V2
V1
TANDEM
LANES LOAD
P1
110
kN
P2
110
kN
d
PL
1.2
m
3.0
m
WL
9.3
kN/m
P1
P2
P3
P2
d
P1
WL
• Calculation the live loads distribution for PS:
• Lanes load
The design lane load shall consist, uniformly distributed in the longitudinal direction:
Tranverely width:
• Distribution load per area of PS:
• Truck loads:
• Distribution load per area of PS:
• For the design truck
• For the design tandem
B- DEAD LOADS:
• Height of embankment of PS at A_bument
• Slope of road:
Loads
HE
i
=
=
=
9.30 kN/m
3.00 m
3.10 kN/m²
=
=
3.45 kN/m²
2.34 kN/m²
=
=
4.34 m
1.05 %
Symbol
Value
Unit
• PS length:
Ls
20.00
m
• Averange He on embankment area:
HE
4.24
m
• PS width:
Bs
28.94
m
1- PS selfweight :
DC
5.40
kN/m²
2- Load of pavement structures:
DW
12.38
kN/m²
3- Load of embankment structures over of embankment:
EV1
• Averange He on embankment area:
HE1
3.69
m
EV1
15919
KN
• Distribution load per area of PS:
ev1
66.33
kN/m²
4- Load of embankment structures over of talus:
EV2
• Averange He of talus:
HE2
4.24
m
EV2
6457
KN
ev2
38.12
kN/m²
• Distribution load per area of PS:
Page 3
INTERNAL FORCE CALCULATION:
• Load combination:
Loads combinated according to 22 TCN 272-05 in Strength-I and Service limited with load factors
taken as 3.4.1-1 tA_ble
Combination
DC
LL
DW
EH
EV
LS
CT
Strength-I
Service
Special
1.25
1
1.25
1.75
1
0.5
1.5
1
1.5
1.5
1
1.5
1.3
1
1.35
1.75
1
0.5
0
0
1
Symbol
Value
Unit
P=Σpi.ki=
123.0
kN/m²
• Tranvesser distance between piles:
X n=
2.20
m
• Longitudinal distance between piles:
Yn=
2.20
m²
• Stressed area of 1 pile:
EV
4.84
KN
• Internal axial force max:
EV1
595.4
kN/m²
P=Σpi.ki=
56.3
kN/m²
• Tranvesser piles spacing:
X n=
2.20
m
• Longitudinal piles spacing:
Yn=
3.00
m²
6.60
CHECK:
Loads
STRUCTURE MODELING:
EMBANKMENT:
• Total stress caused by dead load and live load per 1m² of PS:
TALUS:
• Total stress caused by dead load and live load per 1m² of PS:
• Distribution load per area of PS
EV1
371.6
KN
kN/m²
Pmax
595.4
kN
Bore hole
BA1-VST
618.4
kN
Bore hole
BA2
644.0
kN
• Internal axial force max:
CHECK OF PILE CAPACITY
• Internal axial force max
• Bearing capacity:
• Check:
O.K.
SETTLEMENT CHECK:
Pmax
21758.0
kN
{S}
100
mm
Bore hole
BA1-VST
48.7
mm
Bore hole
BA2
48.7
mm
• Internal axial force max:
• Allow settlement:
• Calculation settlement:
• Check:
O.K.
Page 4
Joint Venture:
DASAN CONSULTANTS CO., LTD
PYUNGHWA ENGINEERING CONSULTANTS LTD
PROJECT
STAGE
CONTENT
BRIDGE
STATION
STANDARD
INPUT DATA:
• Pile diameter:
• Pile embedded length:
• Type Pile:
• Pile cross-sectional perimeter:
• Pile cross-sectional area:
• Pile distance:
• Pile concrete strength:
Lo Te – Rach Soi Highway Construction Project
DETAILED DESIGN
PRESTRESSING CAPACITY OF PILES
BO AO BRIDGE
ABUTMENTA1 (BOREHOLE BA1-VST)
22TCN-272-05
D
L
=
=
0.4 m
30.0 m
2.11
2.50
●
=
=
=
=
1.26
0.13
2.20
30.00
• Concrete unit weight:
γc
• Pile top elevations:
E1
=
2.5 m
E2
dSPT
Lsoil
C.m
=
=
=
-27.5 m
2.0 m
29.6 m
Driving
LK
E3
L_H
L3
BA1-VST
=
2.11 m
=
71.0 m
- m
• Piles tip elevation
• Parapet thickness:
• Pile length in soil:
• Method constryction (Bore:1, other:- ):
GEOTECHNICAL PARAMETER
• Borehole:
• Borehole elevation:
• Borehole depth:
• Casing length:
=
D0.4m
m
m²
1.11
m
MPa
L=30m
Soft layer
@=2.2m
2.50
24.5 kN/m³
-27.50
2.11
L=30m
P
Ab
a
f'c
Firm layer
D0.4m
@=2.2m
-27.50
PRESTRESSING CAPACITY OF PILES
No.
z (m)
Layer
Thickness
(m)
Type soil
Density
qu (kPa)
SPT
cc
eo
Status
1
2
3
4
5
6
7
8
9
10
11
12
1.11
-11.19
-22.09
-39.29
-45.49
-47.89
-62.89
-68.89
-
1
2
3B
4
9B
TK
9B
9C
-
1.00
12.30
10.90
17.20
6.20
2.40
15.00
6.00
-
Clay
Clay
Clay
Clay
Sand
Clay
Sand
Sand
-
17.00
14.80
19.40
19.90
20.30
20.40
20.30
20.30
-
19+z
99.8
150.0
150.0
-
14
20
22
21
22
75
-
0.760
0.200
0.133
0.133
-
0.500
2.040
0.760
0.700
0.580
0.620
0.580
0.580
Db/D=
soft soil
soft soil
40.78
71.0
Bearing capacity :
The factor bearing risistance of pile shall be taken as:
QR = ϕqp▪Qp + ϕqs▪Qs = ϕqp▪qp▪Ap + ϕqs▪qs▪As
Where:
Qp
Qs
Pile tip resistance
qp
Ap
[10.7.3.2-2, 3 & 4]
Pile shaft resistance
unit tip resistance of pile
qs
Pile cross-sectional area
As
surface area of pile shaft
φqs
resistance factor for pile shaft bearing resistance
φqp
resistance factor for pile tip bearing resistance
φqp=
• Cohesive Soil:
0.56 • Cohesive Soil:
• Cohesionless Soil:
φqp=
0.36 • Cohesionless Soil:
φqs=
φqs=
unit shaft resistance of pile
0.56
0.36
[Table 10.5.5-3 22TCN 272-05]
[10.5.5.2.4-1 AASHTO 2007]
SKIN FRICTION CAPACITY
Unit shaft resistance:
• Cohesionless Soil:
(NTB:
• Cohesive Soil:
(Su:
qs2=0.0019Ntb (MPa)
[10.7.3.4.2b]
average (uncorrected) SPT -blow count along the pile shaft (blows/300mm)
qs = α•Su (MPa) - ( Method α)
(10.7.3.3.2a-1)
average undrained shear strength)
( α: cohension factor appliped to Su)
α=0.5(σvtb/Su)0.45
With:
σv=γhi
Qs = P•∑(qs•li)•φqs
Skin frition capacity:
Qs
=
η•φqs•Qs =
PILE TIP BEARING CAPACITY
Unit tip resistance of pile
• Cohesive Soil:
• Cohesionless Soil:
608.9 kN
578.4 kN
where
(η=
qP = 9•Su (MPa)
Su
(Su: average undrained shear strength)
qp=0.038NcorrDb/D≤0.4Ncorr (MPa)
0.95
=
for Sand;
75 kPa
0.95
for Clay)
[10.7.3.4.2]
[10.7.3.3.3]
Ncorr=0.77log10(1.92/σ'v)N
ϕqp▪Qp=ϕqp▪qp▪Ap
Pile tip resistance:
• Soil type under pile tip:
qP
φqp•Qp
η•φqp•Qp
Clay
= 675.0 kPa
=
=
where
47.5 kN
45.1 kN
Bearing risistance of piles:
• Without Group Capacity Factor:
QR = φqp•Qp + φqs•Qs
• With Group Capacity Factor:
QR = η•φqp•Qp + η•φqs•Qs
0.95
656.4
kN =
66.91
Tone
=
623.6
kN =
63.56
Tone
QT ≤0.3•f'c•Ab
Pile Structural Capacity:
CHECK:
Check for axial load
Allowable pushing force of pile:
• Bearing capacity:
QR
• Internal axial force max:
• Weight of 1 pile:
• Weight of Soil:
=
623.6 kN
Pmax
=
W p=L.Ab*(γp-10) =
W s=σ'vtb.Ab =
595.4 kN
33.7 kN
QR=QR-W p+W s =
• Bearing capacity:
QR=
618kN
≥
for Sand;
=
QR = η•(φqp•Qp + φqs•Qs)
Soil Bearing Capacity:
Check:
(η=
Pmax
=
for Clay)
0.95
a=2.5D → η=0.65
a=6.0D → η=1.00
623.6 kN
63.6 Tone
1,131 kN
115.3 Tone
28.6 kN
618.4 kN
595kN
O.K.
%QR/Pmax
=
103.9%
=> η•φqs•Qs
Qs = P•∑(qs•li)•φqs
0.95 for Sand;
0.95
(η= where
(According to geological data at bode hole: BA1-VST)
SKIN FRICTION CAPACITY:
No.
0
1
2
3
4
5
6
7
8
9
10
11
12
13
14
15
16
17
18
19
20
21
22
23
24
25
26
27
28
29
30
31
32
33
34
35
36
37
38
39
40
41
42
43
44
45
46
47
48
49
50
Depth
li
Layer
Type
m
m
name
Soil
2.11
1.1
0.1
-1.9
-3.9
-5.9
-7.9
-9.9
-11.2
-11.9
-13.9
-15.9
-17.9
-19.9
-21.9
-22.1
-23.9
-25.9
-27.5
-27.9
-29.5
-29.9
-31.5
-31.9
-33.5
-33.9
-35.5
-35.9
-37.5
-37.9
-39.5
-39.9
-41.5
-41.9
-43.5
-43.9
-45.5
-45.9
-47.5
-47.9
-49.5
-49.9
-51.5
-51.9
-53.5
-53.9
-55.5
-55.9
-57.5
-57.9
-59.5
1.0
1.0
2.0
2.0
2.0
2.0
2.0
1.3
0.7
2.0
2.0
2.0
2.0
2.0
0.2
1.8
2.0
1.6
-
1
1
2
2
2
2
2
2
2
3B
3B
3B
3B
3B
3B
3B
4
4
4
4
4
4
4
4
4
4
4
4
4
4
9B
9B
9B
9B
9B
9B
TK
TK
TK
TK
9B
9B
9B
9B
9B
9B
9B
9B
9B
9B
9B
⁄ ⁄ ⁄ ⁄ ⁄ ⁄Clay
⁄ ⁄ ⁄ ⁄ ⁄ ⁄Clay
⁄ ⁄ ⁄ ⁄ ⁄ ⁄Clay
⁄ ⁄ ⁄ ⁄ ⁄ ⁄Clay
⁄ ⁄ ⁄ ⁄ ⁄ ⁄Clay
⁄ ⁄ ⁄ ⁄ ⁄ ⁄Clay
⁄ ⁄ ⁄ ⁄ ⁄ ⁄Clay
⁄ ⁄ ⁄ ⁄ ⁄ ⁄Clay
⁄ ⁄ ⁄ ⁄ ⁄ ⁄Clay
⁄ ⁄ ⁄ ⁄ ⁄ ⁄Clay
⁄ ⁄ ⁄ ⁄ ⁄ ⁄Clay
⁄ ⁄ ⁄ ⁄ ⁄ ⁄Clay
⁄ ⁄ ⁄ ⁄ ⁄ ⁄Clay
⁄ ⁄ ⁄ ⁄ ⁄ ⁄Clay
⁄ ⁄ ⁄ ⁄ ⁄ ⁄Clay
⁄ ⁄ ⁄ ⁄ ⁄ ⁄Clay
⁄ ⁄ ⁄ ⁄ ⁄ ⁄Clay
⁄ ⁄ ⁄ ⁄ ⁄ ⁄Clay
⁄ ⁄ ⁄ ⁄ ⁄ ⁄Clay
⁄ ⁄ ⁄ ⁄ ⁄ ⁄Clay
⁄ ⁄ ⁄ ⁄ ⁄ ⁄Clay
⁄ ⁄ ⁄ ⁄ ⁄ ⁄Clay
⁄ ⁄ ⁄ ⁄ ⁄ ⁄Clay
⁄ ⁄ ⁄ ⁄ ⁄ ⁄Clay
⁄ ⁄ ⁄ ⁄ ⁄ ⁄Clay
⁄ ⁄ ⁄ ⁄ ⁄ ⁄Clay
⁄ ⁄ ⁄ ⁄ ⁄ ⁄Clay
⁄ ⁄ ⁄ ⁄ ⁄ ⁄Clay
⁄ ⁄ ⁄ ⁄ ⁄ ⁄Clay
Clay
⁄ ⁄ ⁄ ⁄ ⁄ ⁄Sand
∙∙∙∙∙∙∙∙ Sand
∙∙∙∙∙∙∙∙ Sand
∙∙∙∙∙∙∙∙ Sand
∙∙∙∙∙∙∙∙ Sand
∙∙∙∙∙∙∙∙ Sand
∙∙∙∙∙∙∙∙ Clay
⁄ ⁄ ⁄ ⁄ ⁄ ⁄Clay
⁄ ⁄ ⁄ ⁄ ⁄ ⁄Clay
⁄ ⁄ ⁄ ⁄ ⁄ ⁄Clay
⁄⁄⁄⁄⁄⁄
∙∙∙∙∙∙∙∙ Sand
∙∙∙∙∙∙∙∙ Sand
∙∙∙∙∙∙∙∙ Sand
∙∙∙∙∙∙∙∙ Sand
∙∙∙∙∙∙∙∙ Sand
∙∙∙∙∙∙∙∙ Sand
∙∙∙∙∙∙∙∙ Sand
∙∙∙∙∙∙∙∙ Sand
∙∙∙∙∙∙∙∙ Sand
∙∙∙∙∙∙∙∙ Sand
∙∙∙∙∙∙∙∙ Sand
σ'vtb
7.2
12.2
22.2
32.1
42.1
52.1
62.1
68.6
75.3
94.5
113.6
132.8
152.0
171.2
173.1
191.3
211.4
227.7
-
NSPT
1
1
1
8
12
13
13
16
19
19
17
20
20
24
24
25
25
16
16
18
18
16
16
19
19
21
21
22
22
23
23
20
20
21
21
20
20
21
21
22
22
23
23
24
24
α
0.8
0.8
0.8
0.8
0.8
0.8
0.8
0.8
0.8
0.8
0.8
0.8
0.8
0.8
0.8
0.8
0.7
0.7
0.7
-
Driving
for Clay)
Su
qs
Qs
η•φqs•Qs
kPa
kPa
kN
kN
11.5
13.5
15.5
17.5
19.5
21.5
22.8
49.9
49.9
49.9
49.9
49.9
49.9
49.9
75.0
75.0
75.0
75.0
75.0
75.0
75.0
75.0
75.0
75.0
75.0
75.0
75.0
75.0
75.0
75.0
75.0
75.0
-
9.2
10.8
12.4
14.0
15.6
17.2
18.2
37.5
37.5
37.5
37.5
37.5
37.5
37.5
52.5
52.5
52.5
-
6.5
15.2
17.5
19.7
22.0
24.2
16.7
18.5
52.7
52.7
52.7
52.7
52.7
5.3
66.5
73.9
59.5
-
6.2
14.4
16.6
18.7
20.9
23.0
15.9
17.5
50.1
50.1
50.1
50.1
50.1
5.0
63.2
70.2
56.5
-
No.
Depth
li
Layer
Type
51
52
53
54
55
56
57
58
59
60
m
-59.9
-61.5
-61.9
-63.5
-63.9
-65.5
-65.9
-67.5
-67.9
-68.9
m
-
name
9B
9B
9B
9C
9C
9C
9C
9C
9C
9C
Soil
Sand
Sand
Sand
Sand
Sand
Sand
Sand
Sand
Sand
Sand
∙∙∙∙∙∙∙∙
∙∙∙∙∙∙∙∙
∙∙∙∙∙∙∙∙
∙∙∙∙∙∙∙∙
∙∙∙∙∙∙∙∙
∙∙∙∙∙∙∙∙
∙∙∙∙∙∙∙∙
∙∙∙∙∙∙∙∙
∙∙∙∙∙∙∙∙
∙∙∙∙∙∙∙∙
Sum Qs =
σ'vtb
NSPT
α
Su
qs
Qs
η•φqs•Qs
-
24
24
24
24
80
80
81
81
90
90
-
kPa
-
kPa
-
kN
-
kN
-
517.2
608.9
578.4
SETTLEMENT CALCULATION
BO AO BRIDGE
=
0.40
30.00
2.20
2.50
=
20.00
=
28.94
=
21758
BA1-VST
=
2.11
=
71.0
= -11.19
=
10.9
=
-22.1
=
16.3
=
-27.5
=
=
=
m
m
m
=21758
=2.11
=2.50
Soft
layer
m
m
m
kN
=-11.19
Firm
layer
=-22.1
m
m
m
m
m
m
m
=-27.5
• Type Pile
Lg
Ls
Ws
Qg
LK
E3
L_H
E3
2D p /3
• Effective depth taken as 2Db/3 (mm):
E4
• Effective elevation:
• Depth of embedment of piles in layer that provides support:
Dp
E2
• Pile tip elevation:
• Equivalent foundation dimension:
Lg
- Length
B
- Width
g
- Areas
A
=
=
=
2Db
3
D
L
a
n
E1
Db
3
I. INPUT DATA:
• Pile diameter:
• Pile embedded length:
• Pile distance:
• Number of pile:
• Pile top elevations:
• Pile cap dimension:
- Length
- Width
• Internal axial force max:
• Borehole
• Borehole elevation:
• Borehole depth:
• Soft soil bottom elevation:
Bg
19.00 m
27.94 m
530.9 m²
II. SETTLEMENT CALCULATION
Theo TCN 272-05 và tham khảo tài liệu phần 11.23 .Độ lún cố kết của nhóm cọc
• COHESIVE SOIL:
Formular:
Calculate the increased in effective stress caussed at middle of each soil layer bay the load Qg
(11.128) Độ lún cố kết của nhóm cọc
Calculate the Consolidation settlement of each layer caussed the increased stress
• COHESIVE SOIL:
No.
z (m)
Layer
Thickness
(m)
Type soil
SPT
eo
ccr
σo
Δσ
Sc (m)
1
2
3
4
5
6
7
8
9
10
-39.3
-45.5
-47.9
-62.9
-68.9
-
4
9B
TK
9B
9C
-
17.2
6.2
2.4
15.0
6.0
-
Clay
Sand
Clay
Sand
Sand
-
20
22
21
22
75
-
0.700
0.580
0.620
0.580
0.580
-
0.133
0.133
-
259.7
322.3
404.3
581.9
578.7
-
21.56
11.46
9.49
6.79
4.83
-
46.7
2.0
-
ΣSc=
• COHESIONLESS SOIL:
Formular:
Using SPT
Using CPT
where
• Effective elevation
E5
=
-39.3 m
48.7mm
• Net foundation pressure applied at 2Db/3.
• width or smallest dimension of pile group
• Influence factor of the effective group embedment (DIM)
• Effective depth taken as 2Db/3 (mm)
• Depth of embedment of piles in layer that provides support
• Uncorrected SPT -(blows/300mm)
q
=
0.013 Mpa
X
= 19,000 mm
I
=
0.93
D'
= 10,873 mm
Db
= 16,310 mm
N
=
22
N1effects
• SPT blow count corrected for both overburden and hammer efficiency
(blows/300
mm) as specified
=
17.71
60
N160 = CN N60 = CN (ER/60%) N
in Article 10.4.6.2.4
CN = {0.77log10(1.92/s'v)} and CN < 2.0
σv'
CN
ER
σ
Check:
ρ
v
ρ
=
=
=
=
0.173 Mpa
(Effective vertical stress MPa)
0.81
60% for conventional drop hammer using rope and cathead
0.0 mm
ΣSc
=
49mm
≤
100mm
O.K.
Joint Venture:
DASAN CONSULTANTS CO., LTD
PYUNGHWA ENGINEERING CONSULTANTS LTD
PROJECT
STAGE
CONTENT
BRIDGE
STATION
STANDARD
INPUT DATA:
• Pile diameter:
• Pile embedded length:
• Type Pile:
• Pile cross-sectional perimeter:
• Pile cross-sectional area:
• Pile distance:
• Pile concrete strength:
Lo Te – Rach Soi Highway Construction Project
DETAILED DESIGN
PRESTRESSING CAPACITY OF PILES
BO AO BRIDGE
ABUTMENTA2 (BOREHOLE BA2)
22TCN-272-05
D
L
=
=
0.4 m
31.0 m
2.37
2.00
●
=
=
=
=
1.26
0.13
2.20
30.00
• Concrete unit weight:
γc
• Pile top elevations:
E1
=
2.0 m
E2
dSPT
Lsoil
C.m
=
=
=
-29.0 m
2.0 m
31.0 m
Driving
LK
E3
L_H
L3
BA2
=
2.37 m
=
60.0 m
- m
• Piles tip elevation
• Parapet thickness:
• Pile length in soil:
• Method constryction (Bore:1, other:- ):
GEOTECHNICAL PARAMETER
• Borehole:
• Borehole elevation:
• Borehole depth:
• Casing length:
=
D0.4m
m
m²
0.97
m
MPa
L=31m
Soft layer
@=2.2m
2.00
24.5 kN/m³
-29.00
2.37
L=31m
P
Ab
a
f'c
Firm layer
D0.4m
@=2.2m
-29.00
PRESTRESSING CAPACITY OF PILES
No.
z (m)
Layer
Thickness
(m)
Type soil
Density
qu (kPa)
SPT
cc
eo
Status
1
2
3
4
5
6
7
8
9
10
11
12
0.97
-12.03
-23.93
-38.33
-50.43
-57.63
-
1
2
3B
4
5A
9C
-
1.40
13.00
11.90
14.40
12.10
7.20
-
Clay
Clay
Clay
Clay
Sand
Sand
-
17.00
14.80
19.40
19.90
20.30
20.30
-
19+z
99.8
150.0
-
15
18
24
64
-
0.760
0.200
0.133
-
0.500
2.040
0.760
0.700
0.580
0.580
Db/D=
soft soil
soft soil
41.50
60.0
Bearing capacity :
The factor bearing risistance of pile shall be taken as:
QR = ϕqp▪Qp + ϕqs▪Qs = ϕqp▪qp▪Ap + ϕqs▪qs▪As
Where:
Qp
Qs
Pile tip resistance
qp
Ap
[10.7.3.2-2, 3 & 4]
Pile shaft resistance
unit tip resistance of pile
qs
Pile cross-sectional area
As
surface area of pile shaft
φqs
resistance factor for pile shaft bearing resistance
φqp
resistance factor for pile tip bearing resistance
φqp=
• Cohesive Soil:
0.56 • Cohesive Soil:
• Cohesionless Soil:
φqp=
0.36 • Cohesionless Soil:
φqs=
φqs=
unit shaft resistance of pile
0.56
0.36
[Table 10.5.5-3 22TCN 272-05]
[10.5.5.2.4-1 AASHTO 2007]
SKIN FRICTION CAPACITY
Unit shaft resistance:
• Cohesionless Soil:
(NTB:
• Cohesive Soil:
(Su:
qs2=0.0019Ntb (MPa)
[10.7.3.4.2b]
average (uncorrected) SPT -blow count along the pile shaft (blows/300mm)
qs = α•Su (MPa) - ( Method α)
(10.7.3.3.2a-1)
average undrained shear strength)
( α: cohension factor appliped to Su)
α=0.5(σvtb/Su)0.45
With:
σv=γhi
Qs = P•∑(qs•li)•φqs
Skin frition capacity:
Qs
=
η•φqs•Qs =
PILE TIP BEARING CAPACITY
Unit tip resistance of pile
• Cohesive Soil:
• Cohesionless Soil:
635.3 kN
603.6 kN
where
(η=
qP = 9•Su (MPa)
Su
(Su: average undrained shear strength)
qp=0.038NcorrDb/D≤0.4Ncorr (MPa)
0.95
=
for Sand;
75 kPa
0.95
for Clay)
[10.7.3.4.2]
[10.7.3.3.3]
Ncorr=0.77log10(1.92/σ'v)N
ϕqp▪Qp=ϕqp▪qp▪Ap
Pile tip resistance:
• Soil type under pile tip:
qP
φqp•Qp
η•φqp•Qp
Clay
= 675.0 kPa
=
=
where
47.5 kN
45.1 kN
Bearing risistance of piles:
• Without Group Capacity Factor:
QR = φqp•Qp + φqs•Qs
• With Group Capacity Factor:
QR = η•φqp•Qp + η•φqs•Qs
0.95
682.8
kN =
69.61
Tone
=
648.7
kN =
66.13
Tone
QT ≤0.3•f'c•Ab
Pile Structural Capacity:
CHECK:
Check for axial load
Allowable pushing force of pile:
• Bearing capacity:
QR
• Internal axial force max:
• Weight of 1 pile:
• Weight of Soil:
=
648.7 kN
Pmax
=
W p=L.Ab*(γp-10) =
W s=σ'vtb.Ab =
595.4 kN
34.9 kN
QR=QR-W p+W s =
• Bearing capacity:
QR=
644kN
≥
for Sand;
=
QR = η•(φqp•Qp + φqs•Qs)
Soil Bearing Capacity:
Check:
(η=
Pmax
=
for Clay)
0.95
a=2.5D → η=0.65
a=6.0D → η=1.00
648.7 kN
66.1 Tone
1,131 kN
115.3 Tone
30.2 kN
644.0 kN
595kN
O.K.
%QR/Pmax
=
108.2%
=> η•φqs•Qs
Qs = P•∑(qs•li)•φqs
0.95 for Sand;
0.95
(η= where
(According to geological data at bode hole: BA2)
SKIN FRICTION CAPACITY:
No.
0
1
2
3
4
5
6
7
8
9
10
11
12
13
14
15
16
17
18
19
20
21
22
23
24
25
26
27
28
29
30
31
32
33
34
35
36
37
38
39
40
41
42
43
44
45
46
47
48
Depth
li
Layer
Type
m
m
name
Soil
2.37
1.0
0.4
-1.6
-3.6
-5.6
-7.6
-9.6
-11.6
-12.0
-13.6
-15.6
-17.6
-19.6
-21.6
-23.6
-23.9
-25.6
-27.6
-29.0
-29.6
-31.0
-31.6
-33.0
-33.6
-35.0
-35.6
-37.0
-37.6
-39.0
-39.6
-41.0
-41.6
-43.0
-43.6
-45.0
-45.6
-47.0
-47.6
-49.0
-49.6
-51.0
-51.6
-53.0
-53.6
-55.0
-55.6
-57.0
-57.6
1.4
0.6
2.0
2.0
2.0
2.0
2.0
2.0
0.4
1.6
2.0
2.0
2.0
2.0
2.0
0.3
1.7
2.0
1.4
-
1
1
2
2
2
2
2
2
2
2
3B
3B
3B
3B
3B
3B
3B
4
4
4
4
4
4
4
4
4
4
4
4
5A
5A
5A
5A
5A
5A
5A
5A
5A
5A
5A
5A
9C
9C
9C
9C
9C
9C
9C
9C
⁄ ⁄ ⁄ ⁄ ⁄ ⁄Clay
⁄ ⁄ ⁄ ⁄ ⁄ ⁄Clay
⁄ ⁄ ⁄ ⁄ ⁄ ⁄Clay
⁄ ⁄ ⁄ ⁄ ⁄ ⁄Clay
⁄ ⁄ ⁄ ⁄ ⁄ ⁄Clay
⁄ ⁄ ⁄ ⁄ ⁄ ⁄Clay
⁄ ⁄ ⁄ ⁄ ⁄ ⁄Clay
⁄ ⁄ ⁄ ⁄ ⁄ ⁄Clay
⁄ ⁄ ⁄ ⁄ ⁄ ⁄Clay
⁄ ⁄ ⁄ ⁄ ⁄ ⁄Clay
⁄ ⁄ ⁄ ⁄ ⁄ ⁄Clay
⁄ ⁄ ⁄ ⁄ ⁄ ⁄Clay
⁄ ⁄ ⁄ ⁄ ⁄ ⁄Clay
⁄ ⁄ ⁄ ⁄ ⁄ ⁄Clay
⁄ ⁄ ⁄ ⁄ ⁄ ⁄Clay
⁄ ⁄ ⁄ ⁄ ⁄ ⁄Clay
⁄ ⁄ ⁄ ⁄ ⁄ ⁄Clay
⁄ ⁄ ⁄ ⁄ ⁄ ⁄Clay
⁄ ⁄ ⁄ ⁄ ⁄ ⁄Clay
⁄ ⁄ ⁄ ⁄ ⁄ ⁄Clay
⁄ ⁄ ⁄ ⁄ ⁄ ⁄Clay
⁄ ⁄ ⁄ ⁄ ⁄ ⁄Clay
⁄ ⁄ ⁄ ⁄ ⁄ ⁄Clay
⁄ ⁄ ⁄ ⁄ ⁄ ⁄Clay
⁄ ⁄ ⁄ ⁄ ⁄ ⁄Clay
⁄ ⁄ ⁄ ⁄ ⁄ ⁄Clay
⁄ ⁄ ⁄ ⁄ ⁄ ⁄Clay
⁄ ⁄ ⁄ ⁄ ⁄ ⁄Clay
Clay
⁄ ⁄ ⁄ ⁄ ⁄ ⁄Sand
∙∙∙∙∙∙∙∙ Sand
∙∙∙∙∙∙∙∙ Sand
∙∙∙∙∙∙∙∙ Sand
∙∙∙∙∙∙∙∙ Sand
∙∙∙∙∙∙∙∙ Sand
∙∙∙∙∙∙∙∙ Sand
∙∙∙∙∙∙∙∙ Sand
∙∙∙∙∙∙∙∙ Sand
∙∙∙∙∙∙∙∙ Sand
∙∙∙∙∙∙∙∙ Sand
∙∙∙∙∙∙∙∙ Sand
∙∙∙∙∙∙∙∙ Sand
∙∙∙∙∙∙∙∙ Sand
∙∙∙∙∙∙∙∙ Sand
∙∙∙∙∙∙∙∙ Sand
∙∙∙∙∙∙∙∙ Sand
∙∙∙∙∙∙∙∙ Sand
∙∙∙∙∙∙∙∙ Sand
∙∙∙∙∙∙∙∙ Sand
∙∙∙∙∙∙∙∙
Sum Qs =
σ'vtb
10.1
13.1
23.0
33.0
43.0
53.0
63.0
72.9
74.9
90.3
109.5
128.6
147.8
167.0
186.2
189.1
206.2
226.4
240.2
-
NSPT
10
12
14
16
17
19
19
21
20
20
15
15
15
15
16
16
21
21
22
22
23
23
24
24
25
25
24
24
24
24
26
26
81
81
82
82
51
51
54
α
0.8
0.8
0.8
0.8
0.8
0.8
0.8
0.8
0.8
0.8
0.8
0.8
0.8
0.8
0.8
0.8
0.8
0.7
0.7
0.7
-
Driving
for Clay)
Su
qs
Qs
η•φqs•Qs
kPa
kPa
kN
kN
11.5
13.5
15.5
17.5
19.5
21.5
23.5
23.9
49.9
49.9
49.9
49.9
49.9
49.9
49.9
75.0
75.0
75.0
75.0
75.0
75.0
75.0
75.0
75.0
75.0
75.0
75.0
-
9.2
10.8
12.4
14.0
15.6
17.2
18.8
19.1
37.5
37.5
37.5
37.5
37.5
37.5
37.5
52.5
52.5
52.5
-
3.9
15.2
17.5
19.7
22.0
24.2
26.5
5.4
42.2
52.7
52.7
52.7
52.7
52.7
7.9
62.8
73.9
50.7
-
3.7
14.4
16.6
18.7
20.9
23.0
25.1
5.1
40.1
50.1
50.1
50.1
50.1
50.1
7.5
59.7
70.2
48.2
-
536.8
635.3
603.6
SETTLEMENT CALCULATION
BO AO BRIDGE
=
0.40
31.00
2.20
2.00
=
20.00
=
28.94
=
21758
BA2
=
2.37
=
60.0
= -12.03
=
11.3
=
-23.3
=
17.0
=
-29.0
=
=
=
m
m
m
=21758
=2.37
=2.00
Soft
layer
m
m
m
kN
=-12.03
Firm
layer
=-23.3
m
m
m
m
m
m
m
=-29.0
• Type Pile
Lg
Ls
Ws
Qg
LK
E3
L_H
E3
2D p /3
• Effective depth taken as 2Db/3 (mm):
E4
• Effective elevation:
• Depth of embedment of piles in layer that provides support:
Dp
E2
• Pile tip elevation:
• Equivalent foundation dimension:
Lg
- Length
B
- Width
g
- Areas
A
=
=
=
2Db
3
D
L
a
n
E1
Db
3
I. INPUT DATA:
• Pile diameter:
• Pile embedded length:
• Pile distance:
• Number of pile:
• Pile top elevations:
• Pile cap dimension:
- Length
- Width
• Internal axial force max:
• Borehole
• Borehole elevation:
• Borehole depth:
• Soft soil bottom elevation:
Bg
19.00 m
27.94 m
530.9 m²
II. SETTLEMENT CALCULATION
Theo TCN 272-05 và tham khảo tài liệu phần 11.23 .Độ lún cố kết của nhóm cọc
• COHESIVE SOIL:
Formular:
Calculate the increased in effective stress caussed at middle of each soil layer bay the load Qg
(11.128) Độ lún cố kết của nhóm cọc
Calculate the Consolidation settlement of each layer caussed the increased stress
• COHESIVE SOIL:
No.
z (m)
Layer
Thickness
(m)
Type soil
SPT
eo
ccr
σo
Δσ
Sc (m)
1
2
3
4
5
6
7
8
9
10
-38.3
-50.4
-57.6
-
4
5A
9C
-
15.0
12.1
7.2
-
Clay
Sand
Sand
-
18
24
64
-
0.700
0.580
0.580
-
0.133
-
258.8
382.7
473.3
-
23.18
11.10
7.47
-
43.7
-
ΣSc=
• COHESIONLESS SOIL:
Formular:
Using SPT
Using CPT
where
• Effective elevation
E5
=
-38.3 m
43.7mm
• Net foundation pressure applied at 2Db/3.
• width or smallest dimension of pile group
• Influence factor of the effective group embedment (DIM)
• Effective depth taken as 2Db/3 (mm)
• Depth of embedment of piles in layer that provides support
• Uncorrected SPT -(blows/300mm)
q
=
0.015 Mpa
X
= 19,000 mm
I
=
0.93
D'
= 11,315 mm
Db
= 16,972 mm
N
=
24
N1effects
• SPT blow count corrected for both overburden and hammer efficiency
(blows/300
mm) as specified
=
18.85
60
N160 = CN N60 = CN (ER/60%) N
in Article 10.4.6.2.4
CN = {0.77log10(1.92/s'v)} and CN < 2.0
σv'
CN
ER
σ
Check:
ρ
v
ρ
=
=
=
=
0.183 Mpa
(Effective vertical stress MPa)
0.79
60% for conventional drop hammer using rope and cathead
0.0 mm
ΣSc
=
44mm
≤
100mm
O.K.
Joint Venture:
DASAN CONSULTANTS CO., LTD
PYUNGHWA ENGINEERING CONSULTANTS LTD
PROJECT
STAGE
CONTENT
BRIDGE
STATION
STANDARD
Lo Te – Rach Soi Highway Construction Project
DETAILED DESIGN
CALCULATION FOR PILE SLAB (PS)
DOC DINH BRIDGE
A_1: (KM5+406 ~ KM5+431 )
& A_2: (KM5+492 ~ KM5+512 )
22TCN-272-05
DIMENSIONS:
Content
Symbol
Value
Unit
WE
12.0
m
• Top abument elevations:
• Gradient:
• Density:
• Slope of talus:
• Thickness of pavement:
• Unit weight of structure:
Cm
i
γs
m
Δlp
γlp
6.05
0.92
18.0
1/2
0.550
22.5
m
%
kN/m³
• Top PS elevations:
• PS length:
• PS width:
Cs
Ls
W s1
1.00
25.00
29.36
m
m
m
• PS width:
W s2
28.44
m
• PS area:
♦ Embankment:
• Width of road surface:
m
kN/m³
• Pile slab:
As
722.50
m²
• PS thickness:
• Concrete pile:
• Pile diameter:
ds
0.30
m
dc
0.40
m
• Pile thickness:
tc
0.075
m
Page 1
OUTLINE DRAWING
GENERAL VIEW OF PILE SLAB:
CROSS SECTION
Bmđ
Embankment
Geotextile
Pile PHC D=40cm
Embankment
ds
Bs
Geotextile
Pile PHC D=40cm
xn@yn
PILING PLAN
Bs
xn@yn
Y
a1
a1
b
xn@yn
Ls
1
2
3
4
5
6
7
8
9
10
11
12
13
14
15
16
17
18
19
20
21
22
23
24
`
0
X
b
a2
xn@yn
Bs
a2
LOADS:
A- LIVE LOADS:
• HL93
Page 2
* Design truck or design tandem, Or
* Design lane load.
• Pedestrian loads
• Distribution load:
* Number
* Lane factor m
LIVE LOAD
=
=
3.0 Lane
0.85
HL93 Properties
Symbol
Value
Unit:
P1
35
kN
P2
145
kN
P3
145
kN
V1
4.3
m
V2
4.3
m
DESIGN TRUCK
OUTLINE DRAWING
V2
V1
TANDEM
LANES LOAD
P1
110
kN
P2
110
kN
d
PL
1.2
m
3.0
m
WL
9.3
kN/m
P1
P2
P3
P2
d
P1
WL
• Calculation the live loads distribution for PS:
• Lanes load
The design lane load shall consist, uniformly distributed in the longitudinal direction:
Tranverely width:
• Distribution load per area of PS:
• Truck loads:
• Distribution load per area of PS:
• For the design truck
• For the design tandem
B- DEAD LOADS:
• Height of embankment of PS at A_bument
• Slope of road:
Loads
HE
i
=
=
=
9.30 kN/m
3.00 m
3.10 kN/m²
=
=
2.76 kN/m²
1.87 kN/m²
=
=
4.34 m
0.92 %
Symbol
Value
Unit
• PS length:
Ls
25.00
m
• Averange He on embankment area:
HE
4.23
m
• PS width:
Bs
28.90
m
1- PS selfweight :
DC
5.40
kN/m²
2- Load of pavement structures:
DW
12.38
kN/m²
3- Load of embankment structures over of embankment:
EV1
• Averange He on embankment area:
HE1
3.68
m
EV1
19845
KN
• Distribution load per area of PS:
ev1
66.15
kN/m²
4- Load of embankment structures over of talus:
EV2
• Averange He of talus:
HE2
4.23
m
EV2
8033
KN
ev2
38.03
kN/m²
• Distribution load per area of PS:
Page 3
INTERNAL FORCE CALCULATION:
• Load combination:
Loads combinated according to 22 TCN 272-05 in Strength-I and Service limited with load factors
taken as 3.4.1-1 tA_ble
Combination
DC
LL
DW
EH
EV
LS
CT
Strength-I
Service
Special
1.25
1
1.25
1.75
1
0.5
1.5
1
1.5
1.5
1
1.5
1.3
1
1.35
1.75
1
0.5
0
0
1
Symbol
Value
Unit
P=Σpi.ki=
121.6
kN/m²
• Tranvesser distance between piles:
X n=
2.20
m
• Longitudinal distance between piles:
Yn=
2.20
m²
• Stressed area of 1 pile:
EV
4.84
KN
• Internal axial force max:
EV1
588.4
kN/m²
P=Σpi.ki=
56.2
kN/m²
• Tranvesser piles spacing:
X n=
2.20
m
• Longitudinal piles spacing:
Yn=
3.00
m²
6.60
CHECK:
Loads
STRUCTURE MODELING:
EMBANKMENT:
• Total stress caused by dead load and live load per 1m² of PS:
TALUS:
• Total stress caused by dead load and live load per 1m² of PS:
• Distribution load per area of PS
EV1
370.8
KN
kN/m²
Pmax
588.4
kN
Bore hole
DD-FS
649.2
kN
Bore hole
DD1-VST
590.2
kN
• Internal axial force max:
CHECK OF PILE CAPACITY
• Internal axial force max
• Bearing capacity:
• Check:
O.K.
SETTLEMENT CHECK:
Pmax
26936.3
kN
{S}
100
mm
Bore hole
DD-FS
37.3
mm
Bore hole
DD1-VST
37.3
mm
• Internal axial force max:
• Allow settlement:
• Calculation settlement:
• Check:
O.K.
Page 4
Joint Venture:
DASAN CONSULTANTS CO., LTD
PYUNGHWA ENGINEERING CONSULTANTS LTD
PROJECT
STAGE
CONTENT
BRIDGE
STATION
STANDARD
INPUT DATA:
• Pile diameter:
• Pile embedded length:
• Type Pile:
• Pile cross-sectional perimeter:
• Pile cross-sectional area:
• Pile distance:
• Pile concrete strength:
Lo Te – Rach Soi Highway Construction Project
DETAILED DESIGN
PRESTRESSING CAPACITY OF PILES
DOC DINH BRIDGE
ABUTMENTA1 (BOREHOLE DD-FS)
22TCN-272-05
D
L
=
=
0.4 m
26.0 m
1.42
1.00
●
=
=
=
=
1.26
0.13
2.20
30.00
• Concrete unit weight:
γc
• Pile top elevations:
E1
=
1.0 m
E2
dSPT
Lsoil
C.m
=
=
=
-25.0 m
2.0 m
26.0 m
Driving
LK
E3
L_H
L3
DD-FS
=
1.42 m
=
73.0 m
- m
• Piles tip elevation
• Parapet thickness:
• Pile length in soil:
• Method constryction (Bore:1, other:- ):
GEOTECHNICAL PARAMETER
• Borehole:
• Borehole elevation:
• Borehole depth:
• Casing length:
=
D0.4m
m
m²
0.42
m
MPa
L=26m
Soft layer
@=2.2m
1.00
24.5 kN/m³
-25.00
1.42
L=26m
P
Ab
a
f'c
Firm layer
D0.4m
@=2.2m
-25.00
PRESTRESSING CAPACITY OF PILES
No.
z (m)
Layer
Thickness
(m)
Type soil
Density
qu (kPa)
SPT
cc
eo
Status
1
2
3
4
5
6
7
8
9
10
11
12
0.42
-19.58
-22.78
-34.28
-44.58
-65.58
-68.08
-71.58
-
1
2
3
5A
6B
6C
8B
7
-
1.00
20.00
3.20
11.50
10.30
21.00
2.50
3.50
-
Clay
Clay
Clay
Sand
Clay
Clay
Clay
Sand
-
17.00
14.80
19.50
20.30
20.40
20.40
20.40
20.30
-
19+z
104.0
230.0
230.0
230.0
-
1
15
28
14
17
35
99
-
0.760
0.200
0.133
0.133
0.133
-
0.500
2.040
0.760
0.580
0.620
0.620
0.630
0.580
Db/D=
soft soil
soft soil
12.50
73.0
Bearing capacity :
The factor bearing risistance of pile shall be taken as:
QR = ϕqp▪Qp + ϕqs▪Qs = ϕqp▪qp▪Ap + ϕqs▪qs▪As
Where:
Qp
Qs
Pile tip resistance
qp
Ap
[10.7.3.2-2, 3 & 4]
Pile shaft resistance
unit tip resistance of pile
qs
Pile cross-sectional area
As
surface area of pile shaft
φqs
resistance factor for pile shaft bearing resistance
φqp
resistance factor for pile tip bearing resistance
φqp=
• Cohesive Soil:
0.56 • Cohesive Soil:
• Cohesionless Soil:
φqp=
0.36 • Cohesionless Soil:
φqs=
φqs=
unit shaft resistance of pile
0.56
0.36
[Table 10.5.5-3 22TCN 272-05]
[10.5.5.2.4-1 AASHTO 2007]
SKIN FRICTION CAPACITY
Unit shaft resistance:
• Cohesionless Soil:
(NTB:
• Cohesive Soil:
(Su:
qs2=0.0019Ntb (MPa)
[10.7.3.4.2b]
average (uncorrected) SPT -blow count along the pile shaft (blows/300mm)
qs = α•Su (MPa) - ( Method α)
(10.7.3.3.2a-1)
average undrained shear strength)
( α: cohension factor appliped to Su)
α=0.5(σvtb/Su)0.45
With:
σv=γhi
Qs = P•∑(qs•li)•φqs
Skin frition capacity:
Qs
=
η•φqs•Qs =
PILE TIP BEARING CAPACITY
Unit tip resistance of pile
• Cohesive Soil:
• Cohesionless Soil:
288.2 kN
273.8 kN
where
0.95
for Sand;
0.95
qP = 9•Su (MPa)
[10.7.3.4.2]
(Su: average undrained shear strength)
qp=0.038NcorrDb/D≤0.4Ncorr (MPa)
[10.7.3.3.3]
Ncorr=0.77log10(1.92/σ'v)N
=
22
N
=
for Clay)
27
ϕqp▪Qp=ϕqp▪qp▪Ap
Pile tip resistance:
• Soil type under pile tip:
qP
φqp•Qp
η•φqp•Qp
Sand
= 8,944.0 kPa
=
=
where
404.6 kN
384.4 kN
Bearing risistance of piles:
• Without Group Capacity Factor:
QR = φqp•Qp + φqs•Qs
• With Group Capacity Factor:
QR = η•φqp•Qp + η•φqs•Qs
(η=
0.95
692.8
kN =
70.63
Tone
=
658.2
kN =
67.09
Tone
QT ≤0.3•f'c•Ab
Pile Structural Capacity:
CHECK:
Check for axial load
Allowable pushing force of pile:
• Bearing capacity:
QR
• Internal axial force max:
• Weight of 1 pile:
• Weight of Soil:
=
658.2 kN
Pmax
=
W p=L.Ab*(γp-10) =
W s=σ'vtb.Ab =
588.4 kN
29.2 kN
QR=QR-W p+W s =
• Bearing capacity:
QR=
649kN
≥
for Sand;
=
QR = η•(φqp•Qp + φqs•Qs)
Soil Bearing Capacity:
Check:
(η=
Pmax
=
for Clay)
0.95
a=2.5D → η=0.65
a=6.0D → η=1.00
658.2 kN
67.1 Tone
1,131 kN
115.3 Tone
20.3 kN
649.2 kN
588kN
O.K.
%QR/Pmax
=
110.3%
=> η•φqs•Qs
Qs = P•∑(qs•li)•φqs
0.95 for Sand;
0.95
(η= where
(According to geological data at bode hole: DD-FS)
SKIN FRICTION CAPACITY:
No.
0
1
2
3
4
5
6
7
8
9
10
11
12
13
14
15
16
17
18
19
20
21
22
23
24
25
26
27
28
29
30
31
32
33
34
35
36
37
38
39
40
41
42
43
44
45
46
47
48
49
50
Depth
li
Layer
Type
m
m
name
Soil
1.42
0.4
-0.6
-2.6
-4.6
-6.6
-8.6
-10.6
-12.6
-14.6
-16.6
-18.6
-19.6
-20.6
-22.6
-22.8
-24.6
-25.0
-26.6
-27.0
-28.6
-29.0
-30.6
-31.0
-32.6
-33.0
-34.6
-35.0
-36.6
-37.0
-38.6
-39.0
-40.6
-41.0
-42.6
-43.0
-44.6
-45.0
-46.6
-47.0
-48.6
-49.0
-50.6
-51.0
-52.6
-53.0
-54.6
-55.0
-56.6
-57.0
-58.6
1.0
1.0
2.0
2.0
2.0
2.0
2.0
2.0
2.0
2.0
2.0
1.0
1.0
2.0
0.2
1.8
0.4
-
1
1
2
2
2
2
2
2
2
2
2
2
2
3
3
3
5A
5A
5A
5A
5A
5A
5A
5A
5A
5A
6B
6B
6B
6B
6B
6B
6B
6B
6B
6B
6B
6C
6C
6C
6C
6C
6C
6C
6C
6C
6C
6C
6C
6C
6C
⁄ ⁄ ⁄ ⁄ ⁄ ⁄Clay
⁄ ⁄ ⁄ ⁄ ⁄ ⁄Clay
⁄ ⁄ ⁄ ⁄ ⁄ ⁄Clay
⁄ ⁄ ⁄ ⁄ ⁄ ⁄Clay
⁄ ⁄ ⁄ ⁄ ⁄ ⁄Clay
⁄ ⁄ ⁄ ⁄ ⁄ ⁄Clay
⁄ ⁄ ⁄ ⁄ ⁄ ⁄Clay
⁄ ⁄ ⁄ ⁄ ⁄ ⁄Clay
⁄ ⁄ ⁄ ⁄ ⁄ ⁄Clay
⁄ ⁄ ⁄ ⁄ ⁄ ⁄Clay
⁄ ⁄ ⁄ ⁄ ⁄ ⁄Clay
⁄ ⁄ ⁄ ⁄ ⁄ ⁄Clay
⁄ ⁄ ⁄ ⁄ ⁄ ⁄Clay
⁄ ⁄ ⁄ ⁄ ⁄ ⁄Clay
⁄ ⁄ ⁄ ⁄ ⁄ ⁄Clay
Clay
⁄ ⁄ ⁄ ⁄ ⁄ ⁄Sand
∙∙∙∙∙∙∙∙ Sand
∙∙∙∙∙∙∙∙ Sand
∙∙∙∙∙∙∙∙ Sand
∙∙∙∙∙∙∙∙ Sand
∙∙∙∙∙∙∙∙ Sand
∙∙∙∙∙∙∙∙ Sand
∙∙∙∙∙∙∙∙ Sand
∙∙∙∙∙∙∙∙ Sand
∙∙∙∙∙∙∙∙ Sand
∙∙∙∙∙∙∙∙ Clay
⁄ ⁄ ⁄ ⁄ ⁄ ⁄Clay
⁄ ⁄ ⁄ ⁄ ⁄ ⁄Clay
⁄ ⁄ ⁄ ⁄ ⁄ ⁄Clay
⁄ ⁄ ⁄ ⁄ ⁄ ⁄Clay
⁄ ⁄ ⁄ ⁄ ⁄ ⁄Clay
⁄ ⁄ ⁄ ⁄ ⁄ ⁄Clay
⁄ ⁄ ⁄ ⁄ ⁄ ⁄Clay
⁄ ⁄ ⁄ ⁄ ⁄ ⁄Clay
⁄ ⁄ ⁄ ⁄ ⁄ ⁄Clay
⁄ ⁄ ⁄ ⁄ ⁄ ⁄Clay
⁄ ⁄ ⁄ ⁄ ⁄ ⁄Clay
⁄ ⁄ ⁄ ⁄ ⁄ ⁄Clay
⁄ ⁄ ⁄ ⁄ ⁄ ⁄Clay
⁄ ⁄ ⁄ ⁄ ⁄ ⁄Clay
⁄ ⁄ ⁄ ⁄ ⁄ ⁄Clay
⁄ ⁄ ⁄ ⁄ ⁄ ⁄Clay
⁄ ⁄ ⁄ ⁄ ⁄ ⁄Clay
⁄ ⁄ ⁄ ⁄ ⁄ ⁄Clay
⁄ ⁄ ⁄ ⁄ ⁄ ⁄Clay
⁄ ⁄ ⁄ ⁄ ⁄ ⁄Clay
⁄ ⁄ ⁄ ⁄ ⁄ ⁄Clay
⁄ ⁄ ⁄ ⁄ ⁄ ⁄Clay
⁄ ⁄ ⁄ ⁄ ⁄ ⁄Clay
⁄ ⁄ ⁄ ⁄ ⁄ ⁄Clay
⁄⁄⁄⁄⁄⁄
σ'vtb
7.2
12.2
22.2
32.1
42.1
52.1
62.1
72.1
82.0
92.0
102.0
107.0
116.7
136.1
138.0
156.9
161.3
-
NSPT
1
1
1
1
1
1
11
17
17
27
27
29
29
32
32
27
27
26
26
11
11
12
12
13
13
11
11
15
15
29
29
19
19
16
16
15
15
16
16
15
15
15
15
16
α
0.7
0.7
0.7
0.7
0.6
0.6
0.6
0.6
0.6
0.6
0.6
0.6
0.6
0.5
0.5
0.5
-
Driving
for Clay)
Su
qs
Qs
η•φqs•Qs
kPa
kPa
kN
kN
11.5
13.5
15.5
17.5
19.5
21.5
23.5
25.5
27.5
29.5
30.5
52.0
52.0
52.0
115.0
115.0
115.0
115.0
115.0
115.0
115.0
115.0
115.0
115.0
115.0
115.0
115.0
115.0
115.0
115.0
115.0
115.0
115.0
115.0
115.0
115.0
115.0
115.0
115.0
7.6
8.8
9.9
11.0
12.1
13.1
14.1
15.1
16.0
16.9
17.3
24.2
24.2
24.2
51.3
51.3
-
5.4
12.4
14.0
15.5
17.1
18.5
19.9
21.2
22.5
23.7
12.2
17.0
34.0
3.4
41.8
9.7
-
5.1
11.8
13.3
14.8
16.2
17.6
18.9
20.2
21.4
22.5
11.5
16.2
32.3
3.2
39.7
9.3
-