Cost implications for propoor REDD+ in Lam Dong Province, Vietnam Opportunity costs and benefit distribution systems
Bạn đang xem bản rút gọn của tài liệu. Xem và tải ngay bản đầy đủ của tài liệu tại đây (923.77 KB, 48 trang )
REDD+ country report
Cost implications for pro-poor REDD+
in Lam Dong Province, Vietnam
Opportunity costs and benefit distribution systems
Matthew Ogonowski and Adrian Enright
First published by the International Institute for Environment and Development (UK) in 2013
Copyright © International Institute for Environment and Development
All rights reserved
For a full list of publications please contact:
International Institute for Environment and Development (IIED)
80-86 Gray’s Inn Road, London WC1X 8NH
Tel: +44 (0)20 3463 7399
Fax: +44 (0)20 3514 9055
pubs.iied.org
Citation: Ogonowski, M. and Enright, A. 2013. Cost implications for pro-poor REDD+ in Lam Dong
Province, Vietnam: opportunity costs and benefit distribution systems, IIED, London.
This document has been produced with the financial assistance of the Norwegian Government
through Norad, as part of a multi-country project coordinated by IIED in partnership with UMB on
Poverty and Sustainable Development Impacts of REDD Architecture. The views expressed in this
document are the sole responsibility of the authors and do not necessarily represent the views
of the institutions involved in this project or of Norad.
Design by: Eileen Higgins, email:
Copy edited by: Holly Ashley, email:
Cover photo: Aulia Erlangga/CIFOR
Poverty and sustainable development impacts of REDD architecture;
options for equity growth and the environment
About this project...
Poverty and sustainable development impacts of REDD architecture is a multi-country
project led by the International Institute for Environment and Development (IIED, UK) and
the Norwegian University of Life Sciences (Aas, Norway). It started in July 2009 and will
continue to December 2013. The project is funded by the Norwegian Agency for Development
Cooperation (Norad) as part of the Norwegian Government’s Climate and Forest Initiative. The
partners in the project are Fundação Amazonas Sustentável (Brazil); Hamilton Resources and
Consulting (Ghana); Netherlands Development Organisation (SNV) (Vietnam); Sokoine University
of Agriculture, Faculty of Forestry and Nature Conservation (Tanzania); and Makerere University,
Faculty of Forestry and Nature Conservation (Uganda).
The project aims to increase understanding of how different options for REDD design and
policy at international, national and sub-national level will affect achievement of greenhouse
gas emission reduction and co-benefits of sustainable development and poverty reduction. As
well as examining the internal distribution and allocation of REDD payments under different
design option scenarios at both international and national level, the project will work with
selected REDD pilot projects in each of the five countries to generate evidence and improve
understanding on the poverty impacts of REDD pilot activities, the relative merits of different
types of payment mechanisms and the transaction costs.
Acknowledgements
This report has been published under the Poverty and sustainable development impacts of
REDD architecture: options for equity, growth and the environment project generously funded
by the Norwegian Agency for Development Cooperation (Norad). The Netherlands Development
Organisation (SNV) is implementing activities in Vietnam under this project with our project
partners the International Institute for Environment and Development (IIED) and the Norwegian
University of Life Sciences (UMB), Norway.
Matthew Ogonowski is a former consultant for SNV based in Washington, DC. Mr Ogonowski is
now employed at the US Agency for International Development (USAID) Global Climate Change
Office. Adrian Enright is an environmental economics advisor in the SNV REDD+ programme,
Vietnam. The opinions and views expressed in this paper are those of the authors and not
necessarily those of USAID and SNV.
The authors would like to thank Maryanne Grieg-Gran and Essam Yassin Mohammed of IIED who
reviewed earlier drafts of this report. Participants in the workshop ‘What does it take to achieve
pro-poor REDD+?’ held in Doha on 29th November 2012 also gave constructive feedback, which
has helped to improve this report.
For further information on SNV’s REDD+ project in Lam Dong, publications and other REDD+
projects managed globally by SNV, please visit: snvworld.org/redd
Contents
Executive summary
1
Background
3
1. Assessing pro-poor opportunity costs and applications to LEDPs
1.1 Opportunity cost analysis of REDD+ in Bao Lam and Cat Tien districts
1.1.1 Methodology and assumptions
1.1.2 Changes made to the previous SNV analysis
1.1.3 Checks on assumptions
1.2 Limitations of opportunity cost analysis
1.3Results
1.3.1 REDD+ forest and opportunity cost analysis
1.3.2 Considering the value of timber harvested
1.4 Discussion: implications for pro-poor REDD+ and poverty reduction
5
5
5
6
8
10
12
12
20
22
2. Additional costs of pro-poor REDD+
2.1 Benefit distribution systems for REDD+
2.2 Measuring the costs of pro-poor BDS
2.2.1 Methodology
2.2.2 Limitations
2.3Results
2.4Discussion
2.5 Further extensions to this work
25
25
26
26
27
28
29
30
3.Conclusions
31
References
33
Annex 1: Assumptions for crop types, prices and net present value
Annex 2: Land-cover change data for Bao Lam and Cat Tien districts, 2000–2010
Annex 3: Key assumptions and notes relating to different cost categories
35
37
39
List of figures, boxes and tables
Figure
Figure
Figure
Figure
Figure
Figure
1. Map of Bao Lam and Cat Tien Districts, Lam Dong Province, Vietnam
2. NPV by land type/use
3. Bao Lam abatement cost curve (excluding carbon sequestration values of crops)
4. Cat Tien abatement cost curve (excluding carbon sequestration values of crops)
A2-1 Bao Lam transition matrix (ha)
A2-2 Cat Tien transition matrix (ha)
Box 1.
Table
Table
Table
Table
Table
Table
Table
Table
Table
Table
Table
Table
Table
Table
1.
2.
3.
4.
Guiding principles for pro-poor BDS
NPV and carbon contents by land type/use
Change in natural forest cover in Bao Lam District, 2000–2010
Change in natural forest cover in Cat Tien District, 2000–2010
Opportunity costs for Bao Lam and Cat Tien districts: enhancement of carbon
stocks in forests and undeveloped lands (US$/tonne CO2)
5.
Opportunity costs for Bao Lam and Cat Tien districts: conversion of forests and
undeveloped lands (US$/tonne CO2)
6.
Opportunity cost results for Bao Lam and Cat Tien districts: carbon sequestration
options on developed lands (US$/tonne CO2)
7.
Current timber market prices, Ha Tinh Province (million VN$ per m3)
8.
2010 market and local crop prices in the central highlands (US$)
9.
Opportunity costs for Bao Lam and Cat Tien districts including potential timber
sales (US$/tonne CO2)
10. Relative importance of different crops in terms of income
(where ‘1’ is highest importance)
11. Cost types and classifications
12. Results of the BDS cost analysis
13. Breakdown of different cost components
A1-1 Crop sales, cost and price assumptions
4
8
18
18
37
38
4
7
12
13
13
17
19
20
21
21
25
26
29
29
36
Executive summary
SNV has developed a programme with an emphasis on designing approaches to promote propoor REDD+ and integrate these approaches into national and sub-national REDD+ decision
making. This paper contributes to the existing SNV efforts by achieving two objectives.
The first relates to the evaluation of the economic viability of REDD+ in two forested districts
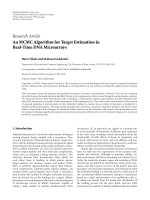
of Vietnam in Lam Dong province (Bao Lam and Cat Tien, see Figure 1), with an emphasis on
investigating how opportunity costs can help to identify the land-use options most relevant
to poor actors there. This section of the report will also explore the potential benefits and
challenges associated with the use of opportunity cost estimation. This will be achieved through
a quantitative evaluation of 30-year net present values of future profits from alternative land
uses conducted using the World Agroforestry Center’s REDD Abacus model,1 along with fieldbased cost data and land-use change estimates with associated changes in carbon stocks from
2000–2010. This is followed by a qualitative discussion of the implications for pro-poor REDD+.
Although opportunity costs may help to identify low-cost options for REDD+ in poorer areas, other
supporting mechanisms must be put in place to facilitate the delivery of a pro-poor model of
REDD+ and avoid situations where the poor may be made worse off in the pursuit of low-cost
REDD+ activities. Part II of the report provides a preliminary investigation of the costs associated
with one fundamental component of the pro-poor approach: the local benefit distribution system
(BDS). This analysis is a first attempt at quantifying such costs. This section is therefore aimed
at provoking further discussion and investigations into the implementation costs of REDD+ in
Vietnam rather than providing definitive estimates of the costs of pro-poor BDS models.
1
Key findings
Part I of the analysis found that from 2000–2010 both districts experienced significant
deforestation, with losses of natural forest cover equal to 13 per cent in Bao Lam and 19 per
cent in Cat Tien. CO2 emissions from clearance and degradation of the six main forest types
totalled 5.3 million tonnes and 2.1 million tonnes, respectively. The study identified a number of
pro-poor REDD+ options which could potentially be employed in the two districts. In particular,
afforestation/reforestation (A/R) and forest regeneration represent ‘win-win’ options that can
improve rural livelihoods and increase carbon stocks at the same time, with a net benefit of
US$1–3 per tonne CO2-equivalent sequestered for most options. These activities can thus be
profitable for small farmers if implementation and other project costs can be kept low enough.
The results also show that REDD+ is competitive with many of the key agricultural land-use
options already used by farmers in the districts. The opportunity costs for converting most forest
types to rice, other annual crops, cashews and tea are all around US$4 per tonne or less, making
them appropriate potential areas for REDD+ projects. At current carbon prices on the voluntary
market (around US$5 a tonne), REDD+ could therefore enable poor farmers in Bao Lam and Cat
Tien to potentially increase their incomes by choosing to preserve natural forests. For coffee,
while the opportunity cost is more than double the assumed carbon price, the US$11–12 per
tonne value is well within the range of prices that would be anticipated on a future international
compliance market for REDD+. Only the opportunity cost of rubber (US$95 per tonne and up)
remains far outside the expected price range of carbon markets. The assumptions used were
1. See code.google.com/p/redd-abacus
Cost implications for pro-poor REDD+ in Lam Dong Province, Vietnam: opportunity costs and benefit distribution systems
for a large-scale, modern plantation however, so opportunity costs for small-scale individual
rubber projects in the districts will likely be significantly lower. The analysis also demonstrated
the importance of harvesting and sales of non-timber forest products (NTFPs) for REDD+.
Furthermore, the analysis highlights the importance of carbon accounting methods to the
viability of REDD+. In particular, when the values of carbon for different crops are included in
calculations, the opportunity costs of all alternative land uses increase substantially, although
most still remain well below US$10 per tonne.
However, the estimation and use of opportunity costs also face a number of potential
challenges. These include:
ndifficulties in obtaining high-quality and up-to-date data;
nlimited capacity and shortages of trained personnel, particularly at the sub-national level; and
ndeveloping assumptions and procedures related to prices and costs, and accounting for forest
degradation and the value of NTFPs and ecosystem services.
The report concludes that when properly developed and utilised, opportunity cost analysis
can help low-income farmers to benefit from REDD+, and even to attain higher incomes in
some cases. More broadly, low-emissions development plans (LEDPs) can benefit greatly from
incorporating robust opportunity cost analysis. National climate policymakers and international
REDD+ donors alike should make education and training on opportunity costs a priority.
2
Part II of the analysis suggests that the set-up and operational costs of a pro-poor BDS model
will roughly equate to an additional US$25 per household over the initial five years. Up to 98
per cent of this additional cost can be attributed to the costs of conducting community-level
participatory approaches to select benefit types, timing and governance structures.
A qualitative discussion of these results reveals that there are several ways these costs could be
lowered by achieving economies of scale. There also exist opportunities for non-governmental
organisations (NGOs) and other sources of funding to cover the up-front costs of such
approaches. Compared to alternative approaches, this would significantly lower the additional
cost of a pro-poor approach to BDS design. Future applications of pro-poor approaches to BDS
design should also explore opportunities to combine activities with complementary, locally
based interventions, including free, prior informed consent (FPIC) processes.
This section of the report concludes by recommending further investigations into the costs of
pro-poor REDD+ BDS. In particular, better identifying the number of households eligible for
benefits under REDD+ will improve the accuracy of the costs of BDS per household. Also, looking
at additional components of a pro-poor approach will provide a more complete picture of the
total additional costs for implementing organisations. Finally, future estimates of the costs of
pro-poor models for BDS will greatly benefit from using post-implementation data rather than
relying on speculative estimates of certain costs.
REDD+ Country Reports
Background
Reducing Emissions from Deforestation and Forest Degradation (REDD+) has emerged as a key
mechanism for addressing the link between climate change and changes in the composition of
forests globally. Initially focusing on deforestation (RED), the concept soon expanded to include forest
degradation (REDD) and later added the ‘+’ component to include three additional types of activities:
conservation; sustainable management of forests; and enhancement of forest carbon stocks.
In many rural areas of developing countries, many factors encourage poor communities to clear
forest areas, and to use the remaining forests unsustainably. These include low agricultural
yields, unpredictable harvests, lack of other non-agricultural sources of income and the
inevitable reliance on wood for fuel.
REDD+ now provides a pathway to help poor farmers and communities improve their livelihoods
while lowering emissions. In recent years, international REDD+ support programmes, national
plans and sub-national projects have been implemented or are under development. A voluntary
REDD+ market is available for new projects, international donors are providing direct assistance
to REDD+ readiness programmes2 and there are payments for performance.3 By providing a
predictable and sustainable source of income to poor communities, REDD+ has the potential to
both reduce poverty and lower emissions associated from deforestation and degradation.
3
A key tool in the development of REDD+ will be the estimation and evaluation of opportunity
costs. Opportunity costs provide a measure of the competitiveness of REDD+ by measuring the
potential future profits that could be obtained through alternative land uses. This in turn can be
used to represent the minimum cash payment landholders would require for them to protect
a forest landscape instead of converting it into an alternative type of land-use (e.g. crops,
livestock) or otherwise degrading the forest.
The first part of this paper aims to contribute to the existing SNV effort by achieving two
objectives:
nevaluating the economic viability of REDD+ in two forested districts of Vietnam in Lam Dong
Province (Bao Lam and Cat Tien), with an emphasis on investigating how opportunity costs
can help to identify the land-use options most relevant to poor actors there; and
nexploring the potential benefits and challenges associated with estimating opportunity costs
in the design and implementation of REDD+ in Vietnam and elsewhere.
Although opportunity costs may help to identify opportunities for implementing a pro-poor
approach to REDD+ (see Box 1), many other costs are associated with implementing and
operating the intervention. One key cost influencing the implementation of pro-poor REDD+ will
be those associated with the benefit distribution system (BDS).
The BDS will be responsible for the delivery of benefits (either cash or in-kind) to those either
directly or indirectly involved in REDD+ activities. The BDS will need to engage local actors,
including poor constituents, in decisions around the most efficient and effective BDS. This
2. See e.g. UN-REDD (www.un-redd.org) and World Bank Forest Carbon Partnership Facility
(www.forestcarbonpartnership.org).
3. See e.g. Norway-Indonesia Partnership (www.norway.or.id/Norway_in_Indonesia/Environment/-FAQ-NorwayIndonesia-REDD-Partnership-/) and World Bank Carbon Finance Unit (www.wbcarbonfinance.org).
Cost implications for pro-poor REDD+ in Lam Dong Province, Vietnam: opportunity costs and benefit distribution systems
engagement and the systems put in place to deliver benefits will come at a cost. Yet the size
of these costs – and the implications they have for the viability of pro-poor REDD+ – are largely
unknown in the context of Vietnam. Part II of the report therefore takes a preliminary look at
some of the key costs associated with implementing pro-poor BDS. The results will be explored
in terms of their effect on the viability of REDD+ in Cat Tien and Bao Lam and balanced with a
set of options for reducing these costs.
Figure 1. Map of Bao Lam and Cat Tien Districts, Lam Dong Province, Vietnam
4
Box 1. Guiding principles for pro-poor BDS
A ‘pro-poor’ approach has been defined in a range of different ways in the context of REDD+, other payments for
ecosystem service systems and pro-poor development (see Mohammed 2011; Pernia 2003; Lindhjem et al. 2010
and Pagiola 2007). Here a ‘pro-poor BDS’ is considered as being guided by five key principles:
1. The inclusion of stakeholders in decisions around benefit types, timing and distribution methods, recognising
their individual and collective identities.
2. Promoting cost-effective distribution methods, efficiency and transparency.
3. REDD+ has a net positive effect on poorer stakeholders involved in REDD+ activities and promotes sustainable
livelihoods.
4. REDD+ benefits are shared in accordance with considerations of distributional justice, equity, equality and
need.
5. Local BDS mechanisms should be compatible with existing government arrangements where appropriate.
Source: Enright et al. (2012)
REDD+ Country Reports
Assessing pro-poor opportunity
costs and applications to LEDPs
1
1.1 Opportunity cost analysis of REDD+ in Bao Lam and Cat Tien districts
1.1.1 Methodology and assumptions
SNV previously conducted two first-order opportunity cost analyses for the districts. The first was
conducted by Holland and McNally (2010). This preliminary analysis largely relied on interviews
with sub-national authorities to help to establish estimates of net present value (NPV) and
patterns of recent land use and rates of deforestation. The second analysis conducted in 2011
set out to build on the 2010 results by establishing more site-specific economic estimates. It was
based on a survey of 280 households engaged in agriculture, along with SNV’s own research of
prices and costs associated with key crops and land-use options (Nguyen and Enright 2012). Each
household provided data on the area harvested, annual output and quantity sold for one or more
individual crops for a given year. Information was provided to develop bottom-up estimates of
net annual profits using assumed prices and production costs for cashews, coffee and tea. This
and other information was then used to develop the following sets of inputs:
n Net present value of key land-use options: Using spreadsheet analysis, an estimate of the net
present value (NPV) of the associated profits was developed for each major natural forest/land
type and land-use option already used in the districts. This analysis assumed a 30-year revenue
stream holding current prices and production costs constant in real terms, using a 10% discount
rate.4 This value was also considered a conservative compromise of the range of discount rates
in the relevant opportunity cost literature (e.g. Grieg-Gran 2008; Borner and Wunder 2008). The
NPV for the three crops (cashews, coffee and tea) was estimated using the average net annual
profit of households in the survey.5 NPVs for forests and all other agricultural and land-use
options were estimated based on SNV’s experience, and similar exercises by Hoang et al. (2010)
and JICA (2011). For forests and shrub land, the NPV was developed primarily from the potential
income that could be received from harvesting and sales of non-timber forest products (NTFPs).6
5
n Treatment of timber cleared for agricultural operations: Current conditions in the districts
suggest that a portion of the timber cleared from forested areas for conversion into crop lands is
often sold in a one-off deal at the start of operations, with the remainder burned as fuel or used
for construction. SNV conducted research into this area but encountered significant difficulties
with measuring the different values of these timber sales. In addition, despite interviews with
a number of key stakeholders, SNV was unable to identify a consistent pattern from which
a general assumption regarding use of the cleared timber could be made. It was therefore
assumed that 100 per cent of the timber cleared in the first year for agriculture or other
development activities was used directly by the landholder and not sold, hence the cash income
from felling timber is assumed to be zero (although the landowner will receive some non-cash
benefits through the use of the timber). SNV did however conduct a sensitivity analysis that
evaluated the potential impact of including the forgone profits from potential sales of timber.
This analysis is presented in the results section.
n Carbon content estimates for each major natural forest type and land-use option were
developed with values used in other opportunity cost estimates for Vietnam, namely from Hoang
et al. (2010). The analysis assumed that agricultural or other development would require clear
4. A 10% discount rate was used to remain consistent with previous estimates conducted by SNV (Holland and McNally 2010).
5. The NPV is calculated as follows: NPV = ∑ [(Q*P/A) – C)] / (1 + 0.1)r where Q =quantity sold, P = price per unit sold in
US$ per tonne, A = area cultivated in ha, C = production cost per ha, and r = year, summed from year 1 to year 30.
6. Further details on the NPV assumptions and data are included in Annex 1 and section 1.1.3 Checks on assumptions.
Cost implications for pro-poor REDD+ in Lam Dong Province, Vietnam: opportunity costs and benefit distribution systems
cutting of forest lands, therefore it was assumed that 100 per cent of the carbon content in the
natural forests would be released (this serves as the business-as-usual scenario).
nA land-cover transition matrix was developed for each district based on land-use maps for
2000, 2005 and 2010 for the two districts. These datasets were then converted into landuse change matrices for the decade 2000 to 2010 by the Centre for Remote Sensing and
Agricultural Planning, National Institute of Agricultural Planning and Projection (NIAPP). The
matrices for each district illustrated the total area of each forest type and land-use option in
the districts for 2000 and 2010, and displayed how each individual category has changed over
the ten-year period. The transition matrices with the data used for this study are presented in
Annex 2.
The original data and assumptions were used for the updated analysis described in this paper,
subject to several modifications. These changes are detailed in the next section.
1.1.2 Changes made to the previous SNV analysis
To produce improved and more up-to-date estimates of opportunity costs, the following changes
were made to the original input data used with the REDD Abacus model:
6
nUpdated land-cover transition matrices were obtained and input for both districts. This data
includes the changes in land-cover from 2000–2010 for 18 land-use categories in Bao Lam and
15 categories in Cat Tien. The data was sourced from the Lam Dong Department of Natural
Resources and Environment (DONRE) and processed by NIAPP.
nThe updated transition matrices included a new category, shrub land, which was not in the
original SNV data analysis. It was therefore necessary to develop NPV and carbon content
assumptions for this category. For the NPV, it was noted that compared to forest land, shrub
land generally has a low value due to the limited availability of NTFPs. To be conservative
the cost was therefore set at zero. The carbon content was obtained by taking the general
Intergovernmental Panel on Climate Change (IPCC) above-ground biomass value for tropical
shrub land in continental Asia (60 tonnes per ha) and applying a carbon content factor of 0.47.
The carbon content was thus set at 28 tonnes per ha.
A significant change involved the carbon content assumptions used for crops and other non-forest
areas. In the original analysis, SNV included assumed carbon contents for these categories in
the model, so estimates of emissions from deforestation were net of the carbon sequestered by
crops. This was considered to give a conservative estimate of the emission reductions achievable
and was reflected in a somewhat higher opportunity cost per tonne of emissions reduced. In this
new study, it was considered useful to make estimates excluding the carbon stocks of agricultural
land uses. This is because there is uncertainty over the carbon contents of agricultural land uses,
given that they are location- and crop-specific, and because discussions on national reference
level estimation have focused on changes in the extent and quality of forest cover, rather than the
carbon content of the land uses replacing forest. This has the effect of lowering the opportunity
cost per unit of emission reduction.
The carbon contents of all categories that are not natural forests were set to zero. The carbon
content assumptions for natural (medium, poor, conifer, mixed, bamboo and young) forest were
kept as before; the value for shrub land was set at the (non-zero) value discussed above. While it
remains unclear whether shrub land by itself could qualify under a REDD+ scheme, it is reasonable
to assume it might be eligible if part of a larger forest ecosystem. For transitions leading to a net
increase in carbon stocks (sequestration options), however, the net change in carbon stocks was
used to calculate the opportunity cost.
REDD+ Country Reports
It should be noted however that the carbon content of some crops can be substantial, especially
in tree crops such as forest plantations and rubber. To illustrate the importance of carbon
accounting and baseline determination for the estimation of carbon stocks, a second analysis was
conducted using carbon sequestration values for the key crops grown in Bao Lam and Cat Tien.
These values were derived from Hoang et al. (2009) and JICA (2011), and are illustrated in green
in Table 1 below.
The above data was fed into the REDD Abacus model and analysed offline to develop initial
estimates of carbon emissions and opportunity costs per unit of carbon dioxide equivalent
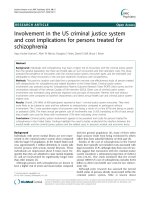
(CO2e) for each land-use type in the districts. Table 1 below displays the NPV and carbon content
assumptions used in this analysis; Figure 2 overleaf plots the NPVs. Note that, for simplicity, this
analysis assumes that forest quality remains constant over the 30-year period of the analysis. In
reality, the quality of forest stands would in many cases decrease over time due to degradation
from NTFP harvesting. This will in turn produce a decline in the corresponding NPV values and
carbon contents for each category shown in Table 1.7 In some medium forests, NPV values may
rise in the near term as NTFP harvesting increases from a very low level. Over time, however,
these forests will also experience a decrease in NPV. The classification of some forests will change
as well due to NTFP harvesting, degradation, changes in local climate and other factors (the
transitions between forest types already observed in the districts can be seen in Annex 2). On
the other hand, protected forests with minimal NTFP harvesting would see an increase in carbon
stocks as lower-quality forests recover – an option that will be explored later in this report.
Table 1. NPV and carbon contents by land type/use
Land type/use
NPV (US$/ha)
Medium forest (80–150m3/ha)
300
Carbon (tonnes/ha)8
103
Carbon (tonnes/ha) –
inclusive of crop values
103
Poor forest (<80m /ha)
600
87
87
Conifer forest
600
87
87
3
Mixed forest
600
87
87
Bamboo forest
600
87
87
Young forest (regeneration)
300
35
35
Shrub land
0
28
28
Bare land
0
0
4
Shifting cultivation
Rice field
400
0
15
1200
0
5
Other annual crops
1200
0
5
Forest plantations
1300
0
33
Cashews
17539
0
50
1951
0
1510
Tea
Coffee
4384
0
50
3100011
0
50
Built-up area
2000
0
0
Water body
2000
0
0
Rubber*
7
* Due to limitations on the availability of data, the NPV for rubber is for a large-scale, modern industrial plantation. The
actual opportunity cost for small-scale individual rubber projects in the districts are likely to be significantly lower. This
analysis did not account for the time lag (typically 5–7 years) between the initial planting and harvesting of rubber.
7. The extent of degradation will depend on the harvesting methods used; negative impacts could be lessened
through local training and capacity-building related to sustainable techniques.
8. All carbon stock values are sourced from Hoang et al. (2010) unless indicated.
9. See www.businesstimes.com.vn/domestic-cashew-prices-top-vnd30000kg; www.21food.com/news/detail36424.html.
10. Assumed to be the same as shifting cultivation.
11. JICA Vietnam (2011).
Cost implications for pro-poor REDD+ in Lam Dong Province, Vietnam: opportunity costs and benefit distribution systems
Figure 2. NPV by land type/use
8
The (high) NPV for rubber was omitted for clarity.
The use of the same NPV and carbon assumptions in both districts in turn gives the same costs per tonne of carbon
preserved for each land-cover transition. The total carbon emissions for each type will differ in the districts, however.
1.1.3 Checks on assumptions
In addition to the above changes, a check of several key factors in the estimation of the NPV
assumptions for the main land uses was conducted for this study.
Crop yields
A check of the annual yields (in kg/ha) for each crop in the SNV survey was conducted. They
were compared to national average yields for Vietnam, taken from the UN FAO FAOSTAT
database for 2008, 2009 and 2010.12 Given that the households targeted under the SNV REDD+
intervention are considered poor and the plots are mostly small farms, it would be expected
that yields in the SNV data would be somewhat below the national average, which includes
larger and more modern farms.
The check confirmed this expected result for cashews and coffee. For tea, however, the
analysis produced an anomalous result. While the yields in FAOSTAT ranged from approximately
1600kg/ha to 1750kg/ha over the three-year period, the average yield for tea in the SNV
dataset (2772kg/ha) was over 60 per cent higher. Of the 188 farms growing tea, 85 had yields
above the FAO maximum, while over 40 farms had yields more than double this value. Given
that small individual tea farms do not typically employ up-to-date production methods and
equipment, based on the FAO data it appears that the yields in the SNV dataset are likely too
high. This could be the result of the reported outputs being too high and/or the reported areas
farmed being too low, but would need a follow-up study to confirm this observation.
A check was also conducted on the NPV of shifting cultivation as this stood out as high,
especially relative to forest types (namely young forests). The comparison was done with figures
12. FAOSTAT, Food and Agriculture Organisation of the United Nations, Rome. See faostat.fao.org/default.aspx?lang=en.
REDD+ Country Reports
from JICA (2011) which estimated some of the costs and benefits of shifting cultivation practices
in Luong Minh and Yen Na communes, Nghe An Province. Here, the equivalent NPV was found
to range between US$245–640. This suggests that the US$400 NPV used for this analysis is well
within the range of other areas of Vietnam.
Crop prices
The prices used in the SNV analysis (in US$/kg) were checked as well. The FAOSTAT database
does not include price data for Vietnam, so national price information for coffee and cashews
was collected from public sources through Internet research. Reliable price information for tea
was not readily obtained.
n Coffee: Two 2011 sources gave domestic prices just under US$2.30, which compares
reasonably well with the SNV assumption of US$2.05.13 Prices obtained at the local level
would be expected to be somewhat lower than the national, so the lower SNV price provides
a further check.
n Cashews: Several 2011 sources gave prices in the $1.20 to $1.50 range.14 Cashew prices
increased markedly in 2010–2011 (nearly doubling from 2010 levels), in part due to shortages
of cashews. These prices are two to three times higher than the SNV assumption (US$0.50).
Based on the analysis of yields and prices, it was decided that two sensitivity scenarios would
be evaluated in addition to the base scenario. The first sensitivity reduced the tea yields for all
farms by 61 per cent, the ratio of 1700 (based on the FAO data) to the average yield (2772) of
all farms in the original survey. In the second sensitivity, the cashew price received by all farms
was doubled to US$1.00/kg.
9
NPV of forest types
The NPV of the different forest types were derived from Hoang et al. (2010). Checks against
other published sources were conducted, and found to be generally consistent with the trend
of the numbers used by SNV. In particular, Hansen and Top (2006) investigations into the
economic valuation of Cambodia’s natural forests illustrates how forested areas of higher carbon
sequestration potential had lower NPV associated with the NTFP coming from these areas. This
is consistent with the results shown in Table 1 for Vietnam.
A follow-up with the authors of Hoang et al. (2010) also confirmed that the reason for
providing higher NPV for poorer quality forests was due to the higher accessibility and use of
the resources in these forests, relative to higher quality forests. Here, it is assumed that areas
of higher quality forest are typically in areas which are difficult to access. Therefore, although
the potential value of the NTFPs from these forests is high, they are not realised because of
the difficulties associated with accessing the resources. Similarly, areas of poorer forest quality
are more likely to be within close proximity to villages, making them easier and less costly to
exploit. It should also be acknowledged, however, that less accessible forests will also be less
attractive to agriculture given that market access can be assumed to be lower in such areas. As
such, these areas of richer, less accessible forest will also likely have lower returns associated
with agriculture because of the higher costs associated with land conversions and marketing (i.e.
transport costs).
It is also acknowledged that studies in other areas of Vietnam suggest an alternative view.
JICA (2011), for example, suggests that for Binh Phuoc Province, the NTFP values of natural
13. See www.coffeemarketnews.com/2011/07/28/vietnam-coffee-domestic-prices-above-london-amid-thin-stocks;
www.ineximdaklak.com.vn/portal/content/view/180/31.
14. See www.businesstimes.com.vn/domestic-cashew-prices-top-vnd30000kg; www.21food.com/news/detail36424.html.
Cost implications for pro-poor REDD+ in Lam Dong Province, Vietnam: opportunity costs and benefit distribution systems
medium forests are significantly higher that the value of natural forest of poorer quality. These
figures, however, are calculated based on the operations of an agroforestry company, as opposed
to small-landowners. As such, issues like accessibility can be thought of as less of a problem
for larger-scale operators than for smallholders due to the availability of capital such as large
machinery and transport. For this reason, the method used in the analysis for poorer landowners
in Cat Tien and Bao Lam was considered more appropriate than assuming the same trend as for
larger operators.
Carbon sequestration
Carbon values used for this analysis were checked against estimates from JICA (2011). These
included a detailed assessment of changes in carbon stocks across different land types in three
communes across three different provinces. Although the ranges of carbon detailed in the study
varied depending on the geographic location, the carbon estimates used for Cat Tien and Bao
Lam were comparable with the ranges given across other provinces. Only coffee estimates from
the JICA study appeared significantly different, with ranges of between 18–23 carbon tonnes/ha.
Therefore, the coffee opportunity cost estimates for Cat Tien and Bao Lam should be considered
in view of this potentially inflated carbon value and may be higher than estimates in other areas
of Vietnam.
10
Young forests
The classification of young forests was used on the basis of the available land-use matrices
provided by NIAPP. Cross-checking this classification with Circular 35/2009/TT-BNNPTNT on criteria
for forest classification and identification, it is obvious that young forests are more a description of
the phase of a forest’s growth rather than a classification type. Values for the carbon stock were
again sourced from Hoang et al. (2010) which were calculated on the basis of fallow/regenerating
forest. However, it is acknowledged that, assuming such forests achieve maturity over the 30-year
time-horizon, the carbon value will be much higher. As such, the values for young forests are
likely to be an underestimate of the true carbon value potential. Therefore, the opportunity cost
estimates for young forests are likely to be overstated, since the true carbon value from such
areas of land will be higher than assumed here.
1.2 Limitations of opportunity cost analysis
The following analysis and other studies demonstrate that estimates of opportunity costs can
be an important tool to determine the viability of REDD+ and identify some of the key drivers
of deforestation and forest degradation. Implementers of REDD+ should nonetheless understand
that opportunity cost estimates have certain limitations. The results of any analysis should be
considered in view of these. Some key limitations include:
nBy themselves, opportunity costs will not provide a complete picture of the full impact of landuse changes on local and national incomes. This is because opportunity costs do not account
for variables such as changes in employment. Direct on-site opportunity costs also understate
the total opportunity costs, and do not account for changes in land-use activities, prices and
other factors from REDD+ that can impact the wider economy (World Bank Institute 2011).
nOpportunity costs can be an important input into land-use decision-making, but should
always be considered in light of political or other non-economic criteria (e.g. infrastructure
development). It will be especially important for LEDP managers to consider the full range of
possible drivers and motivations when a given forest or land area is under consideration for
multiple uses, some of which may be motivated by profit potential (where opportunity costs
can be of use) and others by political concerns.
REDD+ Country Reports
nOpportunity costs analysis can provide estimates of the up-front investment required for
agricultural and other development, as well as the potential minimum revenues needed as
incentives for REDD+ projects. However, the willingness of farmers and other landholders to
undertake investments and assume the risks will also depend in part on payback periods,
credit availability, levels of investor confidence and other factors. Experience to date has
shown that smallholders in developing countries tend to be risk-averse, and their ability to
access loans and credit is often limited. In many cases they will require up-front financial
assistance or risk guarantees to agree to undertake REDD+ and other low-emission activities,
a factor which will not be captured by basic opportunity cost analysis.
nOpportunity costs will need to be considered amongst a broader understanding of the socioeconomic conditions of the related areas. Used alone, opportunity costs may indeed identify
low-cost opportunities for REDD+ activities, but fail to realise the important context in which
the existing land uses play in terms of livelihood benefits such as food and fuel provision for
local people. Similarly, in many countries, local people have a strong cultural connection to
certain areas of land that are very difficult to factor into opportunity cost estimates. For the
purpose of identifying REDD+ opportunities that are indeed ‘pro-poor’, such considerations will
need to be well understood alongside of opportunity cost estimates.
nAs noted earlier, opportunity cost analysis will be more difficult to conduct in the case of
illegal activities. In addition, the extent to which LEDP managers are willing and able to
engage and work with illegal actors may make opportunity costs less useful in developing
policies to address such activities.15
nUsing opportunity costs to compensate landholders for revenues forgone can raise concerns
over equity. In the design of payments for ecosystem services (PES) programmes, opportunity
costs can be used to determine the minimum level of payment needed to provide an
effective incentive for REDD+ and other conservation actions. But setting payments based
directly on opportunity cost levels can lead to social conflicts and disputes when actors with
similar landholdings receive different payments. Partly for this reason, many PES schemes set
payment levels using a flat rate. LEDP managers using PES programmes may therefore need
to balance equity concerns with potential effectiveness.16
11
nAlthough not a limitation specific to opportunity cost analysis, care must be taken when using
opportunity costs in the context of different reference-level methodologies. REDD+ projects
use forward-looking emission baselines, in which it is assumed that all of the reductions in
emissions below this level would be available for crediting and sale (though some projects
deduct a portion of the credits to account for potential leakage). A future international REDD+
compliance market, however, would likely credit national reductions in emissions relative to
a historical reference level (with potential adjustments for specific national circumstances).
It remains very uncertain how existing or future individual REDD+ projects would function
after the start of a national REDD+ programme. It is foreseeable that some individual projects
would either elect or be required to use a historical emissions baseline for crediting. In such
cases, the application of opportunity cost analysis would need to account for the portion of
reductions that would not be eligible for sale, as well as for the presumably higher carbon
prices obtained.
15. For a discussion of potential approaches to addressing illegal activities in the context of payments for ecosystem
services (PES) programmes, see Ogonowski et al. (2009).
16. For a related discussion of setting PES payment levels, see Ogonowski et al. (2009), pp. 13–15.
Cost implications for pro-poor REDD+ in Lam Dong Province, Vietnam: opportunity costs and benefit distribution systems
1.3 Results
1.3.1 REDD+ forest and opportunity cost analysis
The key results of the analysis are discussed below. Note that many different types of land
conversion occur in the districts, not all of which involve forest areas. For example, the transition
matrices show that from 2000 to 2010 some land planted with coffee was converted to cashews
by 2010, and vice versa. This analysis focuses on two types of land-use changes:
nafforestation, reforestation and other activities leading to an increase in carbon stocks; and
nconverting natural forests to cash crops and other non-forest areas, the avoidance of which
could potentially be included as part of a REDD+ programme or project.
The latter is of most relevance to pro-poor REDD+, whereas the former is of interest to LEDP
more broadly.
Forest cover change and CO2 emissions
Both districts experienced a considerable loss in forest cover.17 In Bao Lam, the total area of
natural forest (medium, poor, conifer, mixed, bamboo and young) declined from 93.2 to 81.4
thousand ha in the 2000–2010 period, a loss of 13 per cent (see Table 2 below). Over four-fifths
of the total decline in forest area occurred from 2000–2005; deforestation slowed considerably
after 2005. Coffee was the major driver, with over 7.5 thousand ha planted on land that was
natural forest in 2000.
Table 2. Change in natural forest cover in Bao Lam District, 2000–2010
12
Type
2000 cover (ha)
2010 cover (ha)
Medium forest (80–150m /ha)
24,211
15,280
8931
37%
Poor forest (<80m3/ha)
18,813
16,607
2205
12%
Conifer forest
10,228
10,146
82
1%
Mixed forest
27,194
25,695
1499
6%
Bamboo forest
10,942
10,663
280
3%
1849
3033
(1184)
-64%
93,237
81,424
11,813
13%
3
Young forest
TOTAL
Net loss (ha)
Net loss (%)
As shown in Table 3, Cat Tien District’s natural forest area of 31.3 thousand ha declined over
the same time period by a smaller amount compared to Bao Lam (6.1 thousand ha). The
proportional decline was greater however – nearly one-fifth of the 2000 total. In contrast to Bao
Lam, most of the decline in forest area (80 per cent) occurred after 2005. The largest driver was
cashew cultivation, with 4.2 thousand ha planted on land that had been natural forest.
nIn Bao Lam, the loss of relatively high-carbon medium forest accounted for three-quarters
of the net decline in natural forest cover. These forests also suffered significant degradation:
nearly 4.1 thousand ha of medium forest became poor forest over the period, with an
estimated loss of 16 tonnes carbon per ha. In Cat Tien, bamboo forest experienced the largest
decline in area (nearly 60 per cent of the total), followed by mixed forest (17 per cent).
nThe most significant conversions of forested areas into crops came from the conversion
of conifer, bamboo and mixed forests. In Bao Lam, major drivers were the expansion of
coffee and tea plantations which accounted for roughly 7000ha and 2000ha of conversions
17. The forest cover change estimates in this section were calculated directly from the original data in the land-cover
transition matrices for each district. In addition to the natural forest area cleared, the values include changes that
occurred between forest types due to degradation and recovery, as well as conversion of crop and other non-forest
lands into forest.
REDD+ Country Reports
Table 3. Change in natural forest cover in Cat Tien District, 2000–2010
Type
2000 cover (ha)
2010 cover (ha)
Net loss (ha)
Net loss (%)
Medium forest (80–150m /ha)
3343
2636
707
21%
Poor forest (<80m /ha)
3719
3235
484
13%
0
0
NA
NA
Mixed forest
7984
6952
1032
13%
Bamboo forest
8313
4719
3594
43%
3
3
Conifer forest
Young forest
TOTAL
7908
7646
262
3%
31,267
25,188
6079
19%
respectively. In Cat Tien, cashews accounted for around 3000ha of conversions from mixed
and bamboo forests.
nThe CO2 emissions from clearance and degradation of the above six forest types over the
2000–2010 period totalled 5.3 million tonnes in Bao Lam and 2.1 million tonnes in Cat Tien.18
Opportunity cost analysis: enhancing forest carbon stocks and reducing deforestation and
forest degradation
Tables 4 and 5 show the results of the opportunity cost analysis. Table 4 includes the forest and
land transition options that lead to a net increase in carbon stocks (net sequestration options).
In electing to enhance the carbon stocks of forests or other undeveloped lands, a landholder
forgoes the revenues that could otherwise be obtained from agricultural or other development.
The opportunity costs in this analysis therefore represent the difference in net present value
between the NTFPs in the final forest, shrub or bare land, and an agricultural activity not
undertaken. This analysis used one low-NPV crop (rice) and one high-NPV crop (coffee) for each
net sequestration option; the opportunity cost estimate represents the ratio of the net change in
NPV to the net increase in carbon stocks.19 The results for rice and coffee are shown in each cell
in Table 5 (p.17) as the upper and lower values, respectively.
13
Table 4. Opportunity costs for Bao Lam and Cat Tien districts: enhancement of carbon
stocks in forests and undeveloped lands (US$/tonne CO2)
Original land-cover*
Alternative land-cover
Medium
forest
Poor
forest
Conifer
forest
Mixed
forest
Bamboo
forest
3.1
19.8
3.1
19.8
Young
forest
Poor forest (<80m3/ha)
15.3
69.6
Conifer forest
15.3
69.6
Mixed forest
15.3
69.6
Bamboo forest
15.3
69.6
Young forest
3.6
16.4
3.1
19.8
Shrub land
3.3
14.9
2.8
17.5
2.8
17.5
2.8
17.5
2.8
17.5
35.1
159
Bare land
2.4
10.8
1.9
11.9
1.9
11.9
1.9
11.9
1.9
11.9
7.0
31.8
Shrub
land
11.7
42.7
18. Calculated using the REDD Abacus model. Does not include carbon stock increases from sequestration.
19. More complete calculations would also factor in the costs of planting and other enhancement activities. However,
due to resource and data constraints, these were not included here.
Cost implications for pro-poor REDD+ in Lam Dong Province, Vietnam: opportunity costs and benefit distribution systems
The analysis demonstrates that a number of options for enhancing carbon stocks exist in
the districts, all of which would involve a net loss of NPV. Specific incentives to landholders
(e.g. carbon payments) or public investment would therefore be required to encourage their
implementation. For forests and lands likely to be converted to rice fields, the opportunity
costs range from less than US$2 per tonne of additional CO2 (carbon equivalent) sequestered
to as high as US$35. The net costs for enhancing carbon on areas intended for coffee are much
higher, ranging from a low of US$10.80 per tonne CO2 to a high of US$159. The high US$ value
results from the minimal increase in carbon stocks (7 tonnes per ha) that results from enhancing
shrub land to young forest. With the large decline in potential NPV achieving a very low level
of enhanced sequestration, this action yields a very high opportunity cost and will not be an
attractive option for REDD+. In general, however, the costs of afforestation of non-forest areas
(bare land and shrub land) are lower than for enrichment or recovery of existing forests.
In terms of carbon sequestration, afforestation of bare land would increase carbon stocks by over
100 tonnes per ha (for transition to medium forest) and 87 tonnes (for transitions to forest other
than young forest). Transitions from shrub land or young forest to medium forest would sequester
some 70 tonnes per ha, while transition to other forest types would sequester over 50 tonnes per
ha. A much lower level of sequestration (16 tonnes per ha) would be achieved by enhancing poor,
conifer, mixed or bamboo forest to medium forest. However, sequestration gains would also be
made in terms of the avoided deforestation that would occur under such enhancement activities.
The size of the emissions reductions would roughly correspond to the sequestration potentials
for each forest type that are shown in Table 1. Although not factored into the calculations shown
previously, this would slightly reduce the size of the opportunity cost of the conversions.
14
Enhancing forest carbon stocks to reverse degradation and preserve natural forest ecosystems
will therefore be more expensive than afforestation of non-forest areas. On the other hand,
reforestation and/or enrichment planting on bare land, shrub land and young forest intended
for conversion to rice fields or other low-NPV crops will cost less than US$5 per tonne CO2,
approximately the current carbon price on the voluntary market. If implemented as part of a
REDD+ project, such options could therefore help to boost rural incomes and rehabilitate forests.
Table 5 (p.17) displays the results for land-use transitions that produce an increase in carbon
emissions and are therefore potential targets of REDD+ projects. Where there is an increase in the
NPV from the original land use to the alternative, the opportunity cost of avoiding this transition
will be positive – i.e. compensation would need to be given to avoid the land-use transition.
Conversely, if the land-use transition results in a loss of NPV, the opportunity cost will be negative.
Under normal market conditions where all exchanges of goods involve payments and the prices
of goods are known, transitions that reduce NPV of land would not be expected to occur. The
opportunity costs of restricting land-use transitions from sustainable forest management to
unsustainable forest management or from forest cover to agriculture are usually positive.
Several factors likely account for the opportunity costs obtained here. First, as already noted,
the benefits from extracting timber in year one are not included in the cost calculations. These
benefits can include revenues from the sale of timber, or direct use of harvested wood for fuel
or construction materials, which can offset other expenses that would have been incurred. The
section below indicates that these benefits are substantial. Second, NTFPs are often used directly
rather than sold and landholders may not be aware of their relative market value, a factor that
may be of particular importance in cases involving transitions between forest types or from forest
to shrub or bare land. In the case of shifting cultivation, another factor that may contribute to
the negative result is the relatively small magnitude of the NPV (US$400). As suggested earlier,
this value was checked against similar figures for communes in Nghe An Province and found to
REDD+ Country Reports
be within the range of NPV for shifting cultivation there. In the JICA (2011) study, the value of shifting
cultivation was found in some cases to be less than that of forested areas, suggesting the value of NTFPs
and the potential sale of carbon credits for certain forested areas was more profitable than conversions
into agriculture. This result is consistent with what is demonstrated here for Cat Tien and Bao Lam.
However, additional research into the practices, uses and market transactions related to timber and NTFP
harvesting would be needed to provide more definitive results.
The opportunity cost results for key REDD+ options include:
nShifting cultivation is the only agricultural option with an NPV so low that the opportunity costs of
avoiding conversion of poor, conifer, mixed or bamboo forest to this type of agriculture would be
negative. This indicates that such conversions are not profitable, though the caveats noted above
regarding harvested timber and the relative value of shifting cultivation over time suggest that
they may in fact produce a net benefit overall. This result is nonetheless interesting in the context
of land-use planning and LEDP given that investing in alternative land uses to shifting cultivation
may not only be more profitable for the farmers involved, but also less emissions-intensive. The
opportunity costs for avoiding the conversion of medium or young forest to shifting cultivation are
positive but very low (less than US$1 per tonne). With such slim profit margins, these conversions
may not be profitable after accounting for implementation (e.g. labour for land clearing and
soil preparation) or other costs. However, converting shrub land would be profitable, with an
opportunity cost of nearly US$4 per tonne.
nRubber has the highest opportunity costs in the districts. The opportunity costs for rubber range
from US$95 per tonne CO2 avoided from conversion of poor, mixed or bamboo forest to US$302 for
conversion of shrub land.
15
nFor most natural forest types (medium, poor, conifer, mixed and bamboo), opportunity costs from
conversion to crops (other than rubber), forest plantations or settlements/infrastructure are less than
US$12 per tonne CO2, with a low of US$1.90 for conversion to rice or other annual crops.
nWith the exception of young forest, opportunity costs for conversion of natural forests to rice, other
annual crops, plantations, cashews, tea, settlements/infrastructure or water bodies are all below US$5
per tonne CO2, the current average carbon price on the voluntary REDD+ market (this is discussed in
more detail in the next section). Coffee has higher opportunity costs in the US$11–12 range.
nConversion of young forest has higher opportunity costs for each category, ranging from US$7 per
tonne CO2 for conversion to other annual crops to US$32 for coffee and US$239 for rubber. The
opportunity costs from conversion of shrub land are higher still.
nThe analysis also identified losses resulting from degradation of natural forest areas over the 2000–
2010 period. Degradation of medium forest (which primarily changed to poor and mixed forest) in the
districts is associated with an increase in NPV and a reduction in carbon stocks. Avoiding degradation
of medium forest therefore has a positive opportunity cost of US$5.10 per tonne of CO2. Degradation
and conversion of other forest types to shrub land or bare land result in a loss of both economic value
and carbon. This was likely due to unsustainable harvesting of fuel wood (and possibly NTFPs as well).
If this trend continues, both fuel wood and NTFPs will likely become less available and their collection
more difficult and expensive going forward.
nTable 5 (p.17) displays the results of the analysis. The abatement cost curves for the two provinces
generated with the REDD Abacus model are shown in Figures 3 and 4 (see p.18).20
20. In Figures 3 and 4, both include all transitions from natural forest, bare land and shrub land to agriculture,
settlements and water bodies. They also include positive cost transitions (degradation) of medium forest. They do not
include transitions between other forest types, bare land and shrub land.
Cost implications for pro-poor REDD+ in Lam Dong Province, Vietnam: opportunity costs and benefit distribution systems
The two crop sensitivity scenarios were evaluated next. In Scenario 1, the 30-year NPV for tea
falls from US$1950 to US$1200 per ha, a decrease of nearly 40 per cent. The opportunity cost for
conversion of natural forests falls by a larger proportion. Opportunity costs for the conversion of
forest types other than young forest decrease from over US$4 per tonne CO2 to between US$1.90
and US$2.40 per tonne. For the conversion of young forest to tea, the opportunity cost falls from
US$13 to US$7 per tonne.
In Scenario 2, increasing the cashew price by 100 per cent throughout the 30-year period more
than doubles the NPV, which rises from US$1753 to US$3836 per ha. The opportunity cost for
conversion of most forest types increases significantly, from less than US$4 per tonne to US$9–
US$10 per tonne CO2 – close to the opportunity cost for coffee. Converting young forest rises from
US$11 to US$28 per tonne.
Effect of including carbon sequestration potential of different crops
For the reasons outlined earlier, the opportunity cost estimates conducted in this analysis did
not include the carbon sequestration values of the different crops in the study sites. However,
a brief analysis was added to explore the effect of adding in default values for the carbon
sequestration potential of these crops. Results are shown in green brackets in Table 5, alongside
the corresponding carbon values used shown in Table 1.
16
Predictably, the impact of including the carbon sequestration values of crops was to increase the
opportunity cost of the different land-use scenarios. By accounting for the carbon sequestration
potential of crops, the net carbon loss from the land-use transitions is smaller. This means that
the opportunity cost becomes relatively more dependent on the effect of the NPV. This is most
apparent in the case of high value crops such as coffee, which also have a relatively large carbon
sequestration potential. Here, opportunity costs increased well beyond the US$10/tonne price and
upwards of US$28/tonne.
Although the opportunity costs of conversions into forestry plantations, cashews and tea increased,
they remained less than US$4/tonne, US$8.50/tonne and US$7.80/tonne respectively. This suggests
they would still be viable options under current expectations for future international carbon prices. For
the case of young forest conversions to plantations, however, the very marginal difference between
the carbon sequestration potential between the two land uses meant that the opportunity cost was
heavily influenced by the much higher NPV generated by plantations. This caused the opportunity
cost of this land use to increase significantly, well beyond US$100/tonne. Rubber also experienced
a significant increase, suggesting that REDD+ will be largely uncompetitive with rubber plantations
regardless of whether the carbon sequestration potential of the plantation is factored in or not.
Some results for young forests and shrub land are not shown under Table 5 using the new
assumptions around the different carbon sequestration of crops. These results relate to land-use
transitions where there is a significant increase in the carbon sequestration potential. As both the
NPV and carbon sequestration rate under the alternative land use were higher than the existing
land use, very large negative opportunity costs were produced by the model. This highlights
a key problem associated with the assumptions around young forests, in so far as the carbon
sequestration rate does not change over time as it matures. As such, this overstates the actual
divergence in sequestration rates which would be expected to decline as the young forest moves
into a higher classification of forest. Subsequently, this exaggerates the size of the opportunity
cost. For shrub lands, these results also indicate methodology challenges when dealing with
a very low carbon existing land use. With the inclusion of the carbon values of crops, it would
appear not to make sense either in terms of carbon or agricultural income to retain the existing
land use. However, the large extent to which this occurs here suggests the estimated values for
carbon and NPV for shrub land needs revisiting. This could be the subject of further research.
REDD+ Country Reports
NA
NA
NA
NA
NA
NA
NA
Poor forest
Conifer forest
Mixed forest
Bamboo forest
Young forest
Shrub land
Bare land
NA
NA
NA
0.0
0.0
0.0
NA
5.1
NA
NA
0.0
0.0
NA
0.0
5.1
NA
NA
NA
0.0
NA
0.0
0.0
5.1
NA
NA
NA
NA
0.0
0.0
0.0
5.1
Conifer Mixed Bamboo
forest forest forest
NA
NA
NA
-1.6
-1.6
NA
-1.6
0.0
NA
NA
-11.7
-2.8
-2.8
-2.8
-2.8
-1.1
Young Shrub
forest land
NA
0.0
(0.0)
-2.3
(-2.6)
-1.9
(1.97)
-1.9
(1.97)
-1.9
(-1.97)
-1.9
-1.97
-0.8
(0.83)
NA
3.9 (8.4)
0.8 (1.4)
-0.6
(-0.7)
-0.6
(-0.7)
-0.6
(-0.7)
-0.6
(-0.7)
0.3
(0.31)
1.9
(2)
1.9 (2)
1.9 (2)
1.9 (2)
7.0
(8.2)
11.7
(14.2)
NA
NA
1.9 (2)
1.9 (2)
7.0
(8.2)
11.7
(14.2)
NA
2.4
(2.5)
Other
annual
crops
1.9
(2)
Rice
field
Alternative land type/use
Bare land Shifting
cultivation
NA
12.7
7.8 (136)
2.2 (3.5)
2.2 (3.5)
2.2 (3.5)
2.2
(3.5)
2.6 (3.9)
NA
17.1
11.3
3.6
(8.5)
3.6
(8.5)
NA
3.6
(8.5)
3.8
(7.5)
NA
19.0
(41)
12.9
(22.5)
4.2
(7.8)
4.2
(7.8)
4.2
(7.8)
4.2
(7.8)
4.4
(7.1)
Forest
Cashews Tea
plantations
NA
42.7
31.8
11.9
(27.9)
11.9
(27.9)
11.9
(27.9)
11.9
(27.9)
10.8
(21)
Coffee
NA
301.9
239.2
95.3
(224)
95.3
(224)
NA
95.3
(224)
NA
NA
19.5
13.2
4.4
4.4
4.4
4.4
4.5
NA
19.5
13.2
4.4
4.4
4.4
4.4
4.5
Rubber Built-up Water
area
body
The table includes values for land-use transitions that result in either a net decrease in carbon stocks (potential REDD+ options) or no-change projects (transitions between some forest types). Positive
values show the gain in profitability with the conversion to the final land use per tonne of CO 2 emissions. This indicates that a minimum level of compensation would be needed to prevent this land
conversion taking place. Negative values show that the land-use transition resulted in a loss of NPV. Blank cells indicate no transition took place in either district during the 2000–2010 period (see
Annex 2). This analysis aims to relate the opportunity costs to the actual situation observed on the ground, so potential transitions that have not yet been observed were not included. Figures in
brackets show unit costs if carbon stocks in alternative land uses are included.
NA
Medium Poor
forest
orest
Medium forest
Current landcover
Table 5. Opportunity costs for Bao Lam and Cat Tien districts: conversion of forests and undeveloped lands (US$/tonne CO2)
17
Cost implications for pro-poor REDD+ in Lam Dong Province, Vietnam: opportunity costs and benefit distribution systems
Figure 3. Bao Lam abatement cost curve (excluding carbon sequestration values of crops)
18
Figure 4. Cat Tien abatement cost curve (excluding carbon sequestration values of crops)
In addition to the land-use transitions evaluated above, opportunity costs for another set
of potential options for enhancing carbon stocks were analysed. These options involve
discontinuing existing activities on developed lands and converting the land back into forests
to sequester carbon. Table 6 displays the opportunity costs for transitions that took place in the
two districts between 2000 and 2010.
REDD+ Country Reports
All results under Table 6 excluding those for shifting cultivation suggest a net loss in profitability
from the existing land use to the alternative. However, the size of the loss, and the size of the
opportunity cost, varies considerably. Almost all of the options for reforestation are below the
US$5/tonne threshold. For coffee, the opportunity costs are higher due to the larger value of
coffee relative to other crops, especially rice. For conversions into young forests, the opportunity
costs are much higher due to the smaller sequestration rate of younger forests.
However, it is likely best to consider the results of medium forests and young forests as being
indicative of the range of opportunity costs that will prevail over the course of the reforestation
effort. For example, transitions from a tea plantation into a medium forest stand will take time in
which the forest will transform from a young forest into a more mature, high-quality forest type.
Therefore, the opportunity cost will likely change over time. Also, it is important to note these
figures do not include the costs associated with reforestation efforts, such as planting, pest control
and seedlings. As such, these estimates are more likely to represent a lower-bound of the actual
opportunity costs for reforestation efforts.
Table 6. Opportunity cost results for Bao Lam and Cat Tien districts: carbon sequestration
options on developed lands ( US$/tonne CO2)*
Current land use/
activity
Alternative land type
Medium
forest
Poor forest
Shifting cultivation
Mixed forest
-0.6
Rice field
Other annual crops
Conifer forest
1.9
2.4
Plantation forest
Cashews
3.9
Tea
4.4
Coffee
Bamboo
forest
Young forest
-0.6
0.8
1.9
1.9
7.0
1.9
1.9
1.9
1.9
7.0
2.2
2.2
2.2
2.2
0.8
3.6
3.6
11.3
3.6
4.2
4.2
4.2
4.2
12.9
11.9
11.9
11.9
11.9
31.8
Built-up area
4.5
4.4
4.4
4.4
4.4
13.2
Water body
4.5
4.4
4.4
4.4
4.4
13.2
19
*Excludes land-use transitions that did not take place between 2000 and 2010
In addition, some of the transitions identified will likely be impractical to undertake. This can be
due to their very high profit margins (e.g. rubber plantations), the cost and difficulty involved in
converting some developed lands to forests (e.g. roads, settlements and other built-up areas),
or the potential for adverse environmental impacts (e.g. conversion of wetlands or reservoirs).
Decisions to undertake conversions of agricultural and other developed lands may also be
based in part on non-economic criteria. Finally, it is important to keep in mind that the specific
activities that would qualify as eligible enhancement of carbon stock actions under the United
Nations Framework Convention on Climate Change (UNFCCC) REDD+ provisions and the associated
requirements have not yet been elaborated. The transitions in Table 6 should therefore be thought
of as ‘second tier’ REDD+ and LEDP options.
Despite these limitations, some useful conclusions can be drawn. Converting shifting cultivation
to forest would likely be only marginally unprofitable, and in the case of conversion to conifer
or bamboo forest could even lead to a net economic gain depending on the implementation
cost. Also noteworthy is the fact that for the land-use transitions identified, converting the
first six agricultural options in Table 6 to medium, poor, conifer, mixed or bamboo forest
would sequester carbon at less than US$5 per tonne. The costs for converting coffee lands to
forest would be higher, as would converting most crops to young forest. These would be less
promising as sequestration options.
Cost implications for pro-poor REDD+ in Lam Dong Province, Vietnam: opportunity costs and benefit distribution systems