Accounting principles 9e by kieso kimmel continuing waterways solutions
Bạn đang xem bản rút gọn của tài liệu. Xem và tải ngay bản đầy đủ của tài liệu tại đây (710.43 KB, 22 trang )
SOLUTION
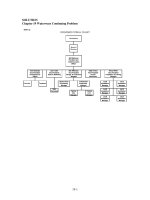
Chapter 19 Waterways Continuing Problem
19-1
(b)
Waterways Corporation
Cost of Goods Manufactured Schedule
For the Month of November
Work in process 11/1
Direct materials
Raw materials inventory 11/1
$ 52,900
$ 38,000
Raw material purchases
Total raw materials available for use
Less: Raw materials inventory 11/30
Direct materials used
Direct labor
Manufacturing overhead
Depreciation--factory equipment
Factory supplies used
Factory utilities
Indirect labor
Rent--factory equipment
Repairs--factory equipment
185,400
223,400
52,700
$170,700
22,000
16,800
16,850
10,200
48,000
47,000
4,200
Total factory overhead
143,050
Total manufacturing costs
Total cost of work in process
335,750
388,650
Less: Work in process 11/30
Cost of goods manufactured
42,000
$346,650
19-2
Waterways Corporation
Income Statement
For the Month of November
Sales
Cost of goods sold
Finished goods inventory 11/1
$1,350,000
$ 72,550
Cost of goods manufactured
Cost of goods available for sale
346,650
419,200
Less: Finished goods inventory 11/30
68,300
Cost of goods sold
Gross profit
Operating expenses
Selling expenses
Advertising expenses
350,900
999,100
54,000
Sales commissions
Total selling expenses
Administrative expenses
Depreciation--office equipment
Office supplies expense
Other administrative expenses
40,500
94,500
$
Salaries
2,500
1,400
72,000
325,000
Total administrative expenses
400,900
Total operating expenses
Net income
$
19-3
495,400
503,700
Waterways Corporation
Balance Sheet (partial)
November 30
Current assets
Cash
Accounts receivable
Inventories
Raw materials inventory
Work in process inventory
Finished goods inventory
Prepaid expenses
Total current assets
$260,000
295,000
$52,700
42,000
68,300
163,000
41,250
$759,250
19-4
SOLUTION
Chapter 21 Waterways Continuing Problem
WCP21
(a) Production Report -- Weighted-Average Method
Waterways Corporation
Molding Department Production Report
For the month of January
Equivalent Units
Physical
Units
Materials Conversion
Quantities
Units to be accounted for:
Work in process, Jan 1 (80% materials, 30% conversion)
24,000
Started into production
60,000
Total units
84,000
Units accounted for:
Transferred out
58,000
58,000
58,000
Work in process, Jan 31 (50% materials, 10% conversion)
26,000
13,000
2,600
84,000
71,000
60,600
Materials
Conversion
Costs
Total units
Costs
Unit costs
Costs in January*
(a)
Equivalent units
Unit costs [(a) / )b)]
Costs to be accounted for
Work in process, January 1
Started into production
Total costs
*Additional computations to support production costs report data:
Materials cost - $168,360 + $265,450
Conversion costs - $67,564 + $16,892 + $289,468 + $60,578
(b)
$433,810 $434,502
71,000
$6.11
60,600
$7.17
Total
$868,312
$13.28
$252,816
615,496
$868,312
Cost Reconciliation Schedule
Costs accounted for
Transferred out (58,000 X $13.28)
$770,240
Work in process, Jan 31
Materials (13,000 x $6.11)
79,430
Conversion (2,600 x $7.17)
18,642
Total costs
98,072
$868,312
21-1
*(b) Equivalent Units -- FIFO Method
Equivalent Units
Units accounted for
Completed and transferred out
Work in process, January 1 (20% materials, 70% conversion)
Started and completed in January
Work in process, Jan 31 (50% materials, 10% conversion)
Total units
21-2
Physical
Units
Materials
Conversion
24,000
34,000
26,000
84,000
4,800
34,000
13,000
51,800
16,800
34,000
2,600
53,400
SOLUTION
Chapter 22 Waterways Continuing Problem
WCP22 (Note: All figures are rounded.)
(a)
(1) The contribution margin ratio is 30% ($883,920 $2,937,120):
Waterways Corporation
Contribution Margin Income Statement for Water Control and Timer
For the Year
Unit Cost
Sales (696,000 units)
$2,937,120
$4.22
100%
2,053,200
2.95
70%
Contribution margin
883,920
1.27
30%
Fixed Expenses
683,338
Variable expenses
Net income from product
$ 200,582
(2) Break-even point in units = 538,061 units
Fixed expenses
Unit CM
$683,338
$1.27
= 538,061 units (rounded)
Break-even point in dollars = $2,277,793
Fixed expenses
CM ratio
$683,338
.30
= $2,277,793 (rounded)
(3) Margin of safety in dollars = $659,327
Sales
Less: Break-even in dollars
$2,937,120
2,277,793
$ 659,327
Margin of safety ratio = 22.45%
Margin of safety in dollars
Sales
$659,327
$2,937,120
22-1
= 22.45%
(4) Waterways would have to sell an additional 15,794 units.
10% increase in income =
Current income
Total projected income
Fixed expense
Total CM
711,794 units
696,000 units
15,794 additional units
$ 20,058.20
+200,582.00
220,640.20
+683,338.00
$903,978.20
$903,978.20
$1.27
= 711,794 units
(5) Income will increase by $90,284 ($290,866 – $200,582):
Waterways Corporation
Contribution Margin Income Statement for Water Control and Timer
Unit Cost
Sales (767,090 units)
$3,237,119.80
$4.22
100%
2,262,915.50
2.95
70%
Contribution margin
974,204.30
1.27
30%
Fixed expenses
683,338.00
Variable expenses
Net income from product
(b)
$ 290,866.30
(1) If the average sales price per unit increased, the contribution margin ratio would drop by 2%
(from 27% to 25%). Net income, however, would increase by $101,650 ($762,806 − $661,156).
We would give strong consideration to mass-producing the sprinklers. An increase in variable
costs is less risky than an increase in fixed and such a decision can be reversed if it does not
result in the projected increase in sales.
Waterways Corporation Sprinkler Units (current sales)
Avg per unit
Sales (491,740)
Variable expenses: Manufacturing
$13,031,110
$ 26.50
100%
9,524,864
19.37
73%
7.13
27%
$6,863,512
Variable expenses: Selling and administrative
2,661,352
Contribution margin
Fixed expenses: Manufacturing
3,506,246
$2,050,140
Fixed expenses: Selling and administrative
794,950
Net income from sprinkler units
2,845,090
$
22-2
661,156
$
Waterways Corporation Sprinkler Units (increase price)
Avg per unit
Sales (540,914)
Variable expenses
$14,469,449.50 $
10,861,553.12
Contribution margin
3,607,896.38 $
Fixed expenses
2,845,090.00
Net income from sprinkler units $
26.75 100%
20.08
75%
6.67
25%
762,806.38
(2) If the average sales price did not increase, the contribution margin ratio would drop 3% (from
27% to 24%). Profit would decrease by $33,578 ($661,156 − $627,578). This definitely would
not be in the best interest of the company.
Waterways Corporation Sprinkler Units (no price change)
Avg per unit
Sales (540,914)
$
Variable expenses
14,334,221 $
26.50 100%
10,861,553
20.08 26%
Contribution margin
3,472,668 $
Fixed expenses
2,845,090
Net income from sprinkler units $
22-3
627,578
6.42 24%
SOLUTION
Chapter 23 Waterways Continuing Problem
WCP23
(a)
Sales budget
Waterways Corporation
Sales Budget
For the first quarter of 2011
Expected unit sales
Unit selling price
Total sales
(b)
January
113,333
$
12.00
$ 1,359,996
First Quarter
February
112,500
$
12.00
$ 1,350,000
March
116,667
Quarter
342,500
$
12.00
$ 1,400,004
$
12.00
$ 4,110,000
Production budget
Waterways Corporation
Production Budget
For the first quarter of 2011
First Quarter
January
February
Expected unit sales
113,333
112,500
Add: Desired ending finished goods units
11,250
11,667
Total required units
124,583
124,167
Less: Beginning finished goods units
11,333**
11,250
Required production units
113,250
112,917
* 12,500 is 10% of April’s budgeted sales units
** 11,333 is 10% of January’s sales units
23-1
March
116,667
12,500*
129,167
11,667
117,500
Quarter
342,500
12,500
355,000
11,333
343,667
(c)
Direct materials budget
Waterways Corporation
Direct Materials Budget
For the first quarter of 2011
First Quarter
Units to be produced (from part b)
January
February
March
Quarter
113,250
112,917
117,500
343,667
2
2
2
2
226,500
225,834
235,000
687,334
11,292
11,750
237,792
237,584
247,625
699,959
11,292
11,750
10,355
235,875
689,604
Direct materials per unit
Total pounds needed for production
Add: Desired ending direct materials (lbs)
Total materials required
Less: Beginning direct materials (lbs)
10,355**
Direct materials purchases
227,439
Cost per pound
$
Total cost of direct materials purchases
$170,578
12,625*
226,292
0.75
$
0.75
$
$ 169,719
12,625
0.75
0.75
$176,906
$517,203
* 12,625 is 5% of April’s budgeted materials need (125,000 units + 10% of May’s sales units (137,500) less
March’s ending unit inventory (12,500) 2 lbs 5%) = (125,000 + (.10 137,500) − 12,500) 2 .05
** Actual inventory
(d)
Direct labor budget
Waterways Corporation
Direct Labor Budget
For the first quarter of 2011
First
Quarter
January
Units to be produced (from part b)
113,250
Direct labor time (hours per unit)
February
112,917
0.2
Total required direct labor-hours
$
8.00
Total direct labor cost
$181,200
23-2
117,500
0.2
22,650
Direct labor cost per hour
March
8.00
$180,664
343.667
0.2
22,583
$
Quarter
0.2
23,500
$
8.00
$188,000
68,733
$
8.00
$549,864
(e)
Manufacturing overhead budget
Waterways Corporation
Manufacturing Overhead Budget
For the first quarter of 2011
First Quarter
January
February
March
Quarter
$ 6,795
$ 6,775
$ 7,050
$ 20,620
Indirect labor (50¢ per hour)
11,325
11,292
11,750
34,367
Utilities (45¢ per hour)
10,193
10,162
10,575
30,930
5,663
5,646
5,875
17,183
$ 33,976
$ 33,875
$ 35,250
$103,100
Salaries
42,000
42,000
42,000
126,000
Depreciation
16,800
16,800
16,800
50,400
Property taxes
2,500
2,500
2,500
7,500
Insurance
1,200
1,200
1,200
3,600
Maintenance
1,300
1,300
1,300
3,900
Fixed manufacturing overhead
$ 63,800
$ 63,800
$ 63,800
$191,400
Total manufacturing overhead
$ 97,776
$ 97,675
$ 99,050
$294,500
Variable costs
Indirect materials (30¢ per hour)
Maintenance (25¢ per hour)
Total variable costs
Fixed costs
Total manufacturing overhead
$294,500
Direct labor hours (from part d)
22,650
22,583
23,500
Predetermined overhead rate for the quarter $294,500 68,733 hours =
(f)
68,733
$4.28
Selling and administrative expense budget
Waterways Corporation
Selling and Administrative Expense Budget
For the first quarter of 2011
First Quarter
January
February
March
Budget sales in units (from part a)
113,333
112,500
116,667
Quarter
342,500
Variable expenses per unit
Total variable S & A expense
Fixed expenses:
Advertising
Insurance
Salaries
Depreciation
$
1.62
$ 183,599
$
1.62 $
1.62 $
1.62
$ 182,250
$ 189,001
$ 554,850
$ 15,000
1,400
72,000
2,500
$ 15,000
1,400
72,000
2,500
$ 15,000
1,400
72,000
2,500
$ 45,000
4,200
216,000
7,500
Other
Total fixed expenses
Total S & A expenses
3,000
$ 93,900
$ 277,499
3,000
$ 93,900
$ 276,150
3,000
$ 93,900
$ 282,901
9,000
$ 281,700
$ 836,550
23-3
(g)
Collections from customers
Schedule of Expected Collections from Customers
Accounts receivable, 12/31/10
January ($1,359,996)
February ($1,350,000)
March ($1,400,000)
Total cash collections
$
January
183,750
1,155,997*
February
$
$ 1,339,747
203,999
1,147,500
$ 1,351,499
Quarter
March
$
202,500
1,190,003
$ 1,392,503
$1,359,996
$1,350,000
$1,400,000
$4,083,749
* 85% of sales collected in month of sale (.85 $1,359,996)
15% of sales collected in month after sale (.15 $1,359,996)
(h)
Payments for direct materials
Schedule of Expected Payments for Direct Materials
January
Accounts payable, 12/31/10 $ 120,595.00
January ($170,578)
85,289.00
February ($169,719)
March ($176,906)
Total payments
$ 205,884
February
$
85,289.00
84,859.50 $ 84,859.50
Quarter
$ 120,595.00
170,578.00
169,719.00
88,453.00
$ 173,313
88,453.00
$ 549,346
$ 170,149
March
* Purchase payments 50% in month of purchase and 50% in month after purchase
23-4
(i)
Cash budget
Waterways Corporation
Cash Budget
For the first quarter of 2011
First Quarter
January February
March
$ 100,500 $ 800,688 $ 817,576
Quarter
$ 100,500
1,339,747 1,351,499
1,440,247 2,152,187
1,392,503
2,210,079
4,083,749
4,184,249
170,149
180,667
80,875
273,650
500,000
173,313
188,000
82,250
280,401
549,346
549,864
244,100
829,050
500,000
Dividends
12,500
12,500
Total disbursements
755,559 1,217,838
Excess (deficiency) of available cash over cash disbursements 684,688
934,349
Financing:
Borrowings
116,000
Repayments
116,000
12,500
736,464
1,473,615
37,500
2,709,860
1,474,389
Beginning cash balance
Add: Receipts
Collections from customers
Total available cash
Less: Disbursements
Direct materials
Direct labor
Manufacturing overhead*
Selling and administrative*
Equipment purchase
205,884
181,200
80,976
274,999
Interest
773
Ending cash balance
$ 800,688 $ 817,576
* Adjusted for depreciation
*Manufacturing Overhead ($97,776 - $16,800 = $80,976)
*Selling & Admin ($277,499 – 2500 = $274,999)
23-5
116,000
116,000
773
$1,473,615 $1,473,615
SOLUTION
Chapter 24 Waterways Continuing Problem
WCP 24
(a)
Waterways Corporation
Manufacturing Overhead Flexible Budget
For the Month of March
Production in units
Variable costs
Indirect materials($.06/unit a)
Indirect labor ($.10/unit b)
Utilities ($.09/unit c)
115,500
116,500
117,500
118,500
119,500
6,930
11,550
10,395
$ 6,990
11,650
10,485
$ 7,050
11,750
10,575
$ 7,110
11,850
10,665
$ 7,170
11,950
10,755
5,775
5,825
5,875
5,925
5,975
34,650
34,950
35,250
35,550
35,850
42,000
16,800
2,500
1,200
42,000
16,800
2,500
1,200
42,000
16,800
2,500
1,200
42,000
16,800
2,500
1,200
42,000
16,800
2,500
1,200
1,300
1,300
1,300
1,300
1,300
63,800
$ 98,450
63,800
$ 98,750
63,800
$ 99,050
63,800
$99,350
63,800
$ 99,650
$
Maintenance ($.05/unit d)
Total Variable Costs
Fixed Costs
Salaries
Depreciation
Property taxes
Insurance
Janitorial
Total Fixed Costs
Total budgeted costs
Unit costs are based on the static budget costs.
a. $7,050 / 117,500 units = $0.06 / unit
b. $11,750 / 117,500 units = $0.10 / unit
c. $10,575 / 117,500 units = $0.09 / unit
d. $5,875 / 117,500 units = $0.05 / unit
(b)
Waterways Corporation
Manufacturing Overhead Flexible Budget Report
For the Month of March
Production in units
Variable costs
Indirect materials
Indirect labor
Utilities
Maintenance
Total Variable Costs
Fixed Costs
Salaries
Depreciation
Property taxes
Budget
118,500
$
7,110
11,850
10,665
5,925
35,550
42,000
16,800
2,500
24-1
Actual
118,500
$
7,100
11,825
10,700
5,900
35,525
42,000
16,800
2,500
Difference
Favorable
Unfavorable
$
10 F
25 F
35 U
25 F
25 F
0
0
0
Insurance
Janitorial
Total Fixed Costs
Total budgeted costs
1,200
1,300
63,800
$ 99,350
24-2
1,200
1,300
63,800
$ 99,325
$
0
0
0
25 F
(c)
Waterways Corporation
Responsibility Report
Manufacturing Overhead
For the Month of March
Controllable Cost
Indirect materials
Indirect labor
Utilities
Budget
$ 7,110
11,850
10,665
Actual
$ 7,100
11,825
10,700
Maintenance
5,925
$ 35,550
5,900
$ 35,525
24-3
Difference
Favorable
Unfavorable
$
10 F
$
25 F
$
35 U
$
$
25 F
25 F
SOLUTION
Chapter 25 Waterways Continuing Problem
WCP25
(a)
Materials Price Variance
Actual Quantity less Actual Quantity
x Actual Price
x Standard Price
229,000 lbs
x
$0.74
=
$169,460
less
229,000 lbs
x
$0.75*
=
$171,750
= $2,290 F
* Standard price per pound :
Material
Metal
Plastic
Rubber
Total
(b)
Lbs per unit
1.00
.75
.25
2.00 lbs
X
X
X
X
Price per lb.
$0.58
0.96
0.80
= $0.58
= 0.72
= 0.20
$1.50 = $0.75/lb.
Materials Quantity Variance
Actual Quantity
less Standard Quantity
x Standard Price
x Standard Price
229,000 lbs
x
$0.75
=
$171,750
231,000*
x
$0.75
=
$173,250
less
= $1,500 F
* 115,500 units x 2 lbs = 231,000
(c)
Total Materials Variance
Actual Quantity less Standard Quantity
x Actual Price
x Standard Price
229,000 lbs
x
$0.74
=
$169,460
less
231,000*
x
$0.75
=
$173,250
* 115,500 units x 2 lbs = 231,000
25-1
= $3,790 F
(d)
Labor Price Variance
Actual Hours less
Actual Hours
x Actual Rate
x Standard Rate
28,875 hrs*
x
$7.75
=
$223,781
less
28,875 hours
x
$8.00
=
$231,000
= $7,219 F
* 115,500 units x .25 hrs = 28,875 hrs
(e)
Actual Hours
x Standard Rate
28,875 hours
x
$8.00
=
$231,000
Labor Quantity Variance
Standard Hours
less
x Standard Rate
less
23,100*
x
$8.00
=
$184,800
= $46,200 U
* 115,500 units x .20 hrs(12min./60min. per hour) = 23,100 hrs
(f)
Total Labor Variance
Actual Hours Less Standard Hours
x Actual Rate
x Standard Rate
28,875 hrs
x
$7.75
=
$223,781
less
23,100*
x
$8.00
=
$184,800
= $38,981 U
(g)
Total Overhead Variance
Actual Overhead
Overhead Applied*
$118,473
less
$98,868
= $19,605
U
($54,673 +$63,800)
($4.28 X 23,100 hours)
* Based on standard hours allowed for 115,500 units, 115,500 X .20hrs = 23,100 hours)
25-2
(h)
The labor quantity variance is a concern. Perhaps the labor is not as skilled as it should be. The
actual price paid for labor suggests less skill, so it could take workers longer to complete each
unit. Or the materials may not meet the proper standard, causing the workers to take longer to
complete a unit. It could also mean the machinery being used is not working efficiently. Yet
another possibility is that the workers are not being properly supervised and are wasting time
doing unproductive activities.
The materials quantity variance could suggest that insufficient material is being used in
the product (not in keeping with specs) making the product less durable.
The large unfavorable overhead variance may be related to the unfavorable labor quantity
variance. Extra direct labor hours and inefficient use of machines may result in higher indirect
labor costs, more repairs, or higher use of utilities.
25-3
SOLUTION
Chapter 26 Waterways Continuing Problem
WCP26
(a) (1)
NET PRESENT VALUE
Buy New Backhoes
8%
Time
Cash
Discount
Present
Period
Flow
Rate
Value
0
$ 200,000
1
$ (200,000)
0
42,000
1
42,000
8
53,900 5.74664 309,744
Equipment purchase
Salvage value of old equip
Net cash flow
Salvage value
Net present value
8
90,000
0.54027
48,624
$ 200,368
NET PRESENT VALUE
Keep Old Backhoes
Overhaul cost
Net cash flow
Salvage value
Net present value
Time
Cash
Period
Flow
1
$ 55,000
8
40,425
8
15,000
8%
Discount
Present
Rate
Value
0.92593 $ (50,926)
5.74664 232,308
0.54027
8,104
$ 189,486
(2)
PAYBACK METHOD
Cost of Capital Investment Net Annual Cash Flow = Cash Payback Period
New
Old
Cost of Capital Investment
$158,000
$55,000
Net annual cash flow
$ 53,900
$40,425
Payback time
2.93 years
1.36 years
26-1
(3)
INTERNAL RATE OF RETURN
Investment Required Net Annual Cash Flows = Internal Rate of Return Factor
$158,000
$53,900
= 2.9314
$55,000
= 1.36 = a much high return than buying a new one
$40,425
Both of these values are above the factors presented in the text table, so they are
above 15% and well over the required 8% discount rate.
(b)
Intangible benefits include faster completion of jobs due to the increased speed of the backhoes.
The depth and width of the trenches will be more accurate. Also, the new backhoes have
considerably more comforts for the operator than the old backhoes.
However, there would be time involved in training the operators to use the new backhoes.
There may also be some resistance from the operators to change from the machines in which
they now feel competent in handling. Because of the increased speed, these operators who are
paid on an hourly basis may find their incomes decreased if the increased speed does not also
result in increased jobs requiring the use of the backhoes.
(c)
The decision would be a difficult one to make. There is little difference in the net present value,
although buying new backhoes is slightly higher. All the other indicators suggest that keeping
the old backhoes for another 8 years may be the best decision at this time. However, buying new
backhoes would decrease maintenance costs and the time spent on maintenance. This may allow
for additional jobs to be added to the schedule. Depreciation would also increase, which would
lower income—and therefore income taxes—without affecting actual cash flow. Both decisions
would yield a much higher than 8% return on the money invested. Either decision could actually
be defended.
26-2
