Solution manual accounting principles 9e by kieso kimmel chapter 18
Bạn đang xem bản rút gọn của tài liệu. Xem và tải ngay bản đầy đủ của tài liệu tại đây (371.55 KB, 54 trang )
To download more slides, ebook, solutions and test bank, visit
CHAPTER 18
Financial Statement Analysis
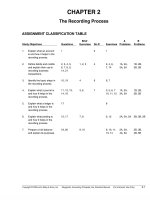
ASSIGNMENT CLASSIFICATION TABLE
Study Objectives
Questions
Brief
Exercises
Do It!
1.
Discuss the need for comparative
analysis.
1, 2, 3, 5
1
3
2.
Identify the tools of financial
statement analysis.
2, 3, 5, 6
2
5
3.
Explain and apply horizontal analysis.
3, 4, 5, 25
2, 3, 5, 6, 7
6
1, 3, 4
4.
Describe and apply vertical analysis.
3, 4, 5, 25
2, 4, 8
3, 4, 5,
6, 7
2, 3, 4
1
5.
Identify and compute ratios used
in analyzing a firm’s liquidity,
profitability, and solvency.
5, 6, 7, 8, 9,
10, 11,12, 13,
14, 15, 16,
17, 18, 19
2, 9, 10, 11,
12, 13
5, 6, 7, 8,
9, 10, 11
1, 2, 3, 4,
5, 6, 7
6.
Understand the concept of earning
power, and how irregular items are
presented.
20, 21, 22, 23
14, 15
12, 13
8, 9
7.
Understand the concept of quality
of earnings.
24
Copyright © 2009 John Wiley & Sons, Inc.
Weygandt, Accounting Principles, 9/e, Solutions Manual
Exercises
Problems
(For Instructor Use Only)
18-1
To download more slides, ebook, solutions and test bank, visit
ASSIGNMENT CHARACTERISTICS TABLE
Problem
Number
18-2
Description
Difficulty
Level
Time
Allotted (min.)
1
Prepare vertical analysis and comment on profitability.
Simple
20–30
2
Compute ratios from balance sheet and income statement.
Simple
20–30
3
Perform ratio analysis, and evaluate financial position
and operating results.
Simple
20–30
4
Compute ratios, and comment on overall liquidity and
profitability.
Moderate
30–40
5
Compute selected ratios, and compare liquidity, profitability,
and solvency for two companies.
Moderate
50–60
6
Compute numerous ratios.
Simple
30–40
7
Compute missing information given a set of ratios.
Complex
30–40
8
Prepare income statement with discontinued operations
and extraordinary loss.
Moderate
30–40
9
Prepare income statement with nontypical items.
Moderate
30–40
Copyright © 2009 John Wiley & Sons, Inc.
Weygandt, Accounting Principles, 9/e, Solutions Manual
(For Instructor Use Only)
To download more slides, ebook, solutions and test bank, visit
WEYGANDT ACCOUNTING PRINCIPLES 9E
CHAPTER 18
FINANCIAL STATEMENT ANALYSIS
Number
SO
BT
Difficulty
Time (min.)
BE1
1
C
Moderate
10–12
BE2
2–5
K, AP
Simple
8–10
BE3
3
AP
Simple
6–8
BE4
4
AP
Simple
6–8
BE5
3
AP
Simple
4–6
BE6
3
AP
Simple
4–6
BE7
3
AP
Simple
4–6
BE8
4
AP
Simple
5–7
BE9
5
AP
Simple
4–6
BE10
5
AP
Simple
3–5
BE11
5
AN
Simple
6–8
BE12
5
AN
Moderate
6–8
BE13
5
AN
Moderate
6–8
BE14
6
AP
Simple
4–6
BE15
6
AP
Simple
3–5
DI1
3
AP
Simple
6–8
DI2
5
AP
Simple
10–12
DI3
6
AP
Simple
6–8
DI4
3–7
C
Simple
3–5
EX1
3
AP
Simple
10–12
EX2
4
AP
Simple
10–12
EX3
3, 4
AP
Simple
12–15
EX4
3, 4
AP
Simple
10–12
EX5
5
AN
Simple
8–10
EX6
5
AP
Simple
8–10
EX7
5
AP
Simple
6–8
EX8
5
AP
Simple
6–8
EX9
5
AP
Simple
6–8
EX10
5
AP
Moderate
8–10
Copyright © 2009 John Wiley & Sons, Inc.
Weygandt, Accounting Principles, 9/e, Solutions Manual
(For Instructor Use Only)
18-3
To download more slides, ebook, solutions and test bank, visit
FINANCIAL STATEMENT ANALYSIS (Continued)
Number
SO
BT
Difficulty
Time (min.)
EX11
5
AP
Simple
10–12
EX12
6
AP
Moderate
8–10
EX13
6
AP
Simple
6–8
P1
4, 5
AN
Simple
20–30
P2
5
AP, AN
Simple
20–30
P3
5
AP, AN
Simple
20–30
P4
5
AN
Moderate
30–40
P5
5
AP
Moderate
50–60
P6
5
AP
Simple
30–40
P7
5
AN
Complex
30–40
P8
6
AP
Moderate
30–40
P9
6
AP
Moderate
30–40
BYP1
3, 5
AN, E
Moderate
20–25
BYP2
3, 5
AN, E
Simple
15–20
BYP3
—
AN
Simple
15–20
BYP4
5
C, E
Moderate
15–20
BYP5
6
AP
Moderate
20–25
BYP6
1, 7
C
Simple
15–20
BYP7
5
E
Simple
10–15
BYP8
—
E
Simple
15–20
18-4
Copyright © 2009 John Wiley & Sons, Inc.
Weygandt, Accounting Principles, 9/e, Solutions Manual
(For Instructor Use Only)
BE18-2
Q18-25
3. Explain and apply horizontal
analysis.
Copyright © 2009 John Wiley & Sons, Inc.
Q18-24
DI18-4
Decision Making
Across the
Organization
Communication
7. Understand the concept of
quality of earnings.
Broadening Your Perspective
P18-2
P18-3
P18-4
P18-5
P18-7
Financial Reporting
Comp. Analysis
Exploring the Web
E18-13
P18-8
P18-9
DI18-4 BE18-14
BE18-15
DI18-3
E18-12
Q18-20
Q18-21
Q18-22
Q18-23
6. Understand the concept of
earning power, and how
irregular items are presented.
BE18-11
BE18-12
BE18-13
E18-5
E18-11
P18-1
E18-8
E18-9
E18-10
P18-2
P18-3
P18-6
Q18-5
Q18-7
Q18-9
Q18-10
Q18-11
Q18-12
Q18-13
Q18-6
Q18-8
BE18-2
5. Identify and compute ratios
used in analyzing a firm’s
liquidity, profitability, and
solvency.
Q18-19
BE18-2
BE18-9
BE18-10
DI18-2
E18-6
E18-7
Q18-14
Q18-15
Q18-16
Q18-17
Q18-18
DI18-4
Q18-3
DI18-4
BE18-2
Q18-25
P18-1
BE18-7
DI18-1
E18-1
E18-3
E18-4
Analysis
E18-2
E18-3
E18-4
Q18-4
BE18-2
BE18-3
BE18-5
BE18-6
BE18-2
Application
Q18-4
BE18-2
BE18-4
BE18-8
Q18-5
4. Describe and apply vertical
analysis.
Q18-3
Q18-5
DI18-4
Q18-2
Q18-3
Q18-6
BE18-2
2. Identify the tools of financial
statement analysis.
Q18-5
BE18-1
Comprehension
Q18-1
Q18-2
Q18-3
Knowledge
1. Discuss the need for comparative
analysis.
Study Objective
Synthesis
Financial Reporting
Comp. Analysis
Decision Making
Across the
Organization
Ethics Case
All About You
Evaluation
Correlation Chart between Bloom’s Taxonomy, Study Objectives and End-of-Chapter Exercises and Problems
To download more slides, ebook, solutions and test bank, visit
BLOOM’S TAXONOMY TABLE
Weygandt, Accounting Principles, 9/e, Solutions Manual
(For Instructor Use Only)
18-5
To download more slides, ebook, solutions and test bank, visit
ANSWERS TO QUESTIONS
1.
(a) Juan is not correct. There are three characteristics: liquidity, profitability, and solvency.
(b) The three parties are not primarily interested in the same characteristics of a company. Short-term
creditors are primarily interested in the liquidity of the enterprise. In contrast, long-term creditors
and stockholders are primarily interested in the profitability and solvency of the company.
2.
(a)
3.
Horizontal analysis (also called trend analysis) measures the dollar and percentage increase or
decrease of an item over a period of time. In this approach, the amount of the item on one statement
is compared with the amount of that same item on one or more earlier statements. Vertical analysis
(also called common-size analysis) expresses each item within a financial statement in terms of a
percent of a base amount.
4.
(a) $360,000 X 1.245 = $448,200, 2011 net income.
(b) $360,000 ÷ .06 = $6,000,000, 2010 revenue.
5.
A ratio expresses the mathematical relationship between one quantity and another. The relationship
is expressed in terms of either a percentage (200%), a rate (2 times), or a simple proportion (2:1).
Ratios can provide clues to underlying conditions that may not be apparent from individual financial
statement components. The ratio is more meaningful when compared to the same ratio in earlier
periods or to competitors’ ratios or to industry ratios.
6.
(a) Liquidity ratios: Current ratio, acid-test ratio, receivables turnover, and inventory turnover.
(b) Solvency ratios: Debt to total assets and times interest earned.
7.
Cindy is correct. A single ratio by itself may not be very meaningful and is best interpreted by
comparison with: (1) past ratios of the same company, (2) ratios of other companies, or (3) industry
norms or predetermined standards. In addition, other ratios of the enterprise are necessary to
determine overall financial well-being.
8.
(a) Liquidity ratios measure the short-term ability of the enterprise to pay its maturing obligations
and to meet unexpected needs for cash.
(b) Profitability ratios measure the income or operating success of a company for a given period of time.
(c) Solvency ratios measure the ability of the company to survive over a long period of time.
18-6
Comparison of financial information can be made on an intracompany basis, an intercompany
basis, and an industry average basis (or norms).
(1) An intracompany basis compares an item or financial relationship within a company in
the current year with the same item or relationship in one or more prior years.
(2) The industry averages basis compares an item or financial relationship of a company
with industry averages (or norms) published by financial rating services.
(3) An intercompany basis compares an item or financial relationship of one company with
the same item or relationship in one or more competing companies.
(b) The intracompany basis of comparison is useful in detecting changes in financial relationships
and significant trends within a company.
The industry averages basis provides information as to a company’s relative performance
within the industry.
The intercompany basis of comparison provides insight into a company’s competitive position.
Copyright © 2009 John Wiley & Sons, Inc.
Weygandt, Accounting Principles, 9/e, Solutions Manual
(For Instructor Use Only)
To download more slides, ebook, solutions and test bank, visit
Questions Chapter 18 (Continued)
9.
The current ratio relates current assets to current liabilities. The acid-test ratio relates cash, short-term
investments, and net receivables to current liabilities. The current ratio includes inventory and
prepaid expenses while the acid-test ratio excludes these. The acid-test ratio provides additional
information about short-term liquidity and is an important complement to the current ratio.
10.
Donte Company does not necessarily have a problem. The receivables turnover ratio can be
misleading in that some companies encourage credit and revolving charge sales and slow collections
in order to earn a healthy return on the outstanding receivables in the form of high rates of interest.
11.
(a) Asset turnover.
(b) Inventory turnover.
(c) Return on common stockholders’ equity.
(d) Times interest earned.
12.
The price earnings (P/E) ratio is a reflection of investors’ assessments of a company’s future
earnings. In this question, investors favor Microsoft because it has the higher P/E ratio. The investors
feel that Microsoft will be able to generate even higher future earnings and so the investors are
willing to pay more for the stock.
13.
The payout ratio is cash dividends divided by net income. In a growth company, the payout ratio is
often low because the company is reinvesting earnings in the business.
14.
(a) The increase in profit margin is good news because it means that a greater percentage of net
sales is going towards income.
(b) The decrease in inventory turnover signals bad news because it is taking the company longer
to sell the inventory and consequently there is a greater chance of inventory obsolescence.
(c) An increase in the current ratio signals good news because the company improved its ability
to meet maturing short-term obligations.
(d) The earnings per share ratio is a deceptive ratio. The decrease might be bad news to the
company because it could mean a decrease in net income. If there is an increase in stockholders’
investment (as a result of issuing additional shares) and a decrease in EPS, then this means
that the additional investment is earning a lower return (as compared to the return on common
equity before the additional investment). Generally, this is undesirable.
(e) The increase in the price-earnings ratio is generally good news because it means that the
market price per share of stock has increased and investors are willing to pay that higher
price for the stock. An increase in the P/E ratio is good news for investors who own the stock
and don’t want to buy any more. It is bad news for investors who want to buy (or buy more of)
the stock.
(f) The increase in the debt to total assets ratio is bad news because it means that the company
has increased its obligations to creditors and has lowered its equity “buffer.”
(g) The decrease in the times interest earned ratio is bad news because it means that the company’s
ability to meet interest payments as they come due has weakened.
Copyright © 2009 John Wiley & Sons, Inc.
Weygandt, Accounting Principles, 9/e, Solutions Manual
(For Instructor Use Only)
18-7
To download more slides, ebook, solutions and test bank, visit
Questions Chapter 18 (Continued)
Net Income
Return on assets =
Average Assets
(7.6%)
15.
Net Income – Preferred Dividends
Return on common stockholders’ equity =
Average Common Stockholde rs' Equity
(12.8%)
The difference between the two rates can be explained by looking at the denominator value and
by remembering the basic accounting equation, A = L + SE. The asset value will clearly be the larger
of the two denominator values; therefore, it will also give the smaller return.
16.
(a)
17.
Earnings per share means earnings per share of common stock. Preferred stock dividends are
subtracted from net income in computing EPS in order to obtain income available to common
stockholders.
18.
(a) Trading on the equity means that the company has borrowed money at a lower rate of interest
than it is able to earn by using the borrowed money. Simply stated, it is using money supplied
by nonowners to increase the return to the owners.
(b) A comparison of the return on total assets with the rate of interest paid for borrowed money
indicates the profitability of trading on the equity.
19.
The times interest earned ratio, which is an indication of the company’s ability to meet interest
payments, and the debt to total assets ratio, which indicates the company’s ability to withstand
losses without impairing the interests of creditors.
(b) The current ratio and the acid-test ratio, which indicate a company’s liquidity and short-term
debt-paying ability.
(c) The earnings per share and the return on stockholders’ equity, both of which indicate the earning
power of the investment.
Net income – Preferred dividends
= Earnings per share
Weighted average common shares outstandin g
$160,000 – $40,000
= $2.40
50,000
EPS of $2.40 is high relative to what? Is it high relative to last year’s EPS? The president may be
comparing the EPS of $2.40 to the market price of the company’s stock.
20.
Discontinued operations refers to the disposal of a significant component of the business such as
the stopping of an entire activity or eliminating a major class of customers. It is important to report
discontinued operations separately from continuing operations because the discontinued component
will not affect future income statements.
21.
EPS on income before extraordinary items usually is more relevant to an investment decision
than EPS on net income. Income before extraordinary items represents the results of continuing
and ordinary business activity. It is therefore a better basis for predicting future operating results
than an EPS figure which includes the effect of extraordinary items that are not expected to recur
again in the foreseeable future.
18-8
Copyright © 2009 John Wiley & Sons, Inc.
Weygandt, Accounting Principles, 9/e, Solutions Manual
(For Instructor Use Only)
To download more slides, ebook, solutions and test bank, visit
Questions Chapter 18 (Continued)
22.
Extraordinary items are events and transactions that are unusual in nature and infrequent in occurrence.
Therefore, an extraordinary item is a one-time item which is not typical of the company’s operations.
When comparing EPS trends, extraordinary items should be omitted since they are not reflective
of normal operations. In this example, the trend is unfavorable because EPS, exclusive of extraordinary
items, has decreased from $3.20 to $2.99.
23.
Items (a), (d), and (g) are extraordinary items.
24.
(1) Use of alternative accounting methods. Variations among companies in the application of
generally accepted accounting principles may hamper comparability.
(2) Use of pro forma income measures that do not follow GAAP. Pro forma income is calculated
by excluding items that the company believes are unusual or nonrecurring. It is often difficult
to determine what was included and excluded.
(3) Improper revenue and expense recognition. Many high-profile cases of inappropriate accounting
involve recording items in the wrong period.
25.
The following provide examples of horizontal and vertical analysis:
Horizontal Analysis: Financial Highlights; Results of operations-consolidated reviews; Result of
Operations–Division Review; and Reconciliation of GAAP and Non-GAAP information.
Vertical Analysis: Pie charts; Asset category allocation; and Reconciliation of GAAP and NonGAAP information.
Copyright © 2009 John Wiley & Sons, Inc.
Weygandt, Accounting Principles, 9/e, Solutions Manual
(For Instructor Use Only)
18-9
To download more slides, ebook, solutions and test bank, visit
SOLUTIONS TO BRIEF EXERCISES
BRIEF EXERCISE 18-1
Dear Uncle Frank,
It was so good to hear from you! I hope you and Aunt Irene are still enjoying
your new house.
You asked some interesting questions. They relate very well to the material
that we are studying now in my financial accounting class. You said you
heard that different users of financial statements are interested in different
characteristics of companies. This is true. A short-term creditor, such as a bank,
is interested in the company’s liquidity, or ability to pay obligations as they
become due. The liquidity of a borrower is extremely important in evaluating
the safety of a loan. A long-term creditor, such as a bondholder, would be
interested in solvency, the company’s ability to survive over a long period
of time. A long-term creditor would also be interested in profitability. They
are interested in the likelihood that the company will survive over the life of the
debt and be able to meet interest payments. Stockholders are also interested
in profitability, and in the solvency of the company. They want to assess the
likelihood of dividends and the growth potential of the stock.
It is important to compare different financial statement elements to other
items. The amount of a financial statement element such as cash does not have
much meaning unless it is compared to something else. Comparisons can
be done on an intracompany basis. This basis compares an item or financial
relationship within a company for the current year to one or more previous
years. Intracompany comparisons are useful in detecting changes in financial
relationships and significant trends. Comparisons can also be done with
industry averages. This basis compares an item or financial relationship
with industry averages or norms. Comparisons with industry averages provide
information as to a company’s relative performance within the industry. Finally,
comparisons can be done on an intercompany basis. This basis compares
an item or financial relationship with the same item or relationship in one or more
competing companies. Intercompany comparisons are useful in determining
a company’s competitive position.
I hope this answers your questions. If it does not, or you have more questions,
please write me again or call. We could even meet for lunch sometime; it
would be great to see you!
Love,
Your niece (or nephew)
18-10
Copyright © 2009 John Wiley & Sons, Inc.
Weygandt, Accounting Principles, 9/e, Solutions Manual
(For Instructor Use Only)
To download more slides, ebook, solutions and test bank, visit
BRIEF EXERCISE 18-2
(a) The three tools of financial statement analysis are horizontal analysis,
vertical analysis, and ratio analysis. Horizontal analysis evaluates a series
of financial statement data over a period of time. Vertical analysis evaluates financial statement data by expressing each item in a financial
statement as a percent of a base amount. Ratio analysis expresses the
relationship among selected items of financial statement data.
(b) Horizontal Analysis
Current assets
2009
100%
2010
115%
2011
120%
(115 = $230,000/$200,000; 120 = $240,000/$200,000)
Vertical Analysis
Current assets*
2009
40%
2010
38%
2011
39%
*as a percentage of total assets
(40% = $200,000/$500,000; 38% = $230,000/$600,000;
39% = $240,000/$620,000)
Ratio Analysis
Current ratio
2009
1.25
2010
1.37
2011
1.30
(1.25 = $200,000/$160,000; 1.37 = $230,000/$168,000;
1.30 = $240,000/$184,000)
BRIEF EXERCISE 18-3
Horizontal analysis:
Increase
or (Decrease)
Dec. 31, 2011 Dec. 31, 2010
Accounts receivable
Inventory
Total assets
120,000
= .30
400,000
Copyright © 2009 John Wiley & Sons, Inc.
$ 520,000
$ 840,000
$3,000,000
240,000
= .40
600,000
$ 400,000
$ 600,000
$2,500,000
Amount
Percentage
$120,000
$240,000
$500,000
30%
40%
20%
500,000
= .20
2,500,000
Weygandt, Accounting Principles, 9/e, Solutions Manual
(For Instructor Use Only)
18-11
To download more slides, ebook, solutions and test bank, visit
BRIEF EXERCISE 18-4
Vertical analysis:
Dec. 31, 2011
Amount
Percentage*
Accounts receivable
Inventory
Total assets
$ 520,000
$ 840,000
$3,000,000
17.3%
28.0%
100%
* 520,000
= .173
3,000,000
** 400,000
= .16
2,500,000
* 840,000
= .28
3,000,000
** 600,000
= .24
2,500,000
Dec. 31, 2010
Amount Percentage**
$ 400,000
$ 600,000
$2,500,000
16.0%
24.0%
100%
BRIEF EXERCISE 18-5
Net income
2011
2010
2009
$522,000
$450,000
$500,000
Increase or (Decrease)
(a) 2009–2010
(b) 2010–2011
Amount
Percentage
(50,000)
(72,000)
(10%)
(16%)
50,000
= .10
500,000
72,000
= .16
450,000
BRIEF EXERCISE 18-6
Net income
X .30 =
2011
2010
Increase
$585,000
X
30%
585,000 – X
X
.30X = 585,000 – X
18-12
Copyright © 2009 John Wiley & Sons, Inc.
Weygandt, Accounting Principles, 9/e, Solutions Manual
(For Instructor Use Only)
To download more slides, ebook, solutions and test bank, visit
BRIEF EXERCISE 18-6 (Continued)
1.30X = 585,000
X = 450,000
2010 Net income = $450,000
BRIEF EXERCISE 18-7
Comparing the percentages presented results in the following conclusions:
The net income for Epstein increased in 2010 because of the combination
of an increase in sales and a decrease in both cost of goods sold and expenses.
However, the reverse was true in 2011 as sales decreased while both cost of
goods sold and expenses increased. This resulted in a decrease in net income.
BRIEF EXERCISE 18-8
Sales
Cost of goods sold
Expenses
Net income
2011
100.0
59.2
25.0
15.8
2010
100.0
62.4
25.6
12.0
2009
100.0
64.5
27.5
8.0
Net income as a percent of sales for Charles increased over the three-year
period because cost of goods sold and expenses both decreased as a percent
of sales every year.
BRIEF EXERCISE 18-9
(a) Working capital = Current assets – Current liabilities
Current assets
Current liabilities
Working capital
Copyright © 2009 John Wiley & Sons, Inc.
$45,918,000
40,644,000
$ 5,274,000
Weygandt, Accounting Principles, 9/e, Solutions Manual
(For Instructor Use Only)
18-13
To download more slides, ebook, solutions and test bank, visit
BRIEF EXERCISE 18-9 (Continued)
(b) Current ratio:
Current assets
$45,918,000
=
Current liabilities $40,644,000
= 1.13:1
(c) Acid-test ratio:
Cash + Short-term investments
ceivables (net)
+ Rec
$8,041,000 + $4,947,000 + $12,545,000
=
Current liabilities
0
$40,644,000
=
$25,533,000
$40,644,000
= .63:1
BRIEF EXERCISE 18-10
(a) Asset turnover =
=
Net sales
Average assets
$80,000,000
$14,000,000 + $18,000,000
2
= 5 times
(b) Profit margin
=
Net income
Net sales
=
$11,440,000
$80,000,000
= 14.3%
18-14
Copyright © 2009 John Wiley & Sons, Inc.
Weygandt, Accounting Principles, 9/e, Solutions Manual
(For Instructor Use Only)
To download more slides, ebook, solutions and test bank, visit
BRIEF EXERCISE 18-11
(a) Receivables turnover =
Net credit sales
Average net receivables
2011
2010
(1)
$3,960,000
= 7.4 times
$535,000*
*($520,000 + $550,000) ÷ 2
(2)
Average collection period
365
= 49.3 days
7.4
$3,100,000
= 6.2 times
$500,000**
**($480,000 + $520,000) ÷ 2
365
= 58.9 days
6.2
(b) Marino Company should be pleased with the effectiveness of its credit
and collection policies. The company has decreased the average collection
period by 9.6 days and the collection period of approximately 49 days
is well within the 60 days allowed in the credit terms.
BRIEF EXERCISE 18-12
(a) Inventory turnover =
(1)
Cost of goods sold
Average inventory
2011
2010
$4,300,000
= 4.3 times
$980,000 + $1,020,000
2
$4,541,000
= 4.9 times
$860,000 + $980,000
2
Beginning inventory
Purchases
Goods available for sale
Ending inventory
Cost of goods sold
$ 980,000
4,340,000
5,320,000
1,020,000
$4,300,000
$ 860,000
4,661,000
5,521,000
980,000
$4,541,000
(2) Days in inventory
365
= 84.9 days
4.3
Copyright © 2009 John Wiley & Sons, Inc.
365
= 74.5 days
4.9
Weygandt, Accounting Principles, 9/e, Solutions Manual
(For Instructor Use Only)
18-15
To download more slides, ebook, solutions and test bank, visit
BRIEF EXERCISE 18-12 (Continued)
(b) Management should be concerned with the fact that inventory is moving
slower in 2011 than it did in 2010. The decrease in the turnover could be
because of poor pricing decisions or because the company is stuck
with obsolete inventory.
BRIEF EXERCISE 18-13
Payout ratio =
Cash dividends
Net income
.20 =
X
$66,000
X = $66,000 (.20) = $13,200
Cash dividends = $13,200
Return on assets=
Net income
Average assets
.15 =
$66,000
X
.15X = $66,000
X=
$66,000
.15
X = $440,000
Average assets = $440,000
18-16
Copyright © 2009 John Wiley & Sons, Inc.
Weygandt, Accounting Principles, 9/e, Solutions Manual
(For Instructor Use Only)
To download more slides, ebook, solutions and test bank, visit
BRIEF EXERCISE 18-14
MING CORPORATION
Partial Income Statement
Income before income taxes ....................................................................
Income tax expense ($400,000 X 30%)..................................................
Income before extraordinary item ..........................................................
Extraordinary loss from flood, net of $21,000
tax savings ($70,000 X 30%) ............................................................
Net income .....................................................................................................
$400,000
120,000
280,000
49,000
$231,000
BRIEF EXERCISE 18-15
REEVES CORPORATION
Partial Income Statement
Loss from operations of Mexico facility, net
of $90,000 tax saving ($300,000 X 30%)...................... $210,000
Loss on disposal of Mexico facility, net of
$36,000 tax saving ($120,000 X 30%) ...........................
84,000 $294,000
SOLUTIONS FOR DO IT! REVIEW EXERCISES
DO IT! 18-1
Current assets
Plant assets
Total assets
Amount
$(21,000)
41,000
$ 20,000
Copyright © 2009 John Wiley & Sons, Inc.
Increase in 2011
Percent
(9.5)% [($199,000 – $220,000) ÷ $220,000]
5.3% [($821,000 – $780,000) ÷ $780,000]
2.0% [($1,020,000 – $1,000,000) ÷ $1,000,000]
Weygandt, Accounting Principles, 9/e, Solutions Manual
(For Instructor Use Only)
18-17
To download more slides, ebook, solutions and test bank, visit
DO IT! 18-2
2010
(a) Current ratio:
$1,380 ÷ $900 =
$1,310 ÷ $790 =
1.53:1
(b) Inventory turnover:
$970/[($460 + $390) ÷ 2)] =
$890/[($390 + $340) ÷ 2)]=
2.28 times
1.66:1
2.44 times
(c) Profit margin ratio:
$252 ÷ $3,800 =
$88 ÷ $3,460 =
6.6%
2.5%
(d) Return on assets:
$252/[($2,340 + $2,210) ÷ 2)] =
$88/[($2,210 + $1,900) ÷ 2)] =
11.1%
(e) Return on common stockholders’ equity:
$252/[($1,030 + $1,040) ÷ 2)] =
$88/[$1,040 + $900) ÷ 2)] =
24.3%
(f)
Debt to total assets ratio:
$1,310 ÷ $2,340 =
$1,170 ÷ $2,210 =
Copyright © 2009 John Wiley & Sons, Inc.
4.3%
9.1%
56.0%
52.9%
(g) Times interest earned:
($252 + $168 + $10) ÷ $10 =
($88 + $132 + $20) ÷ $20 =
18-18
2009
43 times
Weygandt, Accounting Principles, 9/e, Solutions Manual
12 times
(For Instructor Use Only)
To download more slides, ebook, solutions and test bank, visit
DO IT! 18-3
SUPPLY CORPORATION
Income Statement (Partial)
Income before income taxes ................................................
Income tax expense ................................................................
Income from continuing operations ..................................
Discontinued operations
Loss from operations of music
division, net of $24,000 tax saving..........................
Gain from disposal of music
division, net of $16,000, taxes ..................................
Income before extraordinary item ......................................
Extraordinary earthquake loss,
net of $60,000 tax saving....................................................
Net income .................................................................................
$500,000
200,000
300,000
$36,000
24,000
12,000
288,000
90,000
$198,000
DO IT! 18-4
1.
2.
3.
4.
5.
6.
Current ratio:
A measure used to evaluate a company’s
liquidity.
Pro forma income:
Usually excludes items that a company
thinks are unusual or nonrecurring.
Quality of earnings:
Indicates the level of full and transparent
information provided to users of the
financial statements.
Discontinued operations: The disposal of a significant segment of a
business.
Horizontal analysis:
Determines increases or decreases in a
series of financial statement data.
Comprehensive income: Includes all changes in stockholders’ equity
during a period except those resulting from
investments by stockholders and distributions to stockholders.
Copyright © 2009 John Wiley & Sons, Inc.
Weygandt, Accounting Principles, 9/e, Solutions Manual
(For Instructor Use Only)
18-19
To download more slides, ebook, solutions and test bank, visit
SOLUTIONS TO EXERCISES
EXERCISE 18-1
BLEVINS INC.
Condensed Balance Sheets
December 31
Increase or (Decrease)
2011
2010
Amount
Percentage
$125,000
396,000
$521,000
$100,000
330,000
$430,000
($25,000
( 66,000
91,000
(25.0%)
(20.0%)
(21.2%)
$ 91,000
133,000
224,000
$ 70,000
95,000
165,000
($21,000)
( 38,000)
( 59,000)
(30.0%)
(40.0%)
(35.8%)
161,000
136,000
115,000
150,000
( 46,000
(14,000)
(40.0%)
(9.3%)
297,000
265,000
( 32,000)
( 12.1%)
$521,000
$430,000
($91,000)
21.2%
Assets
Current assets
Plant assets (net)
Total assets
Liabilities
Current liabilities
Long-term liabilities
Total liabilities
Stockholders’ Equity
Common stock, $1 par
Retained earnings
Total stockholders’
equity
Total liabilities and
stockholders’
equity
18-20
Copyright © 2009 John Wiley & Sons, Inc.
Weygandt, Accounting Principles, 9/e, Solutions Manual
(For Instructor Use Only)
To download more slides, ebook, solutions and test bank, visit
EXERCISE 18-2
GALLUP CORPORATION
Condensed Income Statements
For the Years Ended December 31
2011
Sales
Cost of goods sold
Gross profit
Selling expenses
Administrative expenses
Total operating expenses
Income before income taxes
Income tax expense
Net income
2010
Amount
Percent
Amount
Percent
$750,000
465,000
285,000
120,000
60,000
180,000
105,000
33,000
$ 72,000
100.0%
62.0%
38.0%
16.0%
8.0%
24.0%
14.0%
4.4%
9.6%
$600,000
390,000
210,000
72,000
54,000
126,000
84,000
24,000
$ 60,000
100.0%
65.0%
35.0%
12.0%
9.0%
21.0%
14.0%
4.0%
10.0%
EXERCISE 18-3
(a)
CONARD CORPORATION
Condensed Balance Sheets
December 31
Assets
Current assets
Property, plant &
equipment (net)
Intangibles
Total assets
Copyright © 2009 John Wiley & Sons, Inc.
Percentage
Change
from 2010
2011
2010
Increase
(Decrease)
$ 74,000
$ 80,000
$ (6,000)
(7.5%)
90,000
99,000
40,000
27,000
$200,000 $210,000
( 9,000)
(13,000)
$(10,000)
(10.0%)
(32.5%)
(4.8%)
Weygandt, Accounting Principles, 9/e, Solutions Manual
(For Instructor Use Only)
18-21
To download more slides, ebook, solutions and test bank, visit
EXERCISE 18-3 (Continued)
CONARD CORPORATION
Condensed Balance Sheets (Continued)
December 31
2011
2010
Liabilities and stockholders’ equity
Current liabilities
$ 42,000 $ 48,000
Long-term
liabilities
143,000 150,000
Stockholders’
12,000
equity
15,000
Total liabilities and
stockholders’
$200,000 $210,000
equity
(b)
18-22
Percentage
Increase
Change
(Decrease) from 2010
$ (6,000)
(12.5%)
(7,000)
(4.7%)
3,000)
(25.0%)
$(10,000)
(4.8%)
CONARD CORPORATION
Condensed Balance Sheet
December 31, 2011
Amount
Percent
Assets
Current assets
Property, plant, and equipment (net)
Intangibles
Total assets
$ 74,000
99,000
27,000
$200,000
37.0%
49.5%
13.5%
100.0%
Liabilities and stockholders’ equity
Current liabilities
Long-term liabilities
Stockholders’ equity
Total liabilities and stockholders’ equity
$ 42,000
143,000
15,000
$200,000
21.0%
71.5%
7.5%
100.0%
Copyright © 2009 John Wiley & Sons, Inc.
Weygandt, Accounting Principles, 9/e, Solutions Manual
(For Instructor Use Only)
To download more slides, ebook, solutions and test bank, visit
EXERCISE 18-4
(a)
HENDI CORPORATION
Condensed Income Statements
For the Years Ended December 31
Increase or (Decrease)
During 2010
Net sales
Cost of goods sold
Gross profit
Operating expenses
Net income
(b)
2011
2010
Amount
$600,000
483,000
117,000
57,200
$ 59,800
$500,000
420,000
80,000
44,000
$ 36,000
$100,000
63,000
37,000
13,200
$ 23,800
Percentage
20.0%
15.0%
46.3%
30.0%
66.1%
HENDI CORPORATION
Condensed Income Statements
For the Years Ended December 31
2011
Net sales
Cost of goods sold
Gross profit
Operating expenses
Net income
2010
Amount
Percent
Amount
Percent
$600,000
483,000
117,000
57,200
$ 59,800
100.0%
80.5%
19.5%
9.5%
10.0%
$500,000
420,000
80,000
44,000
$ 36,000
100.0%
84.0%
16.0%
8.8%
7.2%
EXERCISE 18-5
(a) Current ratio = 2.1:1 ($3,361 ÷ $1,635)
Acid-test ratio = 1.31:1 ($2,146 ÷ $1,635)
Receivables turnover = 7.1 times ($8,828 ÷ $1,236)*
Inventory turnover = 5.7 times ($5,526 ÷ $976.5)**
*($1,788 + $684) ÷ 2
**(956 + 997) ÷ 2
Copyright © 2009 John Wiley & Sons, Inc.
Weygandt, Accounting Principles, 9/e, Solutions Manual
(For Instructor Use Only)
18-23
To download more slides, ebook, solutions and test bank, visit
EXERCISE 18-5 (Continued)
(b)
Ratio
Current
Acid-test
Receivables turnover
Inventory turnover
Nordstrom
J.C. Penney
Industry
2.1:1
1.31:1
7.1
5.7
2.0:1
.87:1
57.0
3.5
1.06:1
.29:1
28.2
7.0
Nordstrom is above J.C. Penney for the current and acid-test ratios,
but significantly below for the receivables turnover. Nordstrom is also
better than J.C. Penney for inventory turnover.
Nordstrom is better than the industry average for the current and acid
test ratios but below the industry average for the receivables turnover
and the inventory turnover ratio.
EXERCISE 18-6
(a) Current ratio as of February 1, 2010 = 2.6:1 ($130,000 ÷ $50,000).
Feb. 3
7
11
14
18
2.6:1
2.0:1
2.0:1
2.4:1
2.1:1
No change in total current assets or liabilities.
($102,000 ÷ $50,000).
No change in total current assets or liabilities.
($90,000 ÷ $38,000).
($90,000 ÷ $43,000).
(b) Acid-test ratio as of February 1, 2010 = 2.3:1 ($113,000* ÷ $50,000).
*$130,000 – $15,000 – $2,000
Feb. 3
7
11
14
18
18-24
2.3:1
1.7:1
1.6:1
1.8:1
1.6:1
No change in total quick assets or current liabilities.
($85,000 ÷ $50,000).
($82,000 ÷ $50,000).
($70,000 ÷ $38,000).
($70,000 ÷ $43,000).
Copyright © 2009 John Wiley & Sons, Inc.
Weygandt, Accounting Principles, 9/e, Solutions Manual
(For Instructor Use Only)
To download more slides, ebook, solutions and test bank, visit
EXERCISE 18-7
(a)
$145,000
= 2.9:1.
$50,000
(b)
$85,000
= 1.7:1.
$50,000
(c)
$390,000
= 6.0 times.
$65,000 (1)
(d)
$198,000
= 3.6 times.
$55,000 (2)
(1)
$70,000 + $60,000
2
(2)
$60,000 + $50,000
2
EXERCISE 18-8
$50,000
= 6.6%.
$760,000
(a) Profit margin
$760,000
= 1.4 times.
$500,000 + $580,000
2
(b) Asset turnover
$50,000
= 9.3%.
$540,000
(c) Return on assets
(d) Return on common stockholders’
equity
Copyright © 2009 John Wiley & Sons, Inc.
$50,000
= 13.2%.
$325,000 + $430,000
2
Weygandt, Accounting Principles, 9/e, Solutions Manual
(For Instructor Use Only)
18-25