Solution manual accounting principles 9e by kieso kimmel chapter 24
Bạn đang xem bản rút gọn của tài liệu. Xem và tải ngay bản đầy đủ của tài liệu tại đây (422.48 KB, 66 trang )
To download more slides, ebook, solutions and test bank, visit
CHAPTER 24
Budgetary Control and Responsibility Accounting
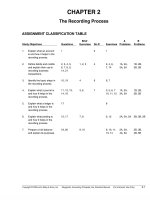
ASSIGNMENT CLASSIFICATION TABLE
Brief
Exercises
A
Problems
B
Problems
1, 2, 8
3A
3B
6
1, 3, 4, 5, 6,
7, 8, 9, 10
1A, 2A, 3A
1B, 2B, 3B
7
11
6A
Study Objectives
Questions
1.
Describe the concept of
budgetary control.
1, 2
2.
Evaluate the usefulness
of static budget reports.
3, 4, 5
3.
Explain the development
of flexible budgets and
the usefulness of flexible
budget reports.
6, 7, 8, 9,
10, 11, 12
4.
Describe the concept of
responsibility accounting.
13, 14, 15,
16, 17, 18, 24
5.
Indicate the features of
responsibility reports
for cost centers.
19
6
7, 9, 12
6.
Identify the content of
responsibility reports
for profit centers.
20, 21
7
13, 14
4A
4B
7.
Explain the basis and
formula used in evaluating
performance in
investment centers.
22, 23, 24
8, 9, 10
14, 15, 16,
17
5A
5B
Copyright © 2009 John Wiley & Sons, Inc.
Do It!
Exercises
3
1
1, 2
3
3, 4, 5
Weygandt, Accounting Principles, 9/e, Solutions Manual
(For Instructor Use Only)
24-1
To download more slides, ebook, solutions and test bank, visit
ASSIGNMENT CHARACTERISTICS TABLE
Problem
Number
Description
Difficulty
Level
Time
Allotted (min.)
Simple
20–30
Moderate
30–40
Simple
20–30
1A
Prepare flexible budget and budget report for manufacturing
overhead.
2A
Prepare flexible budget, budget report, and graph for
manufacturing overhead.
3A
State total budgeted cost formula, and prepare flexible
budget reports for two time periods.
4A
Prepare responsibility report for a profit center.
Moderate
20–30
5A
Prepare responsibility report for an investment center,
and compute ROI.
Moderate
40–50
6A
Prepare reports for cost centers under responsibility
accounting, and comment on performance of managers.
Moderate
40–50
1B
Prepare flexible budget and budget report for manufacturing
overhead.
Simple
20–30
2B
Prepare flexible budget, budget report, and graph for
manufacturing overhead.
Moderate
30–40
3B
State total budgeted cost formula, and prepare flexible
budget reports for two time periods.
Simple
20–30
4B
Prepare responsibility report for a profit center.
Moderate
20–30
5B
Prepare responsibility report for an investment center,
and compute ROI.
Moderate
40–50
24-2
Copyright © 2009 John Wiley & Sons, Inc.
Weygandt, Accounting Principles, 9/e, Solutions Manual
(For Instructor Use Only)
To download more slides, ebook, solutions and test bank, visit
WEYGANDT ACCOUNTING PRINCIPLES 9E
CHAPTER 24
BUDGETARY CONTROL AND RESPONSIBILITY
ACCOUNTING
Number
SO
BT
Difficulty
Time (min.)
BE1
2
AP
Simple
2–4
BE2
2
AP
Simple
4–6
BE3
3
E
Simple
6–8
BE4
3
AP
Simple
6–8
BE5
3
AN
Simple
6–8
BE6
5
AP
Simple
4–6
BE7
6
AP
Simple
5–7
BE8
7
AP
Simple
6–8
BE9
7
AP
Simple
4–6
BE10
7
AP
Simple
6–8
DI1
3
AP
Simple
3–5
DI2
3
AP
Simple
6–8
DI3
6
AP
Simple
4–6
DI4
7
AP
Simple
6–8
EX1
1, 2, 3
K
Simple
6–8
EX2
2
AN
Simple
8–10
EX3
3
AP
Simple
8–10
EX4
3
AN
Moderate
12–15
EX5
3
AP
Simple
8–10
EX6
3
AN
Moderate
10–12
EX7
3, 5
AP
Simple
10–12
EX8
3
E
Moderate
8–10
EX9
3, 5
AP
Simple
10–12
EX10
3
AP
Simple
10–12
EX11
4
AP
Simple
10–12
EX12
5
AN
Simple
8–10
EX13
6
AN
Moderate
10–12
EX14
6, 7
AP
Simple
8–10
EX15
7
AP
Simple
8–10
EX16
7
AP
Simple
12–15
EX17
7
AN
Moderate
8–10
Copyright © 2009 John Wiley & Sons, Inc.
Weygandt, Accounting Principles, 9/e, Solutions Manual
(For Instructor Use Only)
24-3
To download more slides, ebook, solutions and test bank, visit
BUDGETARY CONTROL AND RESPONSIBILITY
ACCOUNTING (Continued)
Number
SO
BT
Difficulty
Time (min.)
P1A
3
AN
Simple
20–30
P2A
3
E
Moderate
30–40
P3A
2, 3
AN
Simple
20–30
P4A
6
AN
Moderate
20–30
P5A
7
E
Moderate
40–50
P6A
4
AN
Moderate
40–50
P1B
3
AN
Simple
20–30
P2B
3
E
Moderate
30–40
P3B
2, 3
AN
Simple
20–30
P4B
6
AN
Moderate
20–30
P5B
7
E
Moderate
40–50
BYP1
2, 3
S, E
Moderate
25–30
BYP2
3, 4
S, E
Moderate
15–20
BYP3
1
AN, E
Simple
5–10
BYP4
3
AP
Simple
15–20
BYP5
4, 5
AN, S
Moderate
20–25
BYP6
7
AN, E
Simple
10–15
BYP7
—
E
Simple
10–15
24-4
Copyright © 2009 John Wiley & Sons, Inc.
Weygandt, Accounting Principles, 9/e, Solutions Manual
(For Instructor Use Only)
Copyright © 2009 John Wiley & Sons, Inc.
Weygandt, Accounting Principles, 9/e, Solutions Manual
E24-13
P24-4A
P24-4B
E24-12
P24-6A
BE24-5
E24-4
E24-6
P24-1A
P24-3A
E24-14 E24-17
E24-15
E24-16
E24-17
E24-5
E24-7
E24-9
E24-10
E24-2
P24-3A
P24-3B
P24-1B
P24-3B
Analysis
Synthesis
P24-5A
P24-5B
BE24-3
E24-8
P24-2A
P24-2B
E24-8
Evaluation
Exploring the Web Real-World Focus Communication All About You
Manag. Analysis Decision Making
Ethics Case
Decision Making Across the
Communication
Organization
Across the
Ethics Case
Organization
Manag. Analysis
Real-World Focus
BE24-8
BE24-9
BE24-10
DI24-4
Q24-22
Q24-23
Q24-24
7. Explain the basis and
formula used in evaluating
performance in investment
centers.
Broadening Your Perspective
BE24-7
DI24-3
E24-14
BE24-6
E24-7
E24-9
Q24-20
Q24-21
Q24-19
6. Identify the content of
responsibility reports
for profit centers.
5. Indicate the features of
responsibility reports
for cost centers.
Q24-17 E24-11
Q24-18
Q24-24
Q24-6
Q24-7
Q24-8
Q24-10
Q24-9
Q24-12
E24-1
3. Explain the development
of flexible budgets and
the usefulness of flexible
budget reports.
Q24-13
Q24-14
Q24-15
Q24-16
Q24-11
BE24-4
DI24-1
DI24-2
E24-3
Q24-3
Q24-4
Q24-5
E24-1
2. Evaluate the usefulness
of static budget reports.
4. Describe the concept of
responsibility accounting.
BE24-1
BE24-2
Q24-1
Q24-2
Application
E24-1
Knowledge Comprehension
1. Describe the concept
of budgetary control.
Study Objective
Correlation Chart between Bloom’s Taxonomy, Study Objectives and End-of-Chapter Exercises and Problems
To download more slides, ebook, solutions and test bank, visit
BLOOM’S TAXONOMY TABLE
(For Instructor Use Only)
24-5
To download more slides, ebook, solutions and test bank, visit
ANSWERS TO QUESTIONS
1.
(a) Budgetary control is the use of budgets in controlling operations.
(b) The steps in budgetary control are:
(1) Develop the planned objectives (budget).
(2) Analyze differences between actual and budgeted results.
(3) Take corrective action.
(4) Modify future plans, if necessary.
2.
Purpose
(a)
(b)
(c)
Name of Report
Frequency
Scrap
Departmental overhead costs
Income statement
Daily
Monthly
Monthly and Quarterly
Primary Recipient(s)
Production manager
Department manager
Top management
3.
The budget report for the second quarter can include year-to-date information as well as data for
the second quarter.
4.
There is no justification for Joe’s concern. The sales budget is derived from the sales forecast
and it represents management’s best estimate of sales. Thus, it is a useful basis for evaluating
sales performance.
5.
A static budget is an appropriate basis for evaluating a manager’s effectiveness in controlling
costs when:
(1) The actual level of activity closely approximates the master budget activity level and/or
(2) The behavior of the costs in response to changes in activity is fixed.
6.
Yes, this is true. A flexible budget is a series of static budgets at different levels of activity.
7.
The performance is unfavorable. The budgeted indirect labor cost in the static budget is $1.35 per
direct labor hour ($54,000 ÷ 40,000). At 45,000 direct labor hours, budgeted costs are $60,750
(45,000 X $1.35). Thus, indirect labor is $4,250 over budget ($65,000 – $60,750).
8.
The performance is favorable. Factory insurance is a fixed cost. At 50,000 direct labor hours, the
budgeted cost is still $6,500. Thus, factory insurance is $300 under budget ($6,500 – $6,200).
9.
The steps in preparing a flexible budget are:
(1) Identify the activity index and the relevant range of activity.
(2) Identify the variable costs and determine the budgeted variable cost per unit of activity for
each cost.
(3) Identify the fixed costs and determine the budgeted amount for each cost.
(4) Prepare the budget for selected increments of activity within the relevant range.
10.
Alou Company can say that total budgeted costs are $25,000 fixed plus $6 per direct labor hour
[($85,000 – $25,000) ÷ 10,000].
11.
(a) At 9,000 hours, total budgeted costs are $76,000, or [$40,000 + ($4 X 9,000)].
(b) At 12,345 hours, total budgeted costs are $89,380, or [$40,000 + ($4 X 12,345)].
24-6
Copyright © 2009 John Wiley & Sons, Inc.
Weygandt, Accounting Principles, 9/e, Solutions Manual
(For Instructor Use Only)
To download more slides, ebook, solutions and test bank, visit
Questions Chapter 24 (Continued)
12.
Management by exception means that top management’s review of a budget report is focused
either entirely or primarily on differences between actual results and planned objectives. The criteria
for identifying exceptions are materiality and controllability of the item.
13.
Responsibility accounting is a method of controlling operations that involves accumulating and
reporting costs (and revenues, where relevant) on the basis of the manager who has the authority
to make the day-to-day decisions about the items. The purpose of responsibility accounting is to
evaluate a manager’s performance on the basis of matters directly under that manager’s control.
14.
Ann should know that the following conditions contribute to the effective use of responsibility
accounting:
(1) Costs and revenues can be directly associated with the specific level of management
responsibility.
(2) The costs and revenues are controllable at the level of responsibility with which they are associated.
(3) Budget data can be developed for evaluating the manager’s effectiveness in controlling the
costs and revenues.
15.
A cost is controllable at a given level of managerial responsibility if the manager has the power to
incur the cost within a given period of time. Most costs incurred directly are controllable, whereas costs
incurred indirectly and allocated to a responsibility level are noncontrollable at that level.
16.
Responsibility reports differ from budget reports in two respects: (1) a distinction is made between
controllable and noncontrollable items and (2) performance reports either emphasize, or only include,
items controllable by the individual manager.
17.
Usually there is a relationship between a responsibility reporting system and a company’s organization
chart. In a responsibility reporting system, reports are prepared for each level of responsibility in
the organization chart.
18.
There are three types of responsibility centers:
(a) A cost center incurs costs (and expenses) but does not generate revenues.
(b) A profit center incurs costs (and expenses) and also generates revenues.
(c) An investment center incurs costs (and expenses), generates revenues, and controls the investment
funds available for use.
19.
(a) Only controllable costs are included in a performance report for a cost center.
(b) Variable and fixed costs are not identified in the report.
20.
Direct fixed costs relate specifically to one center and are incurred for the sole benefit of that
center. An indirect fixed cost relates to the company’s overall activities and is incurred for the
benefit of more than one profit center. Both types of fixed costs are controllable. A direct fixed
cost is controllable by a specific center manager and an indirect fixed cost is controllable by an
officer higher up in the organization.
21.
Controllable margin is contribution margin less controllable fixed costs in a profit center. The purpose
of controllable margin is to provide a basis for evaluating the manager’s effectiveness in controlling
revenues and costs.
Copyright © 2009 John Wiley & Sons, Inc.
Weygandt, Accounting Principles, 9/e, Solutions Manual
(For Instructor Use Only)
24-7
To download more slides, ebook, solutions and test bank, visit
Questions Chapter 24 (Continued)
22.
The primary basis for evaluating the performance of the manager of an investment center is
return on investment (ROI). The formula is: Controllable Margin divided by Average Operating Assets.
23.
ROI can be improved by: (1) increasing controllable margin and (2) reducing average operating
assets. Controllable margin can be increased by increasing sales or by reducing variable and
controllable fixed costs.
24.
(a) The manager being evaluated should have direct input into the process of establishing budget
goals and have the opportunity to respond to the evaluation.
(b) Top management should make the evaluation entirely on matters controllable by the manager,
and should fully support the evaluation process.
24-8
Copyright © 2009 John Wiley & Sons, Inc.
Weygandt, Accounting Principles, 9/e, Solutions Manual
(For Instructor Use Only)
To download more slides, ebook, solutions and test bank, visit
SOLUTIONS TO BRIEF EXERCISES
BRIEF EXERCISE 24-1
VOORHEES COMPANY
Sales Budget Report
For the Quarter Ended March 31, 2010
Product Line
Budget
Actual
Difference
Garden-Tools
$310,000
$304,000
$6,000 U
BRIEF EXERCISE 24-2
VOORHEES COMPANY
Sales Budget Report
For the Quarter Ended June 30, 2010
Product Line
Second Quarter
Budget
Actual Difference
Garden-Tools $380,000 $383,000
$3,000 F
Year to Date
Budget
Actual
Difference
$690,000 $687,000
$3,000 U
BRIEF EXERCISE 24-3
(a)
MUSSATTO COMPANY
Direct Labor Static Budget Report
For the Month Ended January 31, 2010
Direct Labor
(b)
Budget
$200,000
(10,000 X $20)
Actual
$203,000
Difference
$3,000 U
MUSSATTO COMPANY
Direct Labor Flexible Budget Report
For the Month Ended January 31, 2010
Budget
Direct Labor
$208,000
Copyright © 2009 John Wiley & Sons, Inc.
(10,400 X $20)
Actual
Difference
$203,000
$5,000 F
Weygandt, Accounting Principles, 9/e, Solutions Manual
(For Instructor Use Only)
24-9
To download more slides, ebook, solutions and test bank, visit
BRIEF EXERCISE 24-3 (Continued)
The static budget does not provide a proper basis for evaluating performance
because the budget is not based on the hours actually worked. In contrast,
the flexible budget provides the proper basis for evaluating performance
because the budget is based on the hours actually worked.
BRIEF EXERCISE 24-4
HANNON COMPANY
Monthly Manufacturing Flexible Budget
For the Year 2010
Activity level
Finished units
Variable costs
Direct materials ($4)
Direct labor ($6)
Overhead ($8)
Total variable costs ($18)
Fixed costs
Depreciation (1)
Supervision (2)
Total fixed costs
Total costs
(1)
(2)
24-10
80,000
100,000
120,000
$ 320,000
480,000
640,000
$1,440,000
$ 400,000
600,000
800,000
$1,800,000
$ 480,000
720,000
960,000
$2,160,000
200,000
100,000
300,000
$1,740,000
200,000
100,000
300,000
$2,100,000
200,000
100,000
300,000
$2,460,000
$2 X 1,200,000 ÷ 12
$1 X 1,200,000 ÷ 12
Copyright © 2009 John Wiley & Sons, Inc.
Weygandt, Accounting Principles, 9/e, Solutions Manual
(For Instructor Use Only)
To download more slides, ebook, solutions and test bank, visit
BRIEF EXERCISE 24-5
HANNON COMPANY
Manufacturing Flexible Budget Report
For the Month Ended March 31, 2010
Budget
Units produced
Variable costs
Direct materials
Direct labor
Overhead
Total variable costs
Fixed costs
Depreciation
Supervision
Total fixed costs
Total costs
Actual
Difference
Favorable F
Unfavorable U
100,000
100,000
$ 400,000
600,000
800,000
$1,800,000
$ 425,000
590,000
805,000
$1,820,000
$25,000 U
10,000 F
5,000 U
$20,000 U
200,000
100,000
300,000
$2,100,000
200,000
100,000
300,000
$2,120,000
–0–
–0–
–0–
$20,000 U
Costs were not entirely controlled as evidence by the difference between
budgeted and actual for the variable costs.
BRIEF EXERCISE 24-6
COBB COMPANY
Assembly Department
Responsibility Report
For the Month Ended April 30, 2010
Controllable Cost
Indirect materials
Indirect labor
Utilities
Supervision
Copyright © 2009 John Wiley & Sons, Inc.
Budget
$15,000
20,000
10,000
5,000
$50,000
Actual
Difference
$14,300
20,600
10,750
5,000
$50,650
Favorable F
Unfavorable U
$700 F
600 U
750 U
0U
$650 U
Weygandt, Accounting Principles, 9/e, Solutions Manual
(For Instructor Use Only)
24-11
To download more slides, ebook, solutions and test bank, visit
BRIEF EXERCISE 24-7
ECKERT MANUFACTURING COMPANY
Water Division
Responsibility Report
For the Year Ended December 31, 2010
Budget
Sales
Variable costs
Contribution margin
Controllable fixed costs
Controllable margin
$2,000,000
1,000,000
1,000,000
300,000
$ 700,000
Actual
Difference
$2,080,000
1,050,000
1,030,000
310,000
$ 720,000
Favorable F
Unfavorable U
$80,000 F
50,000 U
30,000 F
10,000 U
$20,000 F
BRIEF EXERCISE 24-8
KASPAR COMPANY
Plastics Division
Responsibility Report
For the Year Ended December 31, 2010
Budget
Contribution margin
Controllable fixed costs
Controllable margin
Return on investment
Actual
Difference
$700,000
300,000
$400,000
$715,000
309,000
$406,000
Favorable F
Unfavorable U
$15,000 F
9,000 U
$ 6,000 F
20%
20.3%
($400,000 ÷
$2,000,000)
($406,000 ÷
$2,000,000)
.3% F
($6,000 ÷
$2,000,000)
BRIEF EXERCISE 24-9
III
III
III
24-12
24% ($1,200,000 ÷ $5,000,000)
25% ($2,000,000 ÷ $8,000,000)
32% ($3,200,000 ÷ $10,000,000)
Copyright © 2009 John Wiley & Sons, Inc.
Weygandt, Accounting Principles, 9/e, Solutions Manual
(For Instructor Use Only)
To download more slides, ebook, solutions and test bank, visit
BRIEF EXERCISE 24-10
III
A $300,000 ($2,000,000 X .15) increase in sales will increase contribution
margin and controllable margin $225,000 ($300,000 X 75%). The new
ROI is 28.5% ($1,425,000 ÷ $5,000,000).
III
A decrease in costs results in a corresponding increase in controllable
margin. The new ROI is 27.5% ($2,200,000 ÷ $8,000,000).
III
A decrease in average operating assets reduces the denominator. The
new ROI is 33.3% ($3,200,000 ÷ $9,600,000).
SOLUTIONS FOR DO IT! REVIEW EXERCISES
DO IT! 24-1
Using the graph data, fixed costs are $90,000, and variable costs are $4 per
direct labor hour [($330,000 – $90,000) ÷ 60,000]. Thus, at 70,000 direct labor
hours, total budgeted costs are $370,000 [$90,000 + (70,000 X $4)].
DO IT! 24-2
Difference
Favorable F
Unfavorable U
Units produced
Budget
6,000 units
Actual
6,000 units
Variable costs
Direct materials
Direct labor
Overhead
Total variable costs
$ 42,000
72,000
108,000
222,000
$ 38,900
70,200
116,500
225,600
$3,100 F
1,800 F
8,500 U
3,600 U
Fixed costs
Depreciation
Supervision
Total fixed costs
Total costs
8,000
3,750
11,750
$233,750
8,000
4,000
12,000
$237,600
0
250 U
250 U
$3,850 U
Copyright © 2009 John Wiley & Sons, Inc.
Weygandt, Accounting Principles, 9/e, Solutions Manual
(For Instructor Use Only)
24-13
To download more slides, ebook, solutions and test bank, visit
DO IT! 24-2 (Continued)
The responsibility report indicates that actual overhead was 7.9% over
budget. This cost was not well-controlled and should be examined further.
The other variable costs came in under budget. The direct materials cost
was 7.4% under budget; Chickasaw should also investigate the cause of
this difference, even though it is favorable. Finally, Chickasaw also should
investigate the unfavorable difference in supervision (6.7%) to determine if
the budget amount is out-of-date.
DO IT! 24-3
DEEP SOUTH DIVISION
Responsibility Report
For the Year Ended December 31, 2010
Sales
Variable costs
Contribution margin
Controllable fixed costs
Controllable margin
Budget
$2,000,000
800,000
1,200,000
550,000
$ 650,000
Actual
$1,800,000
750,000
1,050,000
550,000
$ 500,000
Difference
Favorable F
Unfavorable U
$200,000 U
50,000 F
150,000 U
–0–
$150,000 U
DO IT! 24-4
(a)
Return on investment for 2010
Sales ...............................................................
Variable costs..............................................
Contribution margin ..................................
Controllable fixed costs...........................
Controllable margin...................................
Return on investment
$500,000
300,000
200,000
75,000
$125,000
$125,000
$450,000
=
27.8%
Expected return on investment for alternative 1:
$125,000
= 31.3%
$400,000
24-14
Copyright © 2009 John Wiley & Sons, Inc.
Weygandt, Accounting Principles, 9/e, Solutions Manual
(For Instructor Use Only)
To download more slides, ebook, solutions and test bank, visit
DO IT! 24-4 (Continued)
Expected return on investment for alternative 2:
Sales ($500,000 + 100,000) .............................
Variable costs
($300,000/500,000 X $600,000) ...................
Contribution margin .........................................
Controllable fixed costs ..................................
Controllable margin..........................................
Return on investment
Copyright © 2009 John Wiley & Sons, Inc.
$600,000
360,000
240,000
75,000
$165,000
$165,000
$450,000
Weygandt, Accounting Principles, 9/e, Solutions Manual
=
36.7%
(For Instructor Use Only)
24-15
To download more slides, ebook, solutions and test bank, visit
SOLUTIONS TO EXERCISES
EXERCISE 24-1
1.
2.
3.
4.
5.
6.
7.
8.
9.
10.
True.
False. Budget reports are prepared as frequently as needed.
True.
True.
False. Budgetary control works best when a company has a formalized
reporting system.
False. The primary recipients of the sales report are the sales manager
and top management.
True.
True.
False. Top management’s reaction to unfavorable differences is often
influenced by the materiality of the difference.
True.
EXERCISE 24-2
(a)
PARGO COMPANY
Selling Expense Report
For March
Month
January
February
March
Budget
$30,000
$35,000
$40,000
By Month
Actual
$31,000
$34,500
$47,000
Difference
$1,000 U
$ 500 F
$7,000 U
Year-to-Date
Budget
Actual
Difference
$ 30,000 $ 31,000
$1,000 U
$ 65,000 $ 65,500
$ 500 U
$105,000 $112,500
$7,500 U
(b)
The purpose of the Selling Expense Report is to help management
control selling expenses. The primary recipient is the sales manager.
(c)
Most likely, when management scrutinized the results for January and
February, they would determine that the difference was insignificant
(3.3% in January and 1.4% in February), and require no action. When
the March results are examined, however, the fact that the difference
is 17.5% of budget would probably cause management to investigate
further. As a result of their investigation, management would either
take corrective action or modify the amounts of budgeted selling expense
for future months to reflect changing conditions.
24-16
Copyright © 2009 John Wiley & Sons, Inc.
Weygandt, Accounting Principles, 9/e, Solutions Manual
(For Instructor Use Only)
To download more slides, ebook, solutions and test bank, visit
EXERCISE 24-3
RANEY COMPANY
Monthly Manufacturing Overhead Flexible Budget
For the Year 2010
Activity level
Direct labor hours
Variable costs
Indirect labor ($1)
Indirect materials ($.50)
Utilities ($.40)
Total variable costs ($1.90)
Fixed costs
Supervision
Depreciation
Property taxes
Total fixed costs
Total costs
7,000
8,000
9,000
10,000
$ 7,000
3,500
2,800
13,300
$ 8,000
4,000
3,200
15,200
$ 9,000
4,500
3,600
17,100
$10,000
5,000
4,000
19,000
4,000
1,500
800
6,300
$19,600
4,000
1,500
800
6,300
$21,500
4,000
1,500
800
6,300
$23,400
4,000
1,500
800
6,300
$25,300
EXERCISE 24-4
(a)
RANEY COMPANY
Manufacturing Overhead Flexible Budget Report
For the Month Ended July 31, 2010
Direct labor hours (DLH)
Variable costs
Indirect labor
Indirect materials
Utilities
Total variable costs
Fixed costs
Supervision
Depreciation
Property taxes
Total fixed costs
Total costs
Copyright © 2009 John Wiley & Sons, Inc.
Budget at
9,000 DLH
Actual Costs
9,000 DLH
Difference
Favorable F
Unfavorable U
$ 9,000
4,500
3,600
17,100
$ 8,700
4,300
3,200
16,200
$300 F
200 F
400 F
900 F
4,000
1,500
800
6,300
$23,400
4,000
1,500
800
6,300
$22,500
—
—
—
—
$900 F
Weygandt, Accounting Principles, 9/e, Solutions Manual
(For Instructor Use Only)
24-17
To download more slides, ebook, solutions and test bank, visit
EXERCISE 24-4 (Continued)
(b)
RANEY COMPANY
Manufacturing Overhead Flexible Budget Report
For the Month Ended July 31, 2010
Direct labor hours (DLH)
Variable costs
Indirect labor
Indirect materials
Utilities
Total variable costs
Fixed costs
Supervision
Depreciation
Property taxes
Total fixed costs
Total costs
Budget at
8,500 DLH
Actual Costs
8,500 DLH
Difference
Favorable F
Unfavorable U
$ 8,500
4,250
3,400
16,150
$ 8,700
4,300
3,200
16,200
$200 U
50 U
200 F
50 U
4,000
1,500
800
6,300
$22,450
4,000
1,500
800
6,300
$22,500
—
—
—
—
$ 50 U
(c) In case (a) the performance for the month was satisfactory. In case
(b) management may need to determine the causes of the unfavorable
differences for indirect labor and indirect materials, or since the differences
are small, 2.4% of budgeted cost for indirect labor and 1.2% for indirect
materials, they might be considered immaterial.
24-18
Copyright © 2009 John Wiley & Sons, Inc.
Weygandt, Accounting Principles, 9/e, Solutions Manual
(For Instructor Use Only)
To download more slides, ebook, solutions and test bank, visit
EXERCISE 24-5
TRUSLER COMPANY
Monthly Selling Expense Flexible Budget
For the Year 2010
Activity level
Sales
Variable expenses
Sales commissions (5%)
Advertising (4%)
Traveling (3%)
Delivery (2%)
Total variable
expenses (14%)
Fixed expenses
Sales salaries
Depreciation
Insurance
Total fixed expenses
Total expenses
$170,000
$180,000
$190,000
$200,000
$
$
$
9,500
7,600
5,700
3,800
$ 10,000
8,000
6,000
4,000
8,500
6,800
5,100
3,400
9,000
7,200
5,400
3,600
23,800
25,200
26,600
28,000
34,000
7,000
1,000
42,000
$ 65,800
34,000
7,000
1,000
42,000
$ 67,200
34,000
7,000
1,000
42,000
$ 68,600
34,000
7,000
1,000
42,000
$ 70,000
EXERCISE 24-6
(a)
TRUSLER COMPANY
Selling Expense Flexible Budget Report
For the Month Ended March 31, 2010
Sales
Variable expenses
Sales commissions
Advertising
Travel
Delivery
Total variable expenses
Fixed expenses
Sales salaries
Depreciation
Insurance
Total fixed expenses
Total expenses
Copyright © 2009 John Wiley & Sons, Inc.
Budget
$170,000
Actual
$170,000
$
$
8,500
6,800
5,100
3,400
23,800
34,000
7,000
1,000
42,000
$ 65,800
Difference
Favorable F
Unfavorable U
9,200
7,000
5,100
3,500
24,800
$ 700 U
200 U
0U
100 U
1,000 U
34,000
7,000
1,000
42,000
$ 66,800
0U
0U
0U
0U
$1,000 U
Weygandt, Accounting Principles, 9/e, Solutions Manual
(For Instructor Use Only)
24-19
To download more slides, ebook, solutions and test bank, visit
EXERCISE 24-6 (Continued)
(b)
TRUSLER COMPANY
Selling Expense Flexible Budget Report
For the Month Ended March 31, 2010
Sales
Variable expenses
Sales commissions
Advertising
Travel
Delivery
Total variable
expenses
Fixed costs
Sales salaries
Depreciation
Insurance
Total fixed expenses
Total expenses
Budget
$180,000
Actual
$180,000
$
$
9,000
7,200
5,400
3,600
Difference
Favorable F
Unfavorable U
9,200
7,000
5,100
3,500
$200 U
200 F
300 F
100 F
25,200
24,800
400 F
34,000
7,000
1,000
42,000
$ 67,200
34,000
7,000
1,000
42,000
$ 66,800
0U
0U
0U
0U
$400 F
(c) Flexible budgets are essential in evaluating a manager’s performance
in controlling variable expenses because the budget allowance varies
directly with changes in the activity index. At $170,000 of sales, the
manager was over budget (unfavorable) by $1,000 but at $180,000 of
sales, the manager was under budget (favorable) by $400.
24-20
Copyright © 2009 John Wiley & Sons, Inc.
Weygandt, Accounting Principles, 9/e, Solutions Manual
(For Instructor Use Only)
To download more slides, ebook, solutions and test bank, visit
EXERCISE 24-7
(a)
PLETCHER COMPANY
Manufacturing Overhead Flexible Budget Report
For the Quarter Ended March 31, 2010
Variable costs
Indirect materials
Indirect labor
Utilities
Maintenance
Total variable costs
Fixed costs
Supervisory salaries
Depreciation
Property taxes and
insurance
Maintenance
Total fixed costs
Total costs
(b)
Budget
Actual
Difference
Favorable F
Unfavorable U
$12,000
10,000
8,000
6,000
36,000
$13,800
9,600
8,700
4,900
37,000
$1,800 U
400 F
700 U
1,100 F
1,000 U
36,000
7,000
36,000
7,000
0U
0U
8,000
5,000
56,000
$92,000
8,200
5,000
56,200
$93,200
200 U
0U
200 U
$1,200 U
PLETCHER COMPANY
Responsibility Report
For the Quarter Ended March 31, 2010
Controllable Costs
Indirect materials
Indirect labor
Utilities
Maintenance*
Supervisory salaries
Budget
Actual
Difference
Favorable F
Unfavorable U
$12,000
10,000
8,000
11,000
36,000
$77,000
$13,800
9,600
8,700
9,900
36,000
$78,000
$1,800 U
400 F
700 U
1,100 F
0U
$1,000 U
*Includes variable and fixed costs
Copyright © 2009 John Wiley & Sons, Inc.
Weygandt, Accounting Principles, 9/e, Solutions Manual
(For Instructor Use Only)
24-21
To download more slides, ebook, solutions and test bank, visit
EXERCISE 24-8
(a)
GARBER COMPANY
Selling Expense Flexible Budget Report
Clothing Department
For the Month Ended October 31, 2010
Sales in units
Variable expenses
Sales commissions ($.25)
Advertising expense ($.10)
Travel expense ($.45)
Free samples ($.20)
Total variable
expenses ($1.00)
Fixed expenses
Rent
Sales salaries
Office salaries
Depreciation—salesmen autos
Total fixed expenses
Total expenses
Budget
10,000
Actual
10,000
Difference
Favorable F
Unfavorable U
$ 2,500
1,000
4,500
2,000
$ 2,600
850
4,000
1,300
$ 100 U
150 F
500 F
700 F
10,000
8,750
1,250 F
1,500
1,200
800
500
4,000
$14,000
1,500
1,200
800
500
4,000
$12,750
0U
0U
0U
0
0U
$1,250 F
(b) Terry should not have been reprimanded. As shown in the flexible budget
report, variable costs were $1,250 below budget.
24-22
Copyright © 2009 John Wiley & Sons, Inc.
Weygandt, Accounting Principles, 9/e, Solutions Manual
(For Instructor Use Only)
To download more slides, ebook, solutions and test bank, visit
EXERCISE 24-9
(a)
PRONTO PLUMBING COMPANY
Home Plumbing Services Segment
Responsibility Report
For the Quarter Ended March 31, 2010
Service revenue
Variable costs:
Material and supplies
Wages
Gas and oil
Total variable costs
Contribution margin
Controllable fixed costs:
Supervisory salaries
Insurance
Equipment depreciation
Total controllable fixed costs
Controllable margin
Budget
Actual
Difference
Favorable F
Unfavorable U
$25,000
$26,000
$1,000 F
1,500
3,000
2,700
7,200
17,800
1,200
3,300
3,400
7,900
18,100
300 F
300 U
700 U
700 U
300 F
9,000
4,000
1,600
14,600
$ 3,200
9,400
3,500
1,300
14,200
$ 3,900
400 U
500 F
300 F
400 F
$ 700 F
(b)
MEMO
TO: Paul Pronto
FROM: Student
SUBJECT: The Reporting Principles of Performance Reports
When evaluating the performance of a company’s segments, the performance
reports should:
1.
2.
3.
4.
5.
Contain only data that are controllable by the segment’s manager.
Provide accurate and reliable budget data to measure performance.
Highlight significant differences between actual results and budget
goals.
Be tailor-made for the intended evaluation.
Be prepared at reasonable intervals.
I hope these suggested guidelines will be helpful in establishing the performance
reporting system to be used by Pronto Plumbing Company.
Copyright © 2009 John Wiley & Sons, Inc.
Weygandt, Accounting Principles, 9/e, Solutions Manual
(For Instructor Use Only)
24-23
To download more slides, ebook, solutions and test bank, visit
EXERCISE 24-10
(a) Fabricating Department = $40,000 fixed costs plus total variable costs
of $2.20 per direct labor hour [($150,000 –
$40,000) ÷ 50,000].
Assembling Department = $30,000 fixed costs plus total variable costs
of $1.60 per direct labor hour [($110,000 –
$30,000) ÷ 50,000].
(b) Fabricating Department = $40,000 + ($2.20 X 53,000) = $156,600.
Assembling Department = $30,000 + ($1.60 X 47,000) = $105,200.
(c)
$300
Total
Budgeted
Cost Line
250
Costs in (000)
200
Budgeted
Variable
Costs
150
100
50
Budgeted
Fixed Costs
40
0
10
20
30
40
50
60
70
80
90 100
Direct Labor Hours in (000)
24-24
Copyright © 2009 John Wiley & Sons, Inc.
Weygandt, Accounting Principles, 9/e, Solutions Manual
(For Instructor Use Only)
To download more slides, ebook, solutions and test bank, visit
EXERCISE 24-11
(a) To Dallas Department Manager—Finishing
Controllable Costs:
Direct Materials
Direct Labor
Manufacturing Overhead
Total
Budget
$ 45,000
82,000
49,200
$176,200
Month: July
Actual
$ 41,500
83,000
51,000
$175,500
(b) To Assembly Plant Manager—Dallas
Controllable Costs:
Dallas Office
Departments:
Machining
Finishing
Total
Month: July
Budget
$ 92,000
Actual
$ 95,000
Fav/Unfav
$3,000 U
216,000
176,200
$484,200
220,000
175,500
$490,500
4,000 U
700 F
$6,300 U
(c) To Vice President—Production
Controllable Costs:
V P Production
Assembly plants:
Atlanta
Dallas
Tucson
Total
Copyright © 2009 John Wiley & Sons, Inc.
Fav/Unfav
$3,500 F
1,000 U
1,800 U
$ 700 F
Month: July
Budget
$ 130,000
Actual
$ 132,000
Fav/Unfav
$2,000 U
421,000
484,200
496,500
$1,531,700
424,000
490,500
494,000
$1,540,500
3,000 U
6,300 U
2,500 F
$8,800 U
Weygandt, Accounting Principles, 9/e, Solutions Manual
(For Instructor Use Only)
24-25