Solution manual cost acounting 14e by carter ch03
Bạn đang xem bản rút gọn của tài liệu. Xem và tải ngay bản đầy đủ của tài liệu tại đây (221.65 KB, 36 trang )
To download more slides, ebook, solutions and test bank, visit
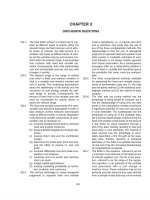
CHAPTER 3
DISCUSSION QUESTIONS
Q3-1.
Q3-2.
Q3-3.
Q3-4.
The total dollar amount of a fixed cost is constant at different levels of activity within the
relevant range, but fixed cost per unit of activity varies. In contrast, the total amount of a
variable cost varies at different levels of activity, but the variable cost per unit remains constant within the relevant range. A semivariable
cost contains both fixed and variable elements. Consequently, both total semivariable
cost and semivariable cost per unit vary with
changes in activity.
The relevant range is the range of activity
over which a fixed cost remains constant in
total or a variable cost remains constant per
unit of activity. The underlying assumptions
about the relationship of the activity and the
incurrence of cost change outside the relevant range of activity. Consequently, the
amount of fixed cost or the variable cost rate
must be recomputed for activity above or
below the relevant range.
The fixed and variable components of a semivariable cost should be segregated in order to
plan, analyze, control, measure, and evaluate
costs at different levels of activity. Separation
of the fixed and variable components of semivariable cost is necessary to:
(a) compute predetermined factory overhead
rates and analyze variances;
(b) prepare flexible budgets and analyze variances;
(c) analyze direct cost and the contribution
margin;
(d) determine the break-even point and analyze the effect of volume on cost and
profit;
(e) compute differential cost and make comparative cost analyses;
(f) maximize short-run profits and minimize
short-run costs;
(g) budget capital expenditures;
(h) analyze marketing profitability by territories, products, and customers.
The obvious advantage to using managerial
judgement to separate fixed and variable
3-1
Q3-5.
Q3-6.
Q3-7.
costs is expediency, i.e., it requires less time
and is, therefore, less costly than the use of
any of the three computational methods. The
disadvantage is that the use of managerial
judgment to separate fixed and variable costs
often results in unreliable estimates of cost.
Cost behavior is not always readily apparent
from casual observation. As a consequence,
managers often err in determining whether a
cost is fixed or variable and frequently ignore
the possibility that some costs are semivariable.
The three computational methods available
for separating the fixed and variable components of semivariable costs are: (1) the high
and low points method; (2) the statistical scattergraph method; and (3) the method of least
squares.
The high and low points method has the
advantage of being simple to compute, but it
has the disadvantage of using only two data
points in the computation, thereby resulting in
a significant potential for bias and inaccuracy
in cost estimates. The scattergraph has the
advantage of using all of the available data,
but it has the disadvantage of determining the
fixed and variable components on the basis of
a line drawn by visual inspection through a
plot of the data, thereby resulting in bias and
inaccuracy in cost estimates. The method of
least squares has the advantage of accurately describing a line through all the available data, thereby resulting in unbiased
estimates of the fixed and variable elements
of cost, but it has the increased disadvantage
of computational complexity.
The $200 in the equation, referred to as the
y intercept, is an estimate of the fixed portion
of indirect supplies cost. The $4 in the equation, referred to as the slope of the regression equation, is an estimate of the variable
cost associated with a unit change in
machine hours. These estimates may not be
perfectly accurate because they were derived
from a sample of data that may not be entirely
To download more slides, ebook, solutions and test bank, visit
3-2
Q3-8.
Q3-9.
Chapter 3
representative of the universe population,
and because activities not included in the
regression equation may have some influence on the cost being predicted.
The coefficient of correlation, denoted r, is a
measure of the extent to which two variables
are related linearly. It is a measure of the
covariation of the dependent and independent variables, and its sign indicates whether
the independent variable has a positive or
negative relationship to the dependent variable. The coefficient of determination is the
square of the coefficient of correlation and is
denoted r 2. The coefficient of determination is
a more easily interpreted measure of the
covariation than is the coefficient of correlation, because it represents the percentage of
variation in the dependent variable explained
by the independent variable.
The standard error of the estimate is defined
as the standard deviation about the regression line. It is essentially a measure of the
variability of the actual observations of the
dependent variable from the points predicted
on the regression line. A small value for the
standard error of the estimate indicates a
good fit. A standard error of zero would indicate a perfect fit, i.e., all actual observations
would be on the regression fine.
Q3-10. Heteroscedasticity means that the distribution
of observations around the regression line is
not uniform for all values of the independent
variable. If heteroscedasticity is present, the
standard error of the estimate and confidence
interval estimates, based on the standard
error, are unreliable measures.
Q3-11. Serial correlation means that rather than
being random, the observations around the
regression line are correlated with one
another. If serial correlation is present, the
standard error of the estimate and confidence
interval estimates, based on the standard
error, are unreliable measures.
Q3-12. Multicollinearity means that two or more of
the independent variables in a multiple
regression analysis are correlated with one
another. When the degree of multicollinearity
is high, the relationship between one or more
of the correlated independent variables and
the dependent variable may be obscured.
However, this circumstance would normally
not affect the estimate of cost.
To download more slides, ebook, solutions and test bank, visit
Chapter 3
3-3
EXERCISES
E3-1
Activity Level
High............................................ 2,600 hours
Low............................................. 2,100
Difference ..................................
500 hours
Cost
$1,300
1,100
$ 200
Variable rate: $200 ÷ 500 machine hours = $.40 per machine hour
High
$1,300
Low
$1,100
Total cost ...................................
Variable cost:
$.40 × 2,600 hours........
1,040
$.40 × 2,100 hours........
Fixed cost.................................. $ 260
840
$ 260
E3-2
$1,000
$900
SUPPLIES COST
$800
$700
$600
$500
$400
$300
$200
$100
$0
0
200
400
600
DIRECT LABOR HOURS
Average cost ($7,575 total ÷ 10 months)....................
Fixed cost per month ...................................................
$757.50
350.00
Average total variable cost ..........................................
$407.50
$407.50 average total variable cost
5,875 total direct labor hours ÷ 10 months
=
$.6936 variable cost
per direct labor hour
800
To download more slides, ebook, solutions and test bank, visit
3-4
Chapter 3
E3-3
Σ( x i − x )(y i − y ) 87, 000
=
= $60
Σ( x i − x )2
1, 450
a = y– – bx– = $10,000 – ($60 × 125) = $2,500
Travel and entertainment expense for 200 sales calls would be:
yi = a + bxi = $2,500 + ($60 × 200 calls) = $14,500
b=
E3-4
(1)
y
Electricity
Cost
Month
January...... $1,600
February .... 1,510
March ......... 1,500
April ........... 1,450
May............. 1,460
June ........... 1,520
July ............ 1,570
August ....... 1,530
September . 1,480
October...... 1,470
November .. 1,450
December .. 1,460
Total
$18,000
(2)
–)
(y – y
Cost
Deviation
100
10
0
(50)
(40)
20
70
30
(20)
(30)
(50)
(40)
0
(3)
x
Machine
Hours
2,790
2,680
2,600
2,500
2,510
2,610
2,750
2,700
2,530
2,520
2,490
2,520
31,200
(4)
(x – x–)
Activity
Deviation
190
80
0
(100)
(90)
10
150
100
(70)
(80)
(110)
(80)
0
(5)
(x – x–)2
(6)
–
–)
(x – x )(y – y
(4) Squared
36,100
6,400
0
10,000
8,100
100
22,500
10,000
4,900
6,400
12,100
6,400
123,000
(4) × (2)
19,000
800
0
5,000
3,600
200
10,500
3,000
1,400
2,400
5,500
3,200
54,600
–
y = Σy = n = $18,000 ÷ 12 = $1,500
x– = Σx = n = 31,200 ÷ 12 = 2,600
54, 600
Σ( x − x )(y − y ) Column 6 total
=
= $.44
=
2
Σ( x − x )
Column 5 total 123, 000
– – bx–
Fixed cost (a) = y
= $1,500 – ($.44)(2,600)
= $356
Variable rate (b ) =
To download more slides, ebook, solutions and test bank, visit
Chapter 3
3-5
E3-5
r=
Σ( x i − x )(y i − y )
Σ( x i − x )2 Σ(y i − y )2
=
1, 564
(850) (3, 400)
= .92
r 2 = (.92)2 − .8464
E3-6
(1)
y
Shipping
Month
Expense
January ..... $ 560
February....
600
March ........
600
April...........
580
May ............
570
June...........
550
July ............
590
August.......
610
September
650
October .....
620
November .
630
December..
640
Total....... $7,200
(2)
–)
(y – y
Expense
Deviations
(40)
0
0
(20)
(30)
(50)
(10)
10
50
20
30
40
0
(3)
x
Sales
Revenue
$26,500
30,000
29,000
28,000
27,000
25,500
30,000
33,000
35,000
32,000
30,500
33,500
$360,000
(4)
(x – x–)
Activity
Deviations
(3,500)
0
(1,000)
(2,000)
(3,000)
(4,500)
0
3,000
5,000
2,000
500
3,500
0
(5)
(x – x–)2
(6)
–)
(x – x–)(y – y
(7)
–)2
(y – y
(4) Squared
12,250,000
0
1,000,000
4,000,000
9,000,000
20,250,000
0
9,000,000
25,000,000
4,000,000
250,000
12,250,000
(4) × (2)
140,000
0
0
40,000
90,000
225,000
0
30,000
250,000
40,000
15,000
140,000
(2) Squared
1,600
0
0
400
900
2,500
100
100
2,500
400
900
1,600
97,000,000
970,000
y = Σy ÷ n = $7, 200 ÷ 12 = $600
x = Σx ÷ n = $360, 000 ÷ 12 = $30, 000
Σ( x − x )(y − y )
970, 000
r=
=
= .939
2
2
(97, 000, 000) (11, 000)
Σ( x i − x ) Σ(y i − y )
39)2 = .882
r 2 = (.93
11,000
To download more slides, ebook, solutions and test bank, visit
3-6
Chapter 3
E3-7
(1)
r=
Σ( x i − x )(y i − y )
=
Σ( x i − x )2 Σ(y i − y )2
2, 400
= .96
(6, 250) (1, 000)
r 2 = (.96)2 = .9216
(2)
(3)
b=
Σ( x i − x )(y i − y ) 2, 400
variable maintenance
=
= $.384
2
cost
per machine ho
our
Σ( x i − x )
6, 250
y = Σy i ÷ n = $50, 000 ÷ 10 = $5, 000
x = Σx i ÷ n = 40, 000 ÷ 10 = 4, 000 hours
Since y = a + bx , then :
a = y − bx
a = $5, 000 − ($.384 )(4, 000)
a = $5, 000 − $1, 536
a = $3, 464
E3-8
(1)
For electricity cost and direct labor hours:
r=
Σ( x i − x )(y i − y )
Σ( x i − x ) Σ(y i − y )
2
2
=
5, 700
5, 700
= .9497
=
(28, 500) (1, 264 ) 6, 002
r 2 = (.9497 )2 = .9019
(2)
For electricity cost and machine hours:
r=
Σ( x i − x )(y i − y )
Σ( x i − x )2 Σ(y i − y )2
=
7, 000
7, 000
= .8805
=
(50, 000) (1, 264 ) 7, 950
r 2 = (.8805)2 = .7753
(3)
In this case, direct labor hours should be chosen as the appropriate activity
measure to be used in predicting electricity cost because the coefficient of
determination (r2 = .9019) is higher than that for machine hours (r2 = .7753).
To download more slides, ebook, solutions and test bank, visit
Chapter 3
3-7
E3-8 (Concluded)
(4)
b=
Σ( x i − x )(y i − y )
5, 700
variable ellectricity
=
= $.20
2
cost rate
Σ( x i − x )
28, 500
Since y = a + bx and y = Σy i ÷ n and x = Σx i ÷ n, then :
a = ( Σy i ÷ n ) − b ( Σx i ÷ n )
42, 000 ÷ 20) − (.20)(180, 000 ÷ 20)
a = (4
a = 2, 100 − (.20)(9, 000)
a = 2, 100 − 1, 800 = $300 fixed electricity cost
E3-9
(1)
xi
Month
January ..................
February ................
March .....................
April........................
May .........................
June........................
July.........................
August....................
September .............
October ..................
November ..............
December ..............
Total....................
s′=
Labor
Hours
2,650
3,000
2,900
2,800
2,700
2,550
3,000
3,300
3,500
3,200
3,050
3,350
36,000
(2)
yi
Actual
Utility
Cost
$ 3,600
4,000
4,000
3,800
3,700
3,500
3,900
4,100
4,500
4,200
4,300
4,400
$48,000
(3)
(4)
(5)
(y′′i = a + bxi) (yi – y′′i)
(yi – y′′i)2
Predicted Prediction
Utility
Error
(4)
Cost
(2) – (3)
Squared
$ 3,650
(50)
$2,500
4,000
0
0
3,900
100
10,000
3,800
0
0
3,700
0
0
3,550
(50)
2,500
4,000
(100)
10,000
4,300
(200)
40,000
4,500
0
0
4,200
0
0
4,050
250
62,500
4,350
50
2,500
$48,000
0
$130,000
Σ(y i − y i′ )2
Column 5 total
$130, 000
=
=
= $114.018
12 − 2
10
n −2
To download more slides, ebook, solutions and test bank, visit
3-8
Chapter 3
E3-10
s′=
Σ(y i − y ′i )2
$49, 972
=
= 3, 844 = $62
15 − 2
n −2
The 90 percent confidence interval estimate at the 1,500-hour level of activity
would be:
y ′i ± t 90% s′ 1+
( x i − x )2
1
+
n Σ( x i − x )2
$500 ± (1.771)($62) 1+
1 (1, 500 − 1, 300)2
+
150, 000
15
$500 ± (1.771)($62) 1.3333
$500 ± (1.771)($62) (1
1.1547 )
$500 ± $126.79
To download more slides, ebook, solutions and test bank, visit
Chapter 3
3-9
PROBLEMS
P3-1
(1)
Coefficient of correlation and coefficient of determination between:
(a) Travel expenses and the number of calls made:
(1)
y
Travel
Expense
Month
January............
February ..........
March ...............
April .................
May ..................
June .................
July ..................
August .............
September.......
October............
November ........
December ........
Total
r=
r=
r=
(2)
–)
(y – y
Expense
Deviations
(3)
x
Calls
Made
$ 3,000
3,200
2,800
3,400
3,100
3,200
2,900
3,300
3,500
3,400
3,200
3,400
(200)
0
(400)
200
(100)
0
(300)
100
300
200
0
200
410
420
380
460
430
450
390
470
480
490
440
460
$38,400
0
5,280
Σ( x i − x )(y i − y )
Σ( x i − x )2 Σ(y i − y )2
=
(4)
(x – x–)
Activity
Deviations
(30)
(20)
(60)
20
(10)
10
(50)
30
40
50
0
20
r 2 = .8957
(6)
–
–)
(x – x )(y – y
(7)
–)2
(y – y
(4) Squared
(4) × (2)
(2) Squared
900
400
3,600
400
100
100
2,500
900
1,600
2,500
0
400
6,000
0
24,000
4,000
1,000
0
15,000
3,000
12,000
10,000
0
4,000
40,000
0
160,000
40,000
10,000
0
90,000
10,000
90,000
40,000
0
40,000
13,400
79,000
520,000
Column 6 total
(Column 5 total) (Column 7 total)
79, 000
79, 000
=
00
(13, 400)(520, 000)
6, 968, 000, 00
79, 000
= .9464
83, 475
0
(5)
(x – x–)2
To download more slides, ebook, solutions and test bank, visit
3-10
Chapter 3
P3-1 (Concluded)
(b)
Travel expenses and orders received:
Month
January............
February .........
March ...............
April .................
May ..................
June .................
July ..................
August .............
September.......
October............
November ........
December ........
(1)
y
Travel
Expense
$ 3,000
3,200
2,800
3,400
3,100
3,200
2,900
3,300
3,500
3,400
3,200
3,400
Total ............
$38,400
r=
=
=
(2)
(3)
(4)
–
(y – y )
x
(x – x–)
Expense
Orders
Activity
Deviations Received Deviations
(200)
$53,000 (13,000)
0
65,000
(1,000)
(400)
48,000 (18,000)
200
73,000
7,000
(100)
62,000
(4,000)
0
67,000
1,000
(300)
60,000
(6,000)
100
76,000
10,000
300
82,000
16,000
200
62,000
(4,000)
0
64,000
(2,000)
200
80,000
14,000
0
$792,000
Σ( x i − x )(y i − y )
Σ( x i − x ) Σ(y i − y )
2
2
=
0
(5)
(x – x–)2
(4) Squared
169,000,000
1,000,000
324,000,000
49,000,000
16,000,000
1,000,000
36,000,000
100,000,000
256,000,000
16,000,000
4,000,000
196,000,000
1,168,000,000
(6)
(7)
–
–
–)2
(x – x )(y – y ) (y – y
(4) × (2) (2) Squared
2,600,000
40,000
0
0
7,200,000 160,000
1,400,000
40,000
400,000
10,000
0
0
1,800,000
90,000
1,000,000
10,000
4,800,000
90,000
(800,000) 40,000
0
0
2,800,000
40,000
21,200,000
520,000
Column 6 total
(Column 5 total) (Column 7 total)
21, 200, 000
21, 200, 000
=
607, 360, 000, 000, 000
(1, 168, 000, 000)(520, 000)
21, 000, 000
= .8602
24, 644, 675
r 2 = .7399
(2)
Perfect direct correlation would be evidenced by a correlation coefficient of one.
The coefficient of .9464 revealed in (1)(a) is closer to one than the coefficient of
.8602 in (1)(b). This means that the variable portion of travel expense varies more
directly with movements in the number of calls made than with the value of orders
received. To explain this further, the relative coefficients of determination are
obtained by squaring the coefficients of correlation and expressing the answer
as a percentage in each case. The coefficients of determination are 89.57% for
calls made and only 73.99% for orders received. This means that approximately
90% of the movements in the variable portion of travel expense are related to fluctuations in the number of calls made, and the remaining 10% of the movements
are related to other factors.
To download more slides, ebook, solutions and test bank, visit
Chapter 3
3-11
P3-2
(1)
Month
January............
February ..........
March ...............
April ................
May ..................
June .................
July ..................
August .............
September.......
October............
November ........
December ........
(1)
y
Supplies
Cost
$ 1,505
1,395
1,565
1,515
1,445
1,415
1,465
1,505
1,575
1,535
1,500
1,580
(2)
–)
(y – y
Cost
Deviations
5
(105)
65
15
(55)
(85)
(35)
5
75
35
0
80
Total ............. $18,000
0
(3)
x
Labor
Hours
5,000
4,600
5,160
5,100
4,830
4,750
4,900
5,080
5,200
5,130
4,950
5,300
60,000
(4)
(x – x–)
Activity
Deviations
0
(400)
160
100
(170)
(250)
(100)
80
200
130
(50)
300
0
(5)
(x – x–)2
(4) Squared
0
160,000
25,600
10,000
28,900
62,500
10,000
6,400
40,000
16,900
2,500
90,000
452,800
y = Σy ÷ n = $18, 000 ÷ 12 = $1, 500
x = Σx ÷ n = $60, 000 ÷ 12 = $5, 000
r=
Σ( x − x )(y − y )
Σ( x − x )2 Σ(y − y )2
r 2 = (.977 )2 = .955
=
131, 950
= .977
(452, 800) (40, 250)
(6)
(7)
–
–
–)2
(x – x )(y – y ) (y – y
(4) × (2)
0
42,000
10,400
1,500
9,350
21,250
3,500
400
15,000
4,550
0
24,000
131,950
(2) Squared
25
11,025
4,225
225
3,025
7,225
1,225
25
5,625
1,225
0
6,400
40,250
To download more slides, ebook, solutions and test bank, visit
3-12
Chapter 3
P3-2 (Concluded)
Month
January............
February ..........
March ...............
April .................
May ..................
June .................
July ..................
August .............
September.......
October............
November ........
December ........
(1)
y
Supplies
Cost
$ 1,505
1,395
1,565
1,515
1,445
1,415
1,465
1,505
1,575
1,535
1,500
1,580
(2)
–)
(y – y
Cost
Deviations
5
(105)
65
15
(55)
(85)
(35)
5
75
35
0
80
Total ............ $18,000
0
(3)
(4)
x
(x – x–)
Machine Activity
Hours Deviations
2,000
(50)
1,990
(60)
2,140
90
2,080
30
1,960
(90)
1,940
(110)
2,020
(30)
1,990
(60)
2,140
90
2,050
0
2,030
(20)
2,260
210
24,600
0
(5)
(x – x–)2
(4) Squared
2,500
3,600
8,100
900
8,100
12,100
900
3,600
8,100
0
400
44,100
92,400
(6)
(7)
–) (y – y–)2
(x – x–)(y – y
(4) × (2)
(250)
6,300
5,850
450
4,950
9,350
1,050
(300)
6,750
0
0
16,800
(2) Squared
25
11,025
4,225
225
3,025
7,225
1,225
25
5,625
1,225
0
6,400
50,950
40,250
y = Σy ÷ n = $18, 000 ÷ 12 = $1, 500
x = Σx ÷ n = $24, 600 ÷ 12 = 2, 050
Σ( x − x )(y − y )
50, 950
r=
=
= .835
(92, 400) (40, 250)
Σ( x − x )2 Σ(y − y )2
r 2 = (.835)2 = .69
97
(2)
Since the coefficient of determination for supplies cost and labor hours (r 2 = .955)
is greater than the coefficient of determination for supplies cost and machine
hours (r 2 = .697), labor hours should be used as the basis for estimating supplies
cost. Labor hours explain more of the variance in supplies cost than do machine
hours.
(3)
With labor hours as the basis for predicting supplies cost, the fixed cost and the
variable cost rate can be determined by the method of least squares as follows:
Σ( x − x )(y − y ) Column 6 total 131, 950
=
= $.29141
=
Σ( x − x )2
Column 5 total 452, 800
= y − bx
Variable rate (b ) =
Fixed cost (a )
= $1, 500 − ($.29141)(5, 000)
= $42.95
To download more slides, ebook, solutions and test bank, visit
Chapter 3
3-13
P3-3
Month
January............
February ..........
March ...............
April .................
May ..................
June .................
July ..................
August .............
September.......
October............
November ........
December ........
(1)
y
Electricity
Cost
$1,600
1,570
1,610
1,550
1,530
1,540
1,520
1,530
1,580
1,650
1,660
1,620
(2)
–)
(y – y
Cost
Deviations
20
(10)
30
(30)
(50)
(40)
(60)
(50)
0
70
80
40
Total ............. $18,960
0
(3)
x
Labor
Hours
4,200
4,000
4,360
4,000
4,050
4,100
4,150
4,250
4,150
4,500
4,600
4,400
50,760
(4)
(x – x–)
Activity
Deviations
(30)
(230)
130
(230)
(180)
(130)
(80)
20
(80)
270
370
170
0
(5)
(x – x–)2
(4) Squared
900
52,900
16,900
52,900
32,400
16,900
6,400
400
6,400
72,900
136,900
28,900
(4) × (2)
(600)
2,300
3,900
6,900
9,000
5,200
4,800
(1,000)
0
18,900
29,600
6,800
(2) Squared
400
100
900
900
2,500
1,600
3,600
2,500
0
4,900
6,400
1,600
424,800
85,800
25,400
y = Σy ÷ n = $18, 960 ÷ 12 = $1, 580
x = Σx ÷ n = $50, 760 ÷ 12 = 4, 230
r=
Σ( x − x )(y − y )
Σ( x − x ) Σ(y − y )
2
r 2 = (.826)2 = .682
2
=
(6)
(7)
–) (y – y–)2
(x – x–)(y – y
85, 800
= .826
(424, 800) (25, 400)
To download more slides, ebook, solutions and test bank, visit
3-14
Chapter 3
P3-3 (Concluded)
Month
January............
February ..........
March ..............
April .................
May ..................
June .................
July ..................
August ............
September.......
October............
November ........
December ........
(1)
y
Electricity
Cost
$1,600
1,570
1,610
1,550
1,530
1,540
1,520
1,530
1,580
1,650
1,660
1,620
(2)
–)
(y – y
Cost
Deviations
20
(10)
30
(30)
(50)
(40)
(60)
(50)
0
70
80
40
Total ........... $18,960
0
(3)
(4)
x
(x – x–)
Machine Activity
Hours Deviations
2,300
0
2,150
(150)
2,400
100
2,250
(50)
2,160
(140)
2,240
(60)
2,180
(120)
2,170
(130)
2,260
(40)
2,500
200
2,540
240
2,450
150
27,600
0
(5)
(x – x–)2
(6)
(7)
–) (y – y–)2
(x – x–)(y – y
(4) Squared
0
22,500
10,000
2,500
19,600
3,600
14,400
16,900
1,600
40,000
57,600
22,500
(4) × (2)
0
1,500
3,000
1,500
7,000
2,400
7,200
6,500
0
14,000
19,200
6,000
(2) Squared
400
100
900
900
2,500
1,600
3,600
2,500
0
4,900
6,400
1,600
211,200
68,300
25,400
y = Σy ÷ n = $18, 960 ÷ 12 = $1, 580
x = Σx ÷ n = $27, 600 ÷ 12 = 2, 300
r=
Σ( x − x )(y − y )
Σ( x − x )2 Σ(y − y )2
=
68, 300
= .933
(211, 200) (25, 400)
r 2 = (.933)2 = .870
(2)
Since the coefficient of determination for electricity cost and machine hours
(r2 = .870) is greater than the coefficient of determination for electricity cost
and labor hours (r2 = .682), machine hours should be used as the basis for
estimating electricity cost. Machine hours explain more of the variance in
electricity cost than do labor hours.
(3)
With machine hours as the basis for predicting electricity cost, the fixed cost
and the variable cost rate can be determined by the method of least squares as
follows:
Σ( x − x )(y − y ) Column 6 total 68, 300
=
= $.32339
=
Σ( x − x )2
Column 5 total 211, 200
= y − bx
Variable rate (b ) =
Fixed cost (a )
= $1, 580 − ($.32339)(2, 300)
= $836.20
To download more slides, ebook, solutions and test bank, visit
Chapter 3
3-15
P3-4
(1)
High .................................................................
Low ..................................................................
Difference........................................................
Maintenance
Cost
$2,290
2,000
$ 290
Machine
Hours
2,700
2,000
700
Variable rate = $290 ÷ 700 hours = $.4142857 per machine hour
Total cost ........................................................
Total variable cost ..........................................
Average fixed cost .........................................
(2)
(1)
(2)
–)
yi
(yi – y
Maintenance
Cost
Month
Cost
Deviations
January............ $2,200
40
February ..........
2,130
(30)
March ...............
2,000
(160)
April .................
2,170
10
May ..................
2,050
(110)
June .................
2,220
60
July ..................
2,150
(10)
August .............
2,250
90
September.......
2,290
130
October............
2,150
(10)
November ........
2,210
50
December ........
2,100
(60)
Total ........... $25,920
0
(3)
(4)
xi
(xi – x–)
Machine Activity
Hours Deviations
2,500
100
2,350
(50)
2,000
(400)
2,400
0
2,100
(300)
2,600
200
2,450
50
2,550
150
2,700
300
2,450
50
2,400
0
2,300
(100)
28,800
0
High
$2,290.00
1,118.57
$1,171.43
(5)
(xi – x–)2
(4) Squared
10,000
2,500
160,000
0
90,000
40,000
2,500
22,500
90,000
2,500
0
10,000
430,000
Low
$2,000.00
828.57
$1,171.43
(6)
(7)
–
–
– )2
(xi – x )(yi – y ) (yi – y
(4) × (2)
4,000
1,500
64,000
0
33,000
12,000
(500)
13,500
39,000
(500)
0
6,000
(2) Squared
1,600
900
25,600
100
12,100
3,600
100
8,100
16,900
100
2,500
3,600
172,000
y = Σy i ÷ n = $25, 920 ÷ 12 = $2, 160
x = Σx i ÷ n = $28, 800 ÷ 12 = 2, 400
Σ( x − x )(y − y ) Column 6 total 172, 000
ariable cost rate
=
=
= $.40 va
Σ( x − x )2
Column 5 total 430, 000
Since y = a + bx , then :
a = y − bx
b=
a = $2, 160 − ($.40)(2, 40
00 )
a = $2, 160 − $960
a = $1, 200
75,200
To download more slides, ebook, solutions and test bank, visit
3-16
Chapter 3
P3-4 (Concluded)
(3)
r=
r=
Σ( x − x )(y − y )
Σ( x i − x )2 Σ(y i − y )2
=
Column 6 total
olumn 7 total)
(Column 5 total) (Co
172, 000
172, 000
172, 000
=
=
= .9565
(430, 000)(75, 200)
32, 336, 000,0
000 179, 822
r 2 = (.9565)2 = .91489
(4)
(1)
xi
Month
January ..................
February ................
March .....................
April........................
May .........................
June........................
July.........................
August....................
September .............
October ..................
November ..............
December ..............
Total....................
s′=
(5)
Machine
Hours
2,500
2,350
2,000
2,400
2,100
2,600
2,450
2,550
2,700
2,450
2,400
2,300
28,800
(2)
(3)
(4)
yi
(y′′i = a + bxi) (yi – y′′i)
Actual
Predicted Prediction
Maintenance Maintenance
Error
Cost
Cost
(2) – (3)
$2,200
$2,200
$0
2,130
2,140
(10)
2,000
2,000
0
2,170
2,160
10
2,050
2,040
10
2,220
2,240
(20)
2,150
2,180
(30)
2,250
2,220
30
2,290
2,280
10
2,150
2,180
(30)
2,210
2,160
50
2,100
2,120
(20)
$25,920
$25,920
$0
(5)
(yi – y′′i)2
(4)
Squared
$0
100
0
100
100
400
900
900
100
900
2,500
400
$6,400
Σ(y i − y ′i )2
Column 5 total
$6, 400
=
=
= $25.29822
12 − 2
10
n −2
The 95% confidence interval for maintenance cost at the 2,500 machine hour
level of activity is
y ′ ± t 95%
( x i − x )2
1
s′ 1+ +
n Σ( x i − x )2
1 (2, 500 − 2, 400)2
$1, 200 + ($.40)(2, 500) ± (2.228)(25.29822) 1+
+
12
430, 000
$2, 200 ± $59.29
To download more slides, ebook, solutions and test bank, visit
Chapter 3
3-17
P3-5
(1)
(a)
The method of least squares:
(1)
yi
Month
January............
February ..........
March ...............
April .................
May ..................
June .................
July ..................
August .............
September.......
October............
November ........
December ........
Total ...........
b=
Electricity
Cost
$ 400
500
500
700
600
800
1,000
900
900
700
600
800
$8,400
(2)
–)
(yi – y
Difference
from
Average of
$700
Electricity
Cost
$(300)
(200)
(200)
0
(100)
100
300
200
200
0
(100)
100
0
(3)
xi
Guest
Days
1,000
1,500
2,500
3,000
2,500
4,500
6,500
6,000
5,500
3,000
2,500
3,500
(4)
(xi – x–)
Difference
from
Average of
3,500
Guest
Days
(2,500)
(2,000)
(1,000)
(500)
(1,000)
1,000
3,000
2,500
2,000
(500)
(1,000)
0
42,000
0
(5)
(xi – x–)2
(4) Squared
(000s
omitted)
6,250
4,000
1,000
250
1,000
1,000
9,000
6,250
4,000
250
1,000
0
34,000
(6)
(7)
–) (y – y–)2
(xi – x–)(yi – y
i
(4) × (2)
(000s
omitted)
$ 750
400
200
0
100
100
900
500
400
0
100
0
$3,450
Σ( x i − x )(y i − y ) Column 6 total $3, 450
= $.1015 variable rate
=
=
Σ( x i − x )2
Column 5 total 34, 000
Since y = a + bx , then:
$700 = a + ($.1015 × 3, 500)
a = $700 − $355
a = $345 fixed cost per month
(2)
Squared
(000s
omitted)
$ 90
40
40
0
10
10
90
40
40
0
10
10
$380
To download more slides, ebook, solutions and test bank, visit
3-18
Chapter 3
P3-5 (Continued)
(b)
The high and low points method:
Electricity
Cost
$1,000
400
$ 600
High ............................................................
Low.............................................................
Difference ..................................................
Guest
Days
6,500
1,000
5,500
$600
= $.1091 per guest day
5, 500
= $1, 000 − (6, 500 × $.1091)
Variable rate =
Fixed cost
= $1, 000 − $709
= $291
OR
Fixed cost
= $400 − (1, 000 × $.1091)
= $400 − $109
= $291
(c)
A scattergraph with trend line fitted by inspection:
$1,100
$1,000
ELECTRICITY COST PER MONTH
July
$900
Dec.
Sept.
Aug.
$800
June
Apr. & Oct.
$700
$600
May & Nov.
$500
Feb.
$400
Mar.
Jan.
Approx. $350
$300
$200
$100
$0
0
1,000
2,000
3,000
4,000
5,000
6,000
7,000
GUEST DAYS PER MONTH
Fixed cost per month
determined
by inspection....... $350
Average cost ...........
Less fixed cost........
Variable cost ...........
$700
350
$350
$350
3,500 average guest days
=
$.10 variable cost
per guest day
To download more slides, ebook, solutions and test bank, visit
Chapter 3
3-19
P3-5 (Continued)
(2)
The coefficient of correlation (r) and the coefficient of determination (r2), using
data from the requirement (1)(a) answer:
r =
r =
=
Σ( x i − x )(y i − y )
Σ( x i − x )2 Σ(y i − y )2
=
Column 6 total
(Column 5 total) (Column 7 total)
3, 450, 000
3, 450, 000
=
(34, 000, 000)(380, 000)
12, 920, 000, 000, 000
3, 450, 000
= .9598
3, 594, 440
r 2 = .9212
(3)
The standard error of the estimate:
Month
January ..................
February ................
March .....................
April........................
May .........................
June........................
July ........................
August....................
September .............
October ..................
November ..............
December ..............
Total....................
(1)
xi
(2)
yi
(3)
(y′′i = a + bxi )
Guest
Days
1,000
1,500
2,500
3,000
2,500
4,500
6,500
6,000
5,500
3,000
2,500
3,500
42,000
Actual
Electricity
Cost
$ 400
500
500
700
600
800
1,000
900
900
700
600
800
$8,400
Predicted
Electricity
Cost
$ 447
497
599
650
599
802
1,005
954
903
650
599
700
$8,405*
(4)
(yi – y′′i)
(5)
(yi – y′′i)2
Prediction
Error
Prediction
Squared
Error
(4)
(2) – (3)
Squared
$(47)
$ 2,209
3
9
(99)
9,801
50
2,500
1
1
(2)
4
(5)
25
(54)
2,916
(3)
9
50
2,500
1
1
100
10,000
$ (5)*
$29,975
*rounding error
Σ(y i − y ′i )2
Column 5 total
$29, 975
5
s′=
=
=
= $2, 997.5 = $54.75
12 − 2
10
n −2
To download more slides, ebook, solutions and test bank, visit
3-20
Chapter 3
P3-5 (Concluded)
(4)
The 90% confidence interval for electricity cost at 2,000 guest days would be:
y ′i ± t 90%
( x i − x )2
1
s′ 1+ +
n Σ( x i − x )2
1 (2, 000 − 3, 500)2
($345 + ($.1015)(2, 000)) ± (1.812)($54.75) 1+
+
12
34, 000, 000
$548± (1.812)($54.75)(1.072)
$548
± $106.35
P3-6
(1)
(a)
The high and low points method:
High ................................................................
Low .................................................................
Difference .......................................................
Variable rate = $100 ÷ 1,000 Billets = $.10
Fixed cost = $500 – ($.10 × 2,400 Billets) = $260
or
Fixed cost = $400 – ($.10 × 1,400 Billets) = $260
Cost
$500
400
$100
Activity
2,400
1,400
1,000
To download more slides, ebook, solutions and test bank, visit
Chapter 3
3-21
P3-6 (Continued)
(b)
A scattergraph with a trend line fitted by inspection:
$500
ELECTRICITY
$400
$300
$200
$100
$0
0
500
1,000
1,500
2,000
BILLETS
Fixed cost determined by inspection = $260
Average cost = $5,520 total cost ÷ 12 months = $460
Average activity = 24,000 total Billets ÷ 12 months = 2,000
Variable cost = ($460 average cost – $260 fixed cost) ÷ 2,000 average
activity = $.10 per Billet
2,500
To download more slides, ebook, solutions and test bank, visit
3-22
Chapter 3
P3-6 (Continued)
(c)
Month
January............
February ..........
March ...............
April .................
May ..................
June .................
July ..................
August .............
September.......
October............
November ........
December ........
Total ...........
(1)
y
Electricity
Cost
$ 455
450
435
485
470
475
400
450
435
500
495
470
(2)
(3)
(4)
–
(y – y )
x
(x – x–)
Cost
Number Activity
Deviations of Billets Deviations
(5)
2,000
0
(10)
1,800
(200)
(25)
1,900
(100)
25
2,200
200
10
2,100
100
15
2,000
0
(60)
1,400
(600)
(10)
1,900
(100)
(25)
1,800
(200)
40
2,400
400
35
2,300
300
10
2,200
200
$5,520
0
24,000
0
(5)
(x – x–)2
(4)
Squared
0
40,000
10,000
40,000
10,000
0
360,000
10,000
40,000
160,000
90,000
40,000
800,000
(6)
(7)
–
–
–)2
(x – x )(y – y ) (y – y
(2)
(4) × (2)
Squared
0
25
2,000
100
2,500
625
5,000
625
1,000
100
0
225
36,000
3,600
1,000
100
5,000
625
16,000
1,600
10,500
1,225
2,000
100
81,000
8,950
– = Σy ÷ n = $5,520 ÷ 12 = $460
y
x– = Σx ÷ n = 24,000 ÷ 12 = 2,000
81, 000
Σ( x − x )(y − y ) Column 6 total
=
= $.10125
=
2
Σ( x − x )
Column 5 total 800, 000
= y − bx
Variable rate (b ) =
Fixed cost (a )
= $460 − ($.10125)(2, 000)
= $257.50
(2)
The coefficient of correlation (r) and the coefficient of determination (r2), using
data from the answer in requirement (1)(c) follow:
r=
Σ( x i − x )(y i − y )
Σ( x i − x )2 Σ(y i − y )2
r 2 = (.957 )2 = .916
=
81, 000
= .957
7
(800, 000) (8, 950)
To download more slides, ebook, solutions and test bank, visit
Chapter 3
3-23
P3-6 (Concluded)
(3)
Month
January ..................
February ................
March .....................
April........................
May .........................
June........................
July.........................
August....................
September .............
October ..................
November ..............
December ..............
Total....................
(1)
y
Actual
Electricity
Cost
$ 455
450
435
485
470
475
400
450
435
500
495
470
$5,520
(2)
x
Number
of
Billets
2,000
1,800
1,900
2,200
2,100
2,000
1,400
1,900
1,800
2,400
2,300
2,200
24,000
(3)
(y′′= a + bx)
Estimated
Electricity
Cost
$ 460
440
450
480
470
460
399
450
440
501
490
480
$5,520
(4)
(y – y′′ )
(5)
(y – y′′ )2
(1) – (3)
(5)
10
(15)
5
0
15
1
0
(5)
(1)
5
(10)
0
(4)
Squared
25
100
225
25
0
225
1
0
25
1
25
100
752
Σ(y − y ′ )2
Column 5 total
$752
s′=
=
=
= $8.672
12 − 2
10
n −2
The 95% confidence interval for electricity costs at the 2,200 Billets level of
activity would be determined as follows:
a + bx ± t 95% s′ 1+
1 ( x − x )2
+
n Σ( x − x ) 2
28)($8.672) 1+
$257.50 + ($.10125)(2,200) ± (2.22
1 (2,200 − 2,000)2
+
12
800,000
$480.25 ± (2.228)($8.672)(1.065)
$480.25 ± $20.58
or between a low of $459.67 and a high of $500.83.
To download more slides, ebook, solutions and test bank, visit
3-24
Chapter 3
P3-7
(1)
(1)
yi
Factory
Overhead
Cost
(2)
–)
(yi – y
Difference
from
Average
of $7,900
Direct
Labor
Hours
$8,500
9,900
8,950
9,000
8,150
7,550
7,050
6,450
6,900
7,500
7,150
7,800
600
2,000
1,050
1,100
250
(350)
(850)
(1,450)
(1,000)
(400)
(750)
(100)
2,000
2,400
2,200
2,300
2,000
1,900
1,400
1,000
1,200
1,700
1,600
1,900
200
600
400
500
200
100
(400)
(800)
(600)
(100)
(200)
100
8,700
9,300
9,300
8,700
8,000
7,650
6,750
7,100
7,350
7,250
7,100
7,500
800
1,400
1,400
800
100
(250)
(1,150)
(800)
(550)
(650)
(800)
(400)
2,100
2,300
2,200
2,200
2,000
1,800
1,200
1,300
1,500
1,700
1,500
1,800
Jan ...................
8,600
Feb ...................
9,300
Mar ...................
9,400
Apr. ..................
8,700
May ..................
8,100
June .................
7,600
July ..................
7,000
Aug...................
6,900
Sep...................
7,100
Oct ...................
7,500
Nov...................
7,000
Dec...................
7,600
Total ................. $284,400
700
1,400
1,500
800
200
(300)
(900)
(1,000)
(800)
(400)
(900)
(300)
0
2,000
2,300
2,300
2,200
2,000
1,800
1,300
1,200
1,300
1,800
1,500
1,900
64,800
Month
20A
Jan ...................
Feb ...................
Mar ...................
Apr ...................
May ..................
June .................
July ..................
Aug...................
Sep...................
Oct ...................
Nov...................
Dec...................
(3)
xi
(4)
(5)
(xi – x–)
(xi – x–)2
Difference
from Average
of 1,800
(4)
Hours
Squared
(6)
(7)
–) (y – y–)2
(xi – x–)(yi – y
i
(4) × (2)
(2)
Squared
40,000
360,000
160,000
250,000
40,000
10,000
160,000
640,000
360,000
10,000
40,000
10,000
120,000
1,200,000
420,000
550,000
50,000
(35,000)
340,000
1,160,000
600,000
40,000
150,000
(10,000)
360,000
4,000,000
1,102,500
1,210,000
62,500
122,500
722,500
2,102,500
1,000,000
160,000
562,500
10,000
300
500
400
400
200
0
(600)
(500)
(300)
(100)
(300)
0
90,000
250,000
160,000
160,000
40,000
0
360,000
250,000
90,000
10,000
90,000
0
240,000
700,000
560,000
320,000
20,000
0
690,000
400,000
165,000
65,000
240,000
0
640,000
1,960,000
1,960,000
640,000
10,000
62,500
1,322,500
640,000
302,500
422,500
640,000
160,000
200
500
500
400
200
0
(500)
(600)
(500)
0
(300)
100
0
40,000
250,000
250,000
160,000
40,000
0
250,000
360,000
250,000
0
90,000
10,000
5,280,000
20B
Jan ...................
Feb ...................
Mar ...................
Apr ...................
May ..................
June .................
July ..................
Aug...................
Sep...................
Oct ...................
Nov...................
Dec...................
20C
140,000
490,000
700,000 1,960,000
750,000 2,250,000
320,000
640,000
40,000
40,000
0
90,000
450,000
810,000
600,000 1,000,000
400,000
640,000
0
160,000
270,000
810,000
(30,000)
90,000
11,625,000 29,155,000
To download more slides, ebook, solutions and test bank, visit
Chapter 3
3-25
P3-7 (Continued)
b=
Σ( x i − x )(y i − y ) Column 6 total 11, 625, 000
=
=
= $2.20 variable cost rate
Σ( x i − x )2
Column 5 total 5, 280, 000
Since y = a + bx and y = Σy i ÷ n and x = Σx i ÷ n, then :
($284, 400 ÷ 36) = a + ($2.20)(64, 800 ÷ 36)
$7, 900 = a + $3,, 960
a = $3, 940 fixed overhead cost
(2)
The coefficient of correlation and the coefficient of determination, using data
from the requirement (1) answer:
r
=
r
=
Σ( x i − x )(y i − y )
Σ( x i − x )2 Σ(y i − y )2
=
Column 6 total
(Column 5 total) (Column 7 total)
11, 625, 000
11, 625, 000
11, 625, 000
=
=
= .9370
153, 938, 400, 000, 000 12, 407, 191
(5, 280, 000)(29, 155, 000)
r 2 = (.9370)2 = .8780
