Full Length Research Paper : Market access, intensification and productivity of common bean in Ethiopia: A microeconomic analysis
Bạn đang xem bản rút gọn của tài liệu. Xem và tải ngay bản đầy đủ của tài liệu tại đây (188.54 KB, 12 trang )
African Journal of Agricultural Research Vol. 6(2), pp. 476-487, 18 January, 2011
Available online at />DOI: 10.5897/AJAR10.011
ISSN 1991-637X ©2011 Academic Journals
Full Length Research Paper
Market access, intensification and productivity of
common bean in Ethiopia: A microeconomic analysis
E. Katungi1*, D. Horna2, S. Gebeyehu3 and L. Sperling4
1
Centro Internacional de Agricultura Tropical (CIAT), Africa, P.O.BOX 6247, Kampala Uganda.
Environment and Production Technology Division (EPTD), International Food Policy Research Institute (IFPRI),
Washington DC, USA.
3
Melkasa Agricultural Research Center of the Ethiopia Institute of Agriculture Research, Nazareth, Ethiopia.
4
Centro Internacional de Agricultura Tropical (CIAT), Africa, Arusha office, Tanzania.
2
Accepted 28 December, 2010
This work analyses on-farm adjustments in land allocation and intensification in a commercial crop
following the increases in market demand in a developing economy. Drawing from the survey
conducted among common bean producers in Ethiopia in 2008, a two stage econometric method was
used to investigate the contribution of market access and other micro-level factors in facilitating crop
intensification and productivity. Ethiopia is the leading commercial producer and exporter of common
bean in Africa but also one of the countries in Africa with high levels of soil nutrient depletion.
Understanding factors that influence input use and productivity is critical for food security and
agricultural sustainability in the country. Based on farm survey data, it was shown that most farmers
had expanded their area under common bean but the use of fertilizer and improved varieties was still
low. Increase in the intensity of fertilizer and seed use produces an increase in yield and so is market
access. Market access has intensification as well as specialization effects on common bean yield.
Access to credit, extension and household wealth are other factors that facilitate common bean
intensification while risk increasing factors constrain it.
Key words: Common bean, intensification, productivity, Ethiopia.
INTRODUCTION
Developing countries face the task of increasing
agricultural production to meet food demand while
ensuring sustainability of the land resource base on
which agriculture depends. Ethiopia is one of the
countries in Africa where landholding has already
reached threshold levels and soil nutrients are highly
depleted (FAO, 1986). Increases in market demand for
commercial crops in the last one decade, following the
market reforms implemented in early 1990s and the
government’s deliberate effort to develop the private
sector [recognizing that large capital investments are
needed to exploit Ethiopia’s resources, various incentives
*Corresponding author. E-mail: Tel: +2560414-567804. Fax: +256-0414-567635.
are being provided to encourage foreign investment
(including joint ventures and marketing arrangements] so
that the agricultural sector makes a significant
contribution to Ethiopia’s development), has added more
pressure on land. An increase in market demand in the
face of increasing population pressure can lead to
adoption of land enhancing technologies such as
fertilizers or high yielding varieties (Boserup, 1965; Ali,
1995).
Increase in market demand may also encourage
specialization by shifting from low value crops to high
value crops without significant change in technology or
growth in yields (Kamara, 2004). This work examined the
nature of on-farm adjustments in the common bean
production systems triggered by changes in commodity
markets in the early 1990s in Ethiopia while focusing on
the role of market access in facilitating intensification and
Katungi et al.
productivity in common bean, a topic that has not been
previously studied. The study discussed changes in land
use and allocation to common bean and how this
compares between farm categories. Then, the effect of
market access and that of other factors on the adoption
of land enhancing technologies and productivity of
common bean was analyzed.
Then, a conceptual framework followed by a brief
description of the study area and data sources was
presented, as well as sample design. The presentation of
the econometric estimation followed while the
specification of reduced models and hypotheses were
presented next. Results were presented and discussed
and the work concluded with the summary of the key
findings and policy implications.
Conceptual framework
Agricultural intensification has been defined as the use of
an “increased average inputs of labour or capital on
smallholding for the purpose of increasing the value of
output per ha” (Tiffen et al., 1994: 29). This occurs in
response to either, an increased demand for output or a
fall in the availability of key factors such as land, labour or
water (Boserup, 1965; Ali, 1995). Demand for output may
increase due to an increase in population, expansion of
markets and increased income. The demand increases
associated with expansion of markets is the focus of this
work.
According to Boserup (1965), in times of pressure from
population growth and increased demand, people will find
ways to increase food production by increasing labour
inputs, fertilizers or machinery. Initially, farmers may
expand the area under crops whose market opportunities
are expanding and later adopt more intensive use of land
as land base per capita continue to decline. The intensive
land use can take the form of continuous cropping or
inter-cropping systems with each resulting in rapid soil
fertility depletion. Land enhancing inputs such as
fertilizers and high yielding crop varieties can be used to
enhance land productivity as land becomes a limiting
factor. Production theory predicts that, a farmer will
allocate inputs to the production of a commodity until the
returns from additional input is equal to the unit cost of
that input. The cost of land enhancing inputs such as
fertilizer and improved seed, in turn, depends on the
market conditions.
The effect of market conditions and commercialization
on common bean intensification and productivity in
Ethiopia is mediated through a complex relationship and
cannot be determined a priori. An expected increase in
market incentives will motivate households to adopt land
enhancing inputs such as fertilizer, high yielding variety
seed and or apply more labour into production of
common bean. The most important exogenous
determinants of intensification are population pressure,
availability and cost of inputs, as well as investment in
477
road infrastructure. Farmers with better physical access
to markets for the output or land enhancing inputs, such
as fertilizers and improved variety seed may obtain
higher returns to land and labour, thus further reinforcing
the intensification process. When the access to land
enhancing inputs is limited, the commodity demand
theory suggests that, small farmers will respond to
increased market incentives by either shifting from one
crop to another or increasing cropping intensity (Schultz,
1964; Mellor, 1969). The endogenous consequences of
commercialization are household decisions on resource
allocation that is mainly land reflected, in land use
patterns, labour and adoption of land enhancing
technologies.
MATERIALS AND METHODS
Study area
The study was conducted in the Oromia regional State, the major
commercial common bean producing region in Ethiopia. Oromia
receives a bimodal type of rainfall that is highly erratic. Mean rainfall
varies between 800 and 1000 mm; with a 20 to 40% probability of
having a failed season. Literacy levels were estimated below 40%
and off farm employment was rare. To manage production risks,
farmers have limited options other than diversifying agriculture
enterprises. Common bean is a commercial crop that plays
strategic role in alleviating food deficit during the period of food
shortage when other crops have not yet matured (Legesse et al.,
2006). The canning type, primarily grown for export market,
dominates the Oromia region (Northeast rift valley). Data used in
this article indicated that 80% of the harvested common bean in the
Oromia region was marketed, confirming that, common bean is a
commercial crop in the study areas and market incentives are
important in the production decisions.
Common bean has been produced in Ethiopia for export for over
40 years but its growth was interrupted by unfavourable policies
implemented between 1975 and early 1980s. During this period, the
government put restrictions on all private trade, giving the statecontrolled marketing board full monopoly over the marketing of all
grains in the country (Gabre-Madhin, 2001). These policies resulted
in low incentives to farmers and consequent under investment into
crop management. In particular, quality standards were severely
affected, resulting in a substantial decline in export volumes, from
80 to 23% of the total production (Ayele, 1990 in Alemu and Bekele,
2005).
In the early 1990s, the government abolished the state grain
control and quota system, to restore the private trade (GabreMadhin, 2001). The modern warehouses used by the Agricultural
Marketing Corporation during the monopoly period were made
available for rental by the private sector, as a way of facilitating
quick recovery. These reforms triggered significant changes in the
export market of common beans (there is evidence that export
demand for common bean expanded following the economic
reforms which stimulated further increases in production) (Legesse
et al., 2006; Alemu and Bekele, 2005). Both international and local
private sector participation has since increased, creating significant
improvements in the farm gate prices that stimulated an upward
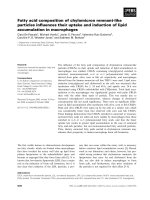
trend in area and yield growth since 2002 (Figure 1). An additional
factor that is facilitating the process of commercialization and
production growth in common bean sub sector in Ethiopia is the
investment in bean research and seed systems development,
supported by the government and the International Center for
Tropical Agriculture (CIAT) (in Spanish: Centro International de
478
Afr. J. Agric. Res.
Area (000 ha)
Output (000 ton)
Figure 1. Common bean production trends in Ethiopia (1998 to 2008). Source: Computed from FAO data (2008).
Agricultura Tropical) over the last two decades. This investment has
improved the availability of high yielding varieties adapted to the
environmental stresses (The Ethiopian Institute of Agricultural
Research (EIAR) released about 23 high yielding varieties of
common bean between 1996 and 2004 (Rubyogo et al., 2010). In
more recent years, there has also been increased support for the
local level seed supply in recognition of the failure of the formal
seed sector to respond to the needs of small farmers and marginal
environments. This was done through a collaborative arrangement,
spearheaded by CIAT, between national research systems, nongovernmental organizations and various farmers to enhance wider
dissemination of new crop varieties and improved crop
management practices (Legesse et al., 2006).
Despite these achievements, there is still a huge yield gap (about
2000 kg/ha) that can be reduced and thus improve the income of
common bean producers and other stakeholders involved in the
value chain (Setegn, per comm.). It is believed that, this yield gap is
caused by low use of inputs, particularly land enhancing
technologies (Legesse et al., 2006; Negash, 2007). This study
seeks to explore the micro-level factors, that facilitate or constrain
agricultural intensification and yield, which is critical for food
security and poverty alleviation in the country. Ethiopia is among
the poorest countries in the world with dependency on food aid
averaging about 700,000 metric tons annually over the past ten
years (Byerlee et al., 2007).
Survey design and data
The data set used in the analysis was a subsample of the baseline
data collected through a household survey in the two major
common bean producing regions of Oromia and SNNPR between
June and August 2008. Both regions contributed 80% of beans
produced in Ethiopia. The baseline survey was part of the project:
“enhancing the productivity of legumes to improve the livelihoods of
the poor households in drought prone area” implemented between
2007 and 2010 [implemented jointly by International centre for
Tropical agriculture (CIAT)], International Crops Research Institute
for the Semi-Arid Tropics (ICRISAT, International Institute of
Tropical Agriculture (IITA) and in collaboration with NARS in
participating countries of East and Southern Africa and Asia]. The
purpose of the baseline survey was to provide information against
which the project impact would be monitored. The sample was
designed to provide factual and counter factual scenarios in each
region. Each scenario in each region involved two woredas (an
equivalent of a district in other sub-Saharan countries), chosen
purposively according to the amount of rainfall, probability of rainfall
failure and literacy levels. These were Adama, Adami Tuli and
Siraro from Oromia and Dale from SNNPR. Although Siraro is from
Oromia regional state, it is in the border line with SNNPR and also
grows significant amounts of the small red cooking type that
dominates SNNPR. It was therefore selected as a counterfactual
site for interventions in Dale, due to logistical reasons. In each
woreda, the villages were randomly selected for the survey. The
study then used a randomly selected subsample of 180 households
from 10 villages of Oromia region. The households produces
common bean primarily for sale.
In addition to eliciting general farm and household
characteristics, the survey included detailed questions on area
allocated to common bean production, inputs used in common bean
production and the total quantity harvested in 2008. Interviews on
production related variables were conducted while in the plot to
complement the farmers recall with direct observations (the
contribution of the direct observations in data quality assurance was
further enhanced by the fact that most of the crops including
common bean were still in the field at the time of the survey). Each
farmer was also asked if there have been any adjustments in areas
under common bean during the five years prior to the survey.
Table 1 presents a summary of the general characteristics of the
households in the study areas. Households were generally of low
education and own smaller farms, though majority depend on
farming for their livelihoods. Average landholding was 2.5 ha that
ranged from 0.25 to 18 ha but, about 50% of the households had
less than 2 ha. Only 45% of the total used inorganic fertilizers
(Table 1). Like elsewhere in rural parts of Ethiopia, most
households in the study areas were far from all weather roads
(paved roads) and urban centers. Based on the survey data, the
average distance from the nearest urban center was 7.7 km, with
households in a range of 0.05 km to 30 km. Public transport was
scarce and most people used household owned horses as mode of
transport, for both people and produce, to the market. Off farm
employment opportunities were very limited (less than 10% of the
household heads were employed off farm as part time) and each
household head spent on average, 8.6 months on the farm.
Katungi et al.
479
Table 1. Descriptive statistics of the selected sample characteristics.
Variable
Age of household head (years)
Education of household head (years)
Household size
Number of months a household spends on farm
Land holding (ha)
Distance from the farm to urban centres (km)
Fertilizer use rate (%)
Mean
40.25
2.97
7.82
8.67
2.54
7.72
45.09
Econometric models and estimation
A two step estimation procedure was used to analyse the
determinants of the common bean yields and input use. In the first
step, the factors that influenced fertilizer use intensity and adoption
of improved varieties were analyzed. In the second step, the effect
on common bean yield of fertilizer use intensity, adoption of
improved varieties and other production factors were tested. The
summary of the econometric methods applied to estimate the
determinants of input use, including the results of model
specification tests, were presented first and was followed by the
production function estimation.
A crop variety is a divisible technology whose adoption is better
measured by the area under the variety. In this case, the data
showed very low adoption rates (about 29%) but nearly 100% use
among adopters. Hence, variation in likelihood of use was a more
relevant measure of adoption. A binary Probit regression model
was therefore applied to estimate the factors, that affect the
probability that a randomly selected bean producer used improved
varieties. The binary Probit regression model assumes an
underlying adoption latent variable y* defined by:
(1)
Where, Z is a vector of exogenous variables hypothesized to
is a vector of coefficients to be
is the random error term assumed to have zero
estimated and
mean and constant variance. The decision to adopt is only
observed, when it is positive and remains unobserved for nonadoption. The estimated model was specified as:
y = 1if
y* > 1 and
y = 0 if
otherwise
Minimum
17
0
1
0
0.25
0.05
-
Maximum
90
13
33
12
18
30
-
model, the latent variable (y*) is linked to the observed adoption
variable (FERT) through the following equations:
FERT = y * if
y* > 0
FERT = 0 if
y*≤ 0
(3)
y* = X β +λ .
i
i
i . Vector X
The latent variable, y*, is defined as:
contains all variables hypothesized to influence fertilizer use
intensity,
λi
Use of improved varieties
influence adoption decisions,
Standard deviation
14.96
3.17
4.61
2.87
2.00
5.69
49.90
β
is a vector of unknown parameters to be estimated,
is the independent normally distributed error term assumed
and
to have zero mean and constant variance σ . The intensity of
fertilizer is observed when
when
β Xi + λi ≤ 0
Xi β +λi >0
and censored at zero
. The effect of the jth explanatory variable
Xj
on the expected fertilizer use intensity in common bean
production was computed following the exposition of Mcdonald and
Moffit (1980) discussed in Wooldridge (2002).
Production function estimation
A flexible quadratic functional specification was applied in the
estimation of determinants of yield. This specification was
particularly suited for the study of yield for common bean in Ethiopia
where some farmers do not use fertilizer and hence had zero
values in the data (another advantage of a quadratic production
function over the Cob-Douglas type of production function is that
the production function is generally compatible with the three stage
of the production function of neoclassical economic theory)
(Debertin, 1992). The following quadratic model was estimated:
(2)
(5)
Fertilizer use intensity
The data revealed that common bean producers in Ethiopia do
differ in terms of the intensity of the fertilizer use. Non-adoption (a
corner solution at zero) occurs even in areas of diffusion of the
technology. Therefore, there is a cluster of farmers with zero
adoption at the limit of the variable, or the “corner” of the
optimization problem. A maximum likelihood Tobit estimator
commonly used in estimation when the dependent variable is
observed within a limited range (Green, 2000) was used. In a Tobit
Where, Y is yield, FERT is per hectare amount of fertilizer and IMV
is the use of improved varieties. The vector X represents other
inputs and determinants hypothesized to influence adoption and ‘ ’
is the random error term assumed to have mean zero and variance
one. One problem is that fertilizer use intensity and improved
varieties will be endogenous, if the decision to use these inputs is
motivated by the need to increase yield. The endogenous variables
are correlated with the error terms, in the main equation (that is,
yield in this case), rendering the estimated coefficients inconsistent.
480
Afr. J. Agric. Res.
Table 2. Definition and descriptive statistics of dependent variables.
Variable
Variable definition
Improved variety (IMV)
Fertilizer intensity (FERT)
Fertilizer intensity among adopters
Yield
Log yield
A household grew an improved variety in 2008
Amount in kg applied per hectare
Amount in kg applied per hectare within the adopting sample
Amount in kg per hectare harvested
Log of the amount (kg/ha) of yield harvested
A strategy to test for endogeneity is using a Durbin–Wu–Hausman
test (Wooldridge, 2002). The test involves estimating auxiliary
reduced-form regressions for the right-hand side variables
suspected to be endogenous, followed by estimation of an
augmented original model, including the reduced-form residuals as
additional explanatory variables. The statistical significance of the
coefficients associated with the residuals was then evaluated.
First, the test was implemented for fertilizer use intensity. Credit
were neither significant in variety model nor that of yield and were
therefore used as instrumental variables for fertilizer use intensity.
The endogeneity of the adoption measure for improved varieties
was also tested in a similar way, using the dummy of whether the
farmer renewed seed at planting in 2008, as the instrument. The
tests confirm the variables to be endogenous in the yield function
and an instrumental variable approach was used in a two step least
squares regression method (An alternative approach often used to
account for endogeneity of inputs on the production function
estimation is by use of a three stage least squares regression as
that one used by Kamara ( 2004). This approach is an instrumental
variable technique that jointly estimates the entire system of
equations (Green, 2000). It was not used because the rank order
condition discussed in Wooldridge (2002: p 211-212).
Definition and measurement of variables
Dependent variables
Three dependent variables: yield, fertilizer and improved varieties
were considered for the evaluation of the determinants of input use
and productivity for common bean in Ethiopia. Table 2 presents the
variable definition and their descriptive statistics.
Mean
0.289
45.426
120.903
1254.531
6.749
Standard
deviation
0.455
93.061
118.350
1159.819
0.984
Fertilizer use intensity
Inorganic fertilizers commonly used in common bean in Ethiopia are
DAP and urea. Attempts to elicit data by fertilizer type were made
but farmers were unable to differentiate types and hence a measure
of fertilizer use aggregated over types was used. Therefore,
fertilizer use intensity was measured as the amount of aggregated
inorganic fertilizers applied per hectare during the 2008 cropping
season. Data in Table 2 shows that the aggregated inorganic
fertilizer use intensity was very low with high variability across
farms. On average, each farmer applied 45 kg of the aggregated
inorganic fertilizers per hectare which was far below the
recommended rate of 100 kg/ha of TSP and 25 kg/ha of urea
(David, 1998). Among the adopters, the average fertilizer intensity
was about 120 kg/ha but highly variable across farms (Table 2).
Yield
The measurement of common bean productivity was based on the
concept of input-output relations (that is the relationship between
output and conventional inputs: land, labour, seed and fertilizer).
Land was taken to be a fixed factor and all inputs standardized to a
hectare. In this study, common bean yield refers specifically to
productivity per unit area, expressed in kg per hectare. The data
shows an average yield of 1254.5 kg/ha with a standard deviation
of 1159.8, implying high variability of yield across farm. To reduce
the impact of outliers and improve the robustness of the estimates,
the yield measure was transformed into logarithms. The logarithmic
transformation was also attractive and easy to interpret as it gives
direct effects of one unit change in explanatory variables in
percentage change in the dependent variables (Allison, 1999).
Use of improved varieties
In the last two decades, more than 10 varieties were released in
two major common bean regions of Ethiopia. To differentiate these
varieties from those introduced many decades ago, a variety was
defined as improved, if it was released after 1989. Use of improved
common bean varieties was defined as a binary dummy (IMV=1) if
a farmer planted an improved variety released after 1989 and as
zero if otherwise. Impact of any crop variety depends on the extent
of adoption measured in terms of area and a qualitative indicator of
“one/zero” is not a strong indicator of how widely the improved
varieties are used. Low incidences of use in the data, limited the
use of variety area in the analysis. About 29% of the sampled
farmers planted the improved varieties in 2008 cropping season.
Out of the adopters, 60% allocated all their common bean area to
the improved varieties with the remaining 40% allocating over 60%
of their common bean area to the varieties. Hence, the dummy
indicator was a good approximation of the extent of variety
adoption.
Definition of explanatory variables and their hypothesized
effects
The choice of the explanatory variables used in the estimation of
input use models and yield functions was based on production
theory, literature and prior information on the study context. A
summary of all the explanatory variables, their definition and
descriptive statistics are presented in Table 3.
Improved variety use
A broad literature on technology adoption provided the basis for the
choice of explanatory variables used in the analysis, comprising
individual, household and farm-physical characteristics. Literature
Katungi et al.
481
Table 3. Explanatory variable, their definition, hypothesized effects and descriptive statistics (HH=household).
Variable
Input use
FERT
Labour inputs
Family labour
Hired labour
Seed use
Beanhadum1
Beanhadum3
Scale
Extension
Credit
Description /Units
Mean
Std. Dev.
Predicted value of Fertilizer applied (Kg/Ha)
-1
Total amount of labour in man hrsha used in common bean 2008
No. of HH members aged above 15 years
No. of people hired in common bean production
Amount of seed Kg/Ha
Dummy (1 if a farm in the data had less than 0.5 ha of common bean)
Dummy (1 if a farm had more than 2 ha of bean)
Total area under common bean in 2008 (ha)
Dummy (1 if HH contact extension in 2007-2008)
Dummy (1 if the farmer obtained credit)
121.84
151.72
3.21
3.34
50.37
0.21
0.15
0.72
0.57
0.29
108.24
183.45
2.02
7.22
48.43
0.41
0.35
1.02
2.37
0.46
0.25
0.44
0.30
0.46
4530.02
9611.13
1146.38
4484.68
2.65
15349.41
15176.62
4487.41
5622.84
11.52
Farm characteristics
Distance
Distance from farm to the nearest urban centre (km)
Easy market
Dummy (1 if HH located within a radius of 5 km from the urban centre)
Difficult market
Dummy (1 if HH located beyond 10 km from the urban centre)
7.46
0.27
0.22
5.50
0.44
0.42
HH characteristics
Gender of HH head
HH education
land holding
1.04
0.48
2.16
0.23
1.08
1.92
Agricultural practices
Seed renewal
Predicted value of improved variety use if farmers planted any variety released
after 1989
Dummy (1 if farmer renewed seed)
Assets
Implements
Livestock
Donkey
Oxen
Off-farm income
Value of farm implements (Eth.Birr)
Value of livestock ( Eth.Birr)
Value of donkey (Eth.Birr)
Value of oxen (Eth.Birr)
Dummy-1 if a HH earns off farm income
IMV
Dummy (1 if HH head is male )
No. HH members with more than 7 years of schooling
Total land holding (Ha)
specific to Ethiopia identified access to extension, credit and market
conditions as the important factors that influence the adoption of
common bean production technology (Negash, 2007). Contact with
extension in Ethiopia is vital for its effect on access to new
technologies because of poor infrastructure, low density of
communication technology and low literacy levels. In the sample,
33% of the production decision makers had no formal education
and only 40% had more than 4 years of formal education.
Access to credit is also expected to increase the adoption of new
common bean varieties through different complementary
mechanisms. First, because seed is expensive, it is often sold to
farmers on credit, or liquidity constrained farmers can only afford to
purchase seed when they obtain credit in cash. Access to credit
also has risk reducing effects that could re-enforce the decisions to
adopt new crop varieties. Priori information shows that, most of the
common bean producers in sub-Saharan Africa, a self pollinated
crop, keep their own seed and that this tends to slow down the
diffusion of new crop varieties (David and Sperling, 1999). Based
on this information, it is hypothesized that farmers who frequently
renew their seed from off farm sources are likely to obtain and plant
new varieties.
Adoption of technologies in agriculture has generally been
observed to start with well-off farmers and gradually trickle to poorer
ones (Feder et al., 1985) but mixed results have also been reported
for divisible technologies. Feder (1981) found the adoption of the
green revolution varieties; a divisible technology, was biased
towards larger farms due to their risk preferences and information
access. In their impact study of improved common bean varieties,
across other various sub-Saharan African countries, Kalyebara et
al. (2008) observed that the adoption of common bean varieties
was neutral to scale and wealth. Household assets (represented by
the value of farm implements, oxen and the size of the land holding)
were included to test their relevance in the Ethiopian context. Better
and more farm implements can be an indicator of wealth and may
increase the likelihood of adopting new technology through risk
reducing effects. Farm implements also ease farm work and put the
482 Afr. J. Agric. Res.
farmer in a wider and richer social network because of lending to
neighbours, who may reciprocate by providing information and/or
new variety seed. Distance from urban center to the farm, reduces
the likelihood that a farmer will learn about the new varieties and be
able to access the technology.
Earlier study by Knight et al. (2003) found education of the
household members to be important in alleviating risk among
farmers in Ethiopia. It was hypothesized to positively influence the
use of new improved common bean varieties because of its risk
reducing effects. Gender is another variable that is expected to
influence the access to new technologies in Ethiopia because of
gender biases towards men in community associational life in the
country.
Fertilizer use
The definition and description of the independent variables in the
fertilizer use intensity model are also presented in Table 3. Fertilizer
is an expensive input and its performance depends on soil moisture
status that is often beyond the farmer’s control in Ethiopia. Because
of this, factors that reduce risk and liquidity constraints were
expected to be important factors in its use (even when it is supplied
in the form of credit through cooperatives, a farmer is expected to
pay 15% of the principal and interest in cash as down payments
(Mulatu and Regasa), 1987). Credit and education reduced liquidity
constraints and risk (Weir and Knight, 2004; Knight et al., 2003) and
were hypothesized to be positively related with fertilizer use. Older
people tend to discount the future heavily and are expected to use
lower fertilizer intensity. The number of dependants may increase
the risk of starvation or increase household consumption demand.
Hence its effect on fertilizer use cannot be determined a priori. The
effect of livestock on fertilizer use cannot be determined a priori.
Livestock may increase the use of inorganic fertilizer through its
risk reducing effect or it may have a negative effect if it provides an
alternative source of fertilizer (in the study areas, agriculture is
characterized by livestock mainly cattle and crops). After
harvesting, crop fields are used as communal grazing areas (Mulatu
and Regasa, 1987). This means that even farmers with limited
livestock can access organic manure but this might not be
adequate and owners might still be at an advantage because of
collection from the kraal.
Although, most of the farm activities are done by family labour,
hiring of labour and traditional labour raising practices are often
used to complement family labour during periods of critical labour
peaks ((Mulatu and Regasa, 1987). It is hypothesized that, access
to complementary labour reduces competition between crops and
enables the use of labour intensive inputs like fertilizers.
Possession of oxen also facilitates early ploughing of the land at the
start of rains, thereby enhancing the productivity of fertilizers.
Teressa and Heidhues (1996) and Negash (2007), reported a
positive correlation between the number of oxen and the use of
fertilizers in Lume areas, also located in Oromia. To account for
both the number and quality of oxen, the market value of the oxen
was used (Mulatu and Regasa (1987) reported that the lack of feed
in the dry season makes (oxen too weak to plough properly). Each
farmer was asked the number of oxen and the value of each, if sold
at the time of the data collection.
Market access was represented by the distance (km) from the
farm to the nearest urban centers and site specific dummies.
Although, fertilizer use is not new in Ethiopian agriculture, its market
is still under developed due to poor road and communication
infrastructure combined with government interventions in the market
(of the total roads, only 13% are paved while only 2% of the 100
persons have mobile subscriptions because some sites have no
telephone connections (World bank, 2008). The use of fertilizer was
expected to be less costly near urban centers due to reduced
transport costs and better access to storage facilities. Proximity to
urban centers may also increase incentives from output markets
and facilitates information access, thereby, increasing the demand
for fertilizer.
The three study sites (Adama, Adama Tuli and Siraro) also
differed in important ways. The Siraro woreda was far from urban
centers and the dominant soils in this study site were sandy, with
implications of high fertilizer productivity. On the other hand, study
sites in Adama and Adami Tuli appeared to have similar agroecological conditions; some farmers were not very far from paved
roads but Adama was closer to the regional town (that is, Nazareth
town). Hence, market access might be higher in Adama than in
Adami Tuli and Siraro. Extension was reported from earlier studies
to be an important variable which explain variations in fertilizer use
(Negash, 2007) and was thus included. Measures of population
density and off farm income were excluded from the final estimation
because they were highly insignificant.
Yield
Inputs used in the yield equation were standardized to a hectare
and the predicted values for fertilizer use intensity and improved
varieties were used in the estimation of the yield function to account
for their endogeneity (Table 3). The production theory predicted that
yield increases in all inputs: seed, labour and fertilizer. This is
based on the assumption that, any rational decision maker cannot
operate in the third stage of the production function. Labour input
was computed as the total man hours aggregated across activities
and gender (one woman hour was assumed to be equivalent to 0.8
man labour hours). The amount of seed planted was defined by
asking every farmer the amount of seed in kg planted in 2008. To
standardize per hectare, the total amount of seed planted was
divided by the bean area (ha). Fertilizer and improved varieties
were measured as described earlier. The value of livestock was
included to control the effect of organic fertilizers. The new varieties
developed and disseminated in Ethiopia were extensively tested
with end-users for agro-ecologic adaptation in many other subSaharan countries and was found to increase yield by 30 to 50%
(Kalyebara and Andima, 2006). Under this context, it is expected
that, yield increases with the use of improved varieties.
Market access operates in several ways that may not be
dissociable in a given location at one point in time. For example, it
may facilitate access to inputs and hence encourages input
intensification. In addition to input intensification, market access has
been found to encourage specialization, thereby enhancing
efficiency in crop management and productivity (Kamara, 2004).
Based on this literature, indicators of market access were included
to test for any other effect after controlling its intensification effect.
Data exploration tests revealed that, distance from urban centers to
the farm was nonlinear in the yield equation. Because inclusion of a
quadratic term induced multicolinearity, distance from urban centers
was estimated as a dummy. The sample was post stratified
arbitrarily into nearly three equal groups: easy market access if the
household was located within a radius of less than 5 km (5 km was
considered a distance from urban centers within which a number of
different transportation modes (horse, oxen or walking, vehicle or
bicycle, etc) were possible, allowing flexibility in the choice of
transport, competition among transporters, competitive pricing and
hence fair prices. This would facilitate mobility among household
members from the nearest town (urban center) and difficult market
access if a household was located beyond 10 km from the urban
center. The omitted categories were households in the middle
market access group, located within a radius of 5 to 10 km.
The variable scale, that represented the scale of operations, was
also transformed into two dummies to account for nonlinearity and
improve the robustness of the estimates. The first dummy was
called beanhadum1, assigned a value equal to 1 , if a farm in the
Katungi et al.
483
Table 4. Input use in common bean production by farmer category in the study area of Ethiopia, 2008 (in parentheses are the standard
errors).
Variable
Land fallow (%)
Land allocated o common bean (ha)
Proportion of crop area occupied by beans
Area expansion during 2001-2007 (%)
Fertilizer use rate (%)
Fertilizer use intensity (kg/ha)
Adoption of improved varieties
Small farm (less than
2 ha) (N = 91)
3.3 (1.9)
0.53 (0.04)
0.35 (0.03)
41.76 (5.20)
48.35 (5.27)
48.35 (5.27)
18.68 (4.11)
Large farm
(> = 2 ha) N=82
6.2 (2.7)
1.30 (0.16)
0.36 (0.03)
56.10 5.51)
41.46 5.47)
41.46 5.47)
40.24 5.45)
Sample
(N =173)
4.6 (1.6)
0.91 (0.09)
0.35(0.02)
48.55 (3.81)
45.09 (3.79)
45.09 (3.79)
28.90 (3.46)
t-value
0.891
4.794***
0.395
1.893^
0.906
0.906
3.197***
Significance levels are denoted by one asterisk (^) at the 10% level, three asterisks (***) at the 1% level.
data had less than 0.5 ha of common bean while farms in the data
with more than 2 ha of bean were categorized into another dummy
variable called beanhadum3=1 (The stratification of the sample into
categories of scale of operation was arbitrary guided by the mean
of bean ha and the need to have enough observation in each
category). The omitted dummy variable was for farms with bean
area ranging from 0.5 to 2 ha.
RESULTS AND DISCUSSION
Land allocation to common bean in the study areas
The data summarized in Table 4 indicates that, land use
intensity in the study areas was high. Less than 7% of the
farmers practiced fallowing on their land, irrespective of
farm size and market access group. The results indicate
that, common bean is as important to small farmers, as it
is for larger farmers. The average land allocated to
common bean in a cropping season among the smaller
farms (landholding less than one hectare) was 0.34 ha,
which is about 33% of the total land under crops in
season. On the other hand, larger farmers (with more
than one hectare of landholding) allocated an average of
1.2 ha, about 36% of the crop area, to common bean.
Generally, a significant proportion of farms expanded
their area under common bean in the last five years in
response to the increased market opportunities. As
expected, the response was more substantial among
larger farms than small ones. The results in Table 4 also
show that, the use of improved varieties was higher on
large farms than on small farms. On the other hand, use
rate and intensity (kg/ha) of inorganic fertilizer on
common bean was independent of farm size and was low
on large farms as it was on small ones. This suggests
that, other factors other than population pressure were
responsible for its adoption.
Factors influencing use of productivity enhancing
inputs
Fertilizer use intensity
Fertilizer use intensity equation was estimated by a Tobit
maximum likelihood estimator and the total effect of each
explanatory variable was derived, according to the
Macdonald and Moffit decomposition procedure of 1980.
Results for the intensity of fertilizer are presented in
Table 5. Most of the hypothesized factors had the
expected signs except for labour input variables but these
were not statistically significant. Those significant were
access to credit, site specific variables and extension.
Credit had a positive effect, which is consistent with what
was reported from previous study (Negash, 2007). Most
farmers in Ethiopia are poor and access to credit
isimportant for their adoption of land enhancement and
expensive inputs. Furthermore, fertilizer distribution in
Ethiopia is mainly by government through extension in
form of credit (Byerlee et al., 2007). Credit and extension
had positive effects on both the probability and intensity
of fertilizer use. Farmers who accessed credit applied 52
kg/ha more fertilizers than those who did not, while
extension increased fertilizer use by 57 kg/ha.
After controlling of credit and extension, farmers close
to urban centers were also more likely to use inorganic
fertilizer than their counterparts in remote area, but the
overall marginal effect on fertilizer use was small
(estimated at 2.7 kg/ha less fertilizer for every 1 km away
from urban centers). Inclusion of the quadratic terms did
not show any evidence of a nonlinear relationship (the
inclusion of quadratic term induced multicolinearity, which
could have limited the observation of the relationship).
Although, the road network in the study region was fairly
well developed as compared to the rest of the country,
many farming communities were still inaccessible by road
during rainy season, which could inhibit easy access to
inputs. Farmers in Adama, close to the regional town and
those in Siraro were also more likely to use higher
fertilizer intensity than their counterparts in Adami Tuli.
Since Siraro is far away from the urban centers, this
result implies that, application of fertilizer may also be
driven by perception of poor soils, which could be worse
in Siraro where soils were more sandy than in other
regions also according to Gebeheyu, (Per.com), Siraro
has a long tradition of using fertilizers in their agriculture.
The coefficient was of the larger magnitude. The
484 Afr. J. Agric. Res.
Table 5. Tobit estimates for the factors affecting fertilizer use intensity in Oromia, Ethiopia.
Explanatory variables
Constant
Distance from homestead to the plot
Dummy for Adam
Dummy for Siraro
Extension
Age
Education
Credit
Value livestock
Value oxen
Distance
Dependants
No. of family members
No. of hired people
No. of communal workers
No. of observation
LR chi2(14)
Normalized
coefficient.
Std. Err.
t-value
-183.587
0.335
74.022
179.604
96.018
0.462
3.812
96.669
-0.002
0.005
-5.887
9.403
-3.300
2.636
-1.762
102
38.15
73.853
0.690
47.676
43.917
42.840
1.248
4.509
29.632
0.001
0.004
3.364
4.978
7.367
2.044
3.213
Probability chi2
Log likelihood
-2.49
0.49
1.55
4.09**
2.24*
0.37
0.85
3.26**
-1.7^
1.06
-1.75^
1.89^
-0.45
1.29
-0.55
0.0005
-285.96
expected
probability
Conditional
expected
intensity of use
Total effect
0.010
36.931
72.574
15.962
-0.136
1.756
24.777
-0.001
0.002
-2.230
2.715
-2.456
-0.068
-1.405
0.327
-13.716
1.442
41.504
0.620
0.084
26.841
0.000
-0.001
-0.517
2.917
3.469
1.715
0.394
0.337
23.215
74.017
57.466
0.484
1.840
51.618
-0.001
0.001
-2.747
5.632
1.013
1.647
-1.011
NB: Asterisks: **, * and ^ denote significance level 1, 5 and 10%, respectively.
econometric analysis revealed an increase of 74 kg/ha as
one moved from Adami Tuli to Siraro and of 23 kg/ha
from Adami Tuli to Adama sites. Fertilizer use intensity
also had expected signs with household assets (that is,
value of oxen and livestock). The effect of livestock was
negative, implying substitution effects between organic
and inorganic fertilizers. Finally, households with higher
number of dependants were more likely to use more
fertilizers, perhaps reflecting the effect of increase in the
consumption demand on common bean intensification
with fertilizer.
Improved varieties
A Probit model was used to estimate the factors that
influence the probability that, a randomly selected farmer
would plant improved varieties released after 1989. The
results are presented in Table 6. The estimated model
correctly classified 86% of the predictions in the data,
implying a good fit. A wide range of factors included in
the analysis had the expected signs, though few were
significant. Those significant were household assets,
renew of seed and farm size and the number of
dependants.
Household wealth represented by the value of oxen
and other farm implements was positively related to the
use of new varieties while physical assets in form of
livestock showed negative correlation with adoption of
new varieties. The magnitude of the coefficients was too
small to derive any meaningful causal relationship.
However, after controlling these household assets and
other variables, the probability of planting improved
varieties was found to be higher on larger farms than on
small farms, confirming that adoption of bean varieties
began on large farms, which is consistent with the works
of other authors Feder and Omara (1981), Feder and
Umali, 1993). Larger farms may have been in the position
to access information and seed than small farmers.
Education and extension had the expected positive signs
but were not statistically significant. The use of improved
varieties was also not related with market access. Unlike
the case of fertilizer, higher number of dependants in a
household was negatively correlated with the use of
improved varieties, perhaps capturing the risk enhancing
effect, when it comes to improved varieties. Finally, the
results also indicated that farmers that regularly renewed
their seed and acquired seed from sources outside the
farm, were also likely to have accessed new varieties and
adopted them.
Determinants of yield
Results of the production function estimation are shown
in Table 7. The econometric results showed the
production response to different inputs and determinants
for common bean in Ethiopia. Conventional inputs (that is
labour, seeding rate and fertilizer) had positive signs as
expected, which is consistent with the theory. Labour had
a positive but small effect that was not statistically
significant. The seeding rate had a positive and
significant marginal effect on common bean yield. An
Katungi et al.
485
Table 6. Factors influencing the probability of improved common bean variety use in Oromia of Ethiopia, 2008.
Variable
Dummy Adam
Dummy Siraro
Extension
Gender
Education
Credit (Units)
Seed renewal (units)
Land holding (units)
Value of livestock (units)
Value of Oxen (Units)
Value of other farm implements (units)
Distance (km)
Number of dependants
Constant
Obs. P
Pred. P
LR chi2(13)
Prob > chi2
Log likelihood
2
Pseudo R
dF/dx
0.136
-0.124
0.089
-0.134
0.008
0.063
0.246
0.074
-0.00003
0.00005
0.00002
0.001
-0.033
-1.191
0.295
0.124
67.88
0.00
-46.177
0.424
Standard deviation
0.126
0.088
0.115
0.182
0.010
0.078
0.130
0.024
1.0E-05
1.5E-05
1.1E-05
0.009
0.015
0.706
Z
1.17
-1.22
0.88
-0.87
0.7
0.89
2.36**
3.13***
-2.56***
2.33**
2.12**
0.06
-2.38**
-1.69^
P>z
0.244
0.222
0.379
0.382
0.482
0.372
0.018
0.002
0.01
0.02
0.034
0.949
0.017
0.092
Significance levels are denoted by one asterisk (^) at the 10 % level, two asterisks (**) at the 5 % level, three asterisks (***) at the 1% level.
interaction term of fertilizer and seed was also included
and it showed a positive effect on yield. This means that
when there was zero fertilizer use and seeding rate was
increased, yield also increased. The quadratic term of
seeding rate was negative and significant but excluded
due to multicolinearity. The significance of the interaction
terms also showed that increase in fertilizer intensity was
more productive when seeding rate was also higher. On
average, each farmer applied 62 kg of seed per hectare
which was low compared to what has been reported as
recommended seeding rate under broad casting method
(Negash, 2007). High variability in the seeding rate was
also noted across farms, implying that there was still
room for improving yields, if these problems are
overcome. As a matter of fact, 1 kg increase in the
amount of seed planted per hectare produced 0.5%
increase in yield, which translated to 4.5% yield increase
for a 10 kg increase in the amount of seed planted per
hectare, after accounting for the increase at a decreasing
rate of 0.05%. This study did not examine the causes of
low seeding rate but it could be due to seed constraints
or low knowledge on the proper seeding rate.
The effect of organic fertilizers, represented by the
value of livestock was also positive. The estimated
coefficient of improved varieties was positive but not
significant, perhaps due to the generally low adoption
rates of the data. The effect of scale on yield was
captured through two dummy variables, representing very
small scale (less than 0.5 ha and large scale, more than
2 ha). The very small scale farms and large scale farm,
showed statistical significant effect on yield. Yield was
highest on the very small farms (less than 0.5 ha) and
lowest on the large scale farms.
The effect of market access on yield was estimated
using two dummy variables defined in Table 3. Both the
coefficients on the dummy, for easy access and difficult
access, had a negative sign but only the coefficient for
difficult access was statistically significant at 1% level.
This is an interesting finding and it suggests that market
access exhibited other effects beyond intensification
effects. This means that farmers far away from urban
centers (beyond 15 km radius) specialize less in common
bean. Common bean is one of the preferred commercial
crops in the study area and any improvements in market
access are likely to encourage the specialization effects
that will enhance productivity. This shows that
government investment in infrastructural development will
create additional benefits from common bean.
CONCLUSIONS AND POLICY IMPLICATIONS
The study used the household survey data to identify
factors that facilitate growth on common bean productivity
and input use in Ethiopia at a micro level. The
contribution of land enhancing technologies (that is,
fertilizers and improved varieties) on the productivity was
evaluated, using an instrumental variable approach in a
486
Afr. J. Agric. Res.
Table 7. Ordinary least square estimates of determinants of common bean yield in Oromia of Ethiopia, 2008.
Variable
Constant
Dummy for scale less 0.5 ha
Dummy for scale greater than2 ha
Dummy for sites >15km away from urban centers
Dummy for sites <5km away from urban center
Labour
Value of livestock
Extension
Education
Amount of seed planted /ha
improved varieties
Interaction term for seed and fertilizer
Fertilizer
Number of observations
F( 12, 84)
Prob > F
R-squared
Adj R-squared
Root MSE
Coefficient
6.1466
0.4489
-0.6821
-1.724
-0.2161
0.0667
0.00001
0.2861
0.03334
0.00484
0.1459
0.00003
-0.0021
97
6.19
0
0.4694
0.3936
0.65958
Standard error
0.265
0.2012
0.2479
0.5279
0.1685
0.0572
3.64E-06
0.2231
0.0214
0.0020
0.2994
8.59E-06
0.0026
T
23.19**
2.23*
-2.75**
-3.27**
-1.28
1.16
3.21**
1.28
1.56
2.46*
0.49
3.01**
-0.84
P>t
0
0.028
0.007
0.002
0.203
0.248
0.002
0.203
0.123
0.016
0.627
0.003
0.405
Significance levels are denoted by one asterisk (*) at the 5 % level, two asterisks (**) at the 1% level.
two-stage least squares regression. The study findings
showed
that
following
the
liberalization
and
improvements in market incentives, majority of farmers
responded by increasing the area under common bean
but the use of land enhancing technologies, such as
fertilizer and improved varieties remained low. This raised
the concern of long term effect on soil nutrient depletion,
particularly among small farmers who do not own
sufficient numbers of livestock (averaged at a value of
ETB. 5556 per farmer) to provide organic manures.
The study confirms poor market access and labour
constraints as a key factor constraining fertilizer use,
indirectly inhibiting productivity growth in common bean in
Ethiopia. Also, demand was still low due to high levels of
poverty in a high risk production environment. Currently,
farmer’s ability to overcome liquidity constraints and
absorb the consequences of risk occurrence is an
important factor that facilitates intensification and
productivity growth, in common bean. This means that
government intervention with insurance programmes that
help people smoothen their consumption could reduce
risks and enhance the use of improved inputs such as
improved seed. The positive effect of credit in fertilizer
use and productivity supports this conclusion but the
current access is still limited.
In addition to the intensification effects, market
specialization effects also emerged from the analysis;
common bean yield was lower in sites very far away from
urban centers. This suggests that locations far away from
urban centers and with low access to markets generally,
may be involved in many activities to meet their subsistence
needs and may not have benefited from the
specialization effects. Institutional factors also played a
very important role. Both access to credit and access to
extension had large and significant effects on fertilizer
use and productivity. However, access to both extension
and credit was still limited in scope. Given the
government budget constraints, expansion was not
feasible. Hence, there is need to explore innovative ways,
that can complement the government efforts, in
increasing information and credit access by farmers.
Complementary effects between fertilizer and seeding
rate also emerged from the analysis, implying that
promoting common bean land enhancing technologies as
a package would encourage input use and productivity.
Finally, the study suggests that, there is a big need to
increase yield, using the existing technologies and
knowledge dissemination. Investment in innovations that
reduce seed and knowledge constraints will boost the
technical efficiency and common bean productivity.
REFERENCES
Abu Muhammad Shajaat Ali (1995). Population pressure, environmental
constraints and agricultural change in Bangladesh: examples from
three agro ecosystems. Agric. Ecosyst. Environ., 55: 95-109.
Allison DP (1999). Multiple regression: A Primer, Pine Forge Press, Inc.
Alemu D, Bekele A (2005). Evaluating the marketing opportunity for the
Ethiopian beans.
Byerlee D, David J, Spielman DA, Madhur G (2007). Policies to promote
cereal intensification in Ethiopia: A review of evidence and
experience. IFPRI Discussion Paper 00707.
Boserup E (1965). The conditions of agricultural growth: The economics
Katungi et al.
of agrarian change under population pressure. Allen and Unwin,
London, p. 118.
David S (1998). Producing bean seed: Hand books for small-scale bean
producers. Handbook 1. Network on Bean Research in Africa,
Occasional Publications Series, No.29, CIAT, Kampala, Uganda.
David S, Sperling L (1999). Improving technology delivery mechanisms:
lessons from bean seed systems research in Eastern and Central
Africa. Agric. Hum. Values, 6: 381-388.
Debertin LD (1992). Agricultural production economics. Second Edition
Feder G, O’Mara GT (1981). Farm size and the diffusion of green
revolution technology. Econ. Dev. Cult. Change, 30(1): 59-76.
Feder G, Just RE, Zilberman D (1985). Adoption of agricultura
innovations in developing countries: A Survey. Econ. Dev. Cult.
Change, 33: 255-298.
Feder G, Umali D (1993). The adoption of agricultural innovations: A
review. Tech. Forecasting and Soc. Change, 43: 215-239.
FAO (1986). Highlands Reclamation Study Ethiopia Final Report. Vol. I
& II. Rome, Italy.
Gabre-Madhin E (2001). Market institutions, transaction costs and
social capital in the Ethiopian grain market. IFPRI Research report, p.
124.
Green W (2000). Econometric analysis. Fourth Edition, Prentice Hall,
Upper Saddle River, New Jersey.
Kalyebara R, Andima D (2006). The impact of improved bean
technologies in Africa. Evaluation report submitted to the PABRA
Steering Committee, Lumbumbashi, DRC, 27-29 March 2006.
Kalyebara R, Andima D, Kirkby R, Buruchara (2008). Improved Bean
Varieties and Cultivation Practices in Eastern-Central Africa.
Economic and Social Benefits. Centro Internacional de Agricultura
Tropical - CIAT. Cali, Colombia.
Kamara AB (2004). The impact of market access on input use and
agricultural productivity: Evidence from Machakos district, Kenya.
Agrekon, pp. 43-52.
487
Knight J, Weir S, Woldehanna T (2003). The role of education in
facilitating risk-taking and innovation in agriculture. J. Dev. Stud.,
39(6): 1–22.
Legesse DG, Kumssa T, Assefa M,Taha J, Gobena T, Alemaw A,
Abebe YM Terefe H (2006). Production and Marketing of White Pea
Beans in the Rift Valley, Ethiopia. A Sub-Sector Analysis. National
Bean Research Program of the Ethiopian Institute of Agricultural
Research, UnPublished report.
Mellor JW (1969). The subsistence farmer in traditional economies. In:
C.R. Wharton Jr. (Editor), subsistence agriculture and economic
development. Aldine, Chicago, IL.
Mulatu R (1987). Nazret mixed farming zone diagnostic survey report.
Shewa region. Research report No.2. Department of agricultural
economics and farming systems research. Institute of agriculture
research Nazret research centre.
Negash R (2007). Determinants of adoption of improved haricot bean
production package in Alaba special woreda, southern Ethiopia. Msc.
Thesis, Haramaya University.
Schultz T (1964). Transforming traditional agriculture. Yale University,
New Haven.
Tiffen M, Mortimore M, Gichuki F (1994). More People, Less Erosion:
Environmental Recovery in Kenya. London: John Wiley and Sons.
Weir S, Knight J (2004). Externality effects of education: Dynamics of
the adoption and diffusion of an innovation in rural Ethiopia.
University of Chicago.
Wooldridge WJ (2002). Econometric analysis of cross section and panel
data. Massachusetts Institute of Technology.
World
Bank
(2008).
Ethiopia
country
Profile
at
http//:www.worldbank.org.