macroeconomic mcgrowhill macro ch 1 appendix 19e use this one
Bạn đang xem bản rút gọn của tài liệu. Xem và tải ngay bản đầy đủ của tài liệu tại đây (97.82 KB, 14 trang )
01A
McGraw-Hill/Irwin
Appendi
x
Limits, Alternatives, and
Choices
Copyright © 2012 by The McGraw-Hill Companies, Inc. All rights reserved.
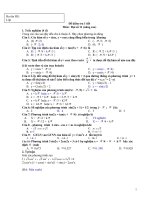
Construction of a Graph
Graph
Table
Income
Consumption
Point
$ 0
$ 50
a
100
100
b
200
150
c
300
200
d
400
250
e
Consumption (C)
$400
300
e
c
100
0
LO7
d
200
b
a
$100
200
300
400
Income (Y)
1-2
Direct and Inverse Relationships
• Direct relationship
•
LO7
Both variables move up or down
together
1-3
Direct and Inverse Relationships
• Inverse relationship
•
LO7
Variables move opposite of each
other
1-4
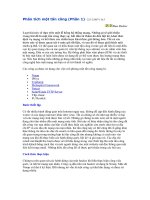
Slope of a Line
• Positive slope of a straight line
Vertical Change
+50
1
Slope =
=
= = 0.5
Horizontal Change +100 2
Consumption (C)
$400
300
200
100
0
LO7
50 Vertical
Change
100
Horizontal Change
$100
200
300
Income (Y)
400
1-5
Slope of a Line
Ticket Price
$50
40
30
20
10
0
LO7
Attendance,
thousands
0
4
8
12
16
20
1-6
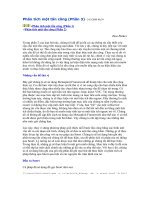
Slope of a Line
• Negative slope of a straight line
Vertical Change
-10
Slope =
=
=
Horizontal Change
+4
-2
1
=
2
-2.5
50
Ticket Price $
40
30
Vertical
20 Change -10
4
10
Horizontal Change
4
8
12
Attendance
LO7
16
20
1-7
Slope of a Line
LO7
•
Slopes and measurement
units
•
Slopes and marginal
analysis
•
Infinite and zero slopes
1-8
Slope =
Infinite
Purchases of watches
LO7
Consumption
Price of Bananas
Slope of a Line
Slope = Zero
Divorce Rate
1-9
Equation of a Linear Relationship
•
y = a + bx
•
•
•
•
LO7
y is the dependent variable
a is the vertical intercept
b is the slope of the line
x is the independent variable
1-10
Equation of a Line
Consumption (C)
Y = 50 + .5C
$400
300
200
100
0
LO7
$100
200
300
Income (Y)
400
1-11
Equation of a Line
P = 50 – 2.5Q
50
Ticket Price
40
30
20
10
4
8
12
16
20
Attendance
LO7
1-12
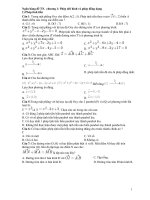
Slope of a Nonlinear Curve
•
•
LO7
Slope always changes
Must use a line tangent to the
curve to find slope at that point
1-13
Slope of a Nonlinear Curve
• Use tangent lines to find the slope
20
15
10
5
0
5
LO7
10
15
20
1-14