macroeconomic mcgrowhill macro ch 3 19e use this one
Bạn đang xem bản rút gọn của tài liệu. Xem và tải ngay bản đầy đủ của tài liệu tại đây (490.97 KB, 60 trang )
03
Demand, Supply and Market
Equilibrium
McGraw-Hill/Irwin
Copyright © 2012 by The McGraw-Hill Companies, Inc. All rights reserved.
Chapter Objectives
Markets
Demand Defined
Demand Graphed
Changes in Deman
d
Supply Defined
Supply Graphed
Changes in Supply
Equilibrium
Surpluses
Shortages
Key Terms
Previous
Slide
Next
Slide
• Demand and its determinants
• Supply and its determinants
• Supply, demand, & market
equilibrium
• Changes in supply and
demand
• Government-set prices
End
Show
3-2
Copyright McGraw-Hill/Irwin, 2005
3-2
MARKETS DEFINED
Markets
Demand Defined
Demand Graphed
Changes in Deman
d
Supply Defined
Supply Graphed
Changes in Supply
Equilibrium
Surpluses
POTENTIAL
BUYERS
Shortages
Key Terms
Previous
Slide
End
Show
3-3
Next
Slide
POTENTIAL
SELLERS
MARKETS
Copyright McGraw-Hill/Irwin, 2005
A Market
Markets
Demand Defined
Demand Graphed
Changes in Deman
d
Supply Defined
Supply Graphed
Changes in Supply
Equilibrium
Surpluses
Shortages
Key Terms
Previous
Slide
Next
Slide
• Interaction between buyers
and sellers
• Buyers demand goods
• Sellers supply goods
• Assumptions
– Standardized good
– Competitive market
End
Show
3-4
Copyright McGraw-Hill/Irwin, 2005
3-4
DEMAND DEFINED
Markets
DEMAND SCHEDULE
Demand Defined
Demand Graphed
Changes in Deman
d
Supply Defined
Supply Graphed
Changes in Supply
Equilibrium
Surpluses
Shortages
Key Terms
Previous
Slide
End
Show
3-5
Next
Slide
P
$5
4
3
2
1
QD
10
20
35
55
80
Various Amounts
A Series of Possible Prices
…a specified time period
…other things being equal
Copyright McGraw-Hill/Irwin, 2005
LAW OF DEMAND
Markets
Demand Defined
Demand Graphed
Changes in Deman
d
Supply Defined
Supply Graphed
Changes in Supply
Equilibrium
Surpluses
Shortages
Key Terms
Previous
Slide
End
Show
3-6
Next
Slide
An inverse relationship exists
between price and quantity
demanded
• As Price Falls…
…Quantity Demanded Rises
• As Price Rises…
…Quantity Demanded Falls
Copyright McGraw-Hill/Irwin, 2005
LAW OF DEMAND
Markets
Demand Defined
Demand Graphed
Changes in Deman
d
• Diminishing Marginal Utility
Supply Defined
Supply Graphed
Changes in Supply
Equilibrium
Surpluses
Shortages
Key Terms
Previous
Slide
Next
Slide
End
Show
3-7
Copyright McGraw-Hill/Irwin, 2005
LAW OF DEMAND
Markets
Demand Defined
Demand Graphed
Changes in Deman
d
Supply Defined
Supply Graphed
• Diminishing Marginal Utility
• Income Effect
Changes in Supply
Equilibrium
Surpluses
Shortages
Key Terms
Previous
Slide
Next
Slide
End
Show
3-8
Copyright McGraw-Hill/Irwin, 2005
LAW OF DEMAND
Markets
Demand Defined
Demand Graphed
Changes in Deman
d
Supply Defined
Supply Graphed
Changes in Supply
Equilibrium
• Diminishing Marginal Utility
• Income Effect
• Substitution Effect
Surpluses
Shortages
Key Terms
Previous
Slide
Next
Slide
End
Show
3-9
Copyright McGraw-Hill/Irwin, 2005
LAW OF DEMAND
Markets
Demand Defined
Demand Graphed
Changes in Deman
d
Supply Defined
Supply Graphed
Changes in Supply
Equilibrium
Surpluses
Shortages
Key Terms
Previous
Slide
End
Show
3 - 10
Next
Slide
•
•
•
•
•
Diminishing Marginal Utility
Income Effect
Substitution Effect
Demand Curve
Individual and Market
Demand
Copyright McGraw-Hill/Irwin, 2005
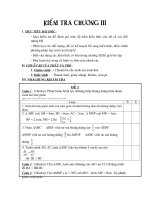
Market Demand
Market Demand for Corn, Three Buyers
Price
per bushel
Joe
Jen
Jay
Total
Qd
per week
$5
10
12
8
30
4
20
23
17
60
3
35
39
26
100
2
55
60
39
154
1
80
87
54
221
Quantity Demanded
LO1
3-11
GRAPHING DEMAND
Price of Corn
Markets
P
Demand Defined
Demand Graphed
Changes in Deman
d
Supply Defined
Supply Graphed
Changes in Supply
Equilibrium
Surpluses
Shortages
Key Terms
Previous
Slide
End
Show
3 - 12
Next
Slide
CORN
P
$5
4
3
2
1
QD
10
20
35
55
80
$5
Plot the Points
4
3
2
1
o
10 20 30 40 50 60 70 80
Quantity of Corn
Copyright McGraw-Hill/Irwin, 2005
Q
GRAPHING DEMAND
Price of Corn
Markets
P
Demand Defined
Demand Graphed
Changes in Deman
d
Supply Defined
Supply Graphed
Changes in Supply
Equilibrium
Surpluses
Shortages
Key Terms
Previous
Slide
End
Show
3 - 13
Next
Slide
CORN
P
$5
4
3
2
1
QD
10
20
35
55
80
$5
Plot the Points
4
3
2
1
o
10 20 30 40 5055 60 70 80
Quantity of Corn
Copyright McGraw-Hill/Irwin, 2005
Q
GRAPHING DEMAND
Price of Corn
Markets
P
Demand Defined
Demand Graphed
Changes in Deman
d
Supply Defined
Supply Graphed
Changes in Supply
Equilibrium
Surpluses
Shortages
Key Terms
Previous
Slide
End
Show
3 - 14
Next
Slide
CORN
P
$5
4
3
2
1
QD
10
20
35
55
80
$5
Plot the Points
4
3
2
1
o
10 20 30 40 50 60 70 80
35
Quantity of Corn
Copyright McGraw-Hill/Irwin, 2005
Q
GRAPHING DEMAND
Price of Corn
Markets
P
Demand Defined
Demand Graphed
Changes in Deman
d
Supply Defined
Supply Graphed
Changes in Supply
Equilibrium
Surpluses
Shortages
Key Terms
Previous
Slide
End
Show
3 - 15
Next
Slide
CORN
P
$5
4
3
2
1
QD
10
20
35
55
80
$5
Plot the Points
4
3
2
1
o
10 20 30 40 50 60 70 80
Quantity of Corn
Copyright McGraw-Hill/Irwin, 2005
Q
GRAPHING DEMAND
Price of Corn
Markets
P
Demand Defined
Demand Graphed
Changes in Deman
d
Supply Defined
Supply Graphed
Changes in Supply
Equilibrium
Surpluses
Shortages
Key Terms
Previous
Slide
End
Show
3 - 16
Next
Slide
CORN
P
$5
4
3
2
1
QD
10
20
35
55
80
$5
Plot the Points
4
3
2
1
o
10 20 30 40 50 60 70 80
Quantity of Corn
Copyright McGraw-Hill/Irwin, 2005
Q
GRAPHING DEMAND
Price of Corn
Markets
P
Demand Defined
Demand Graphed
Changes in Deman
d
Supply Defined
Supply Graphed
Changes in Supply
Equilibrium
Surpluses
Shortages
Key Terms
Previous
Slide
End
Show
3 - 17
Next
Slide
CORN
P
$5
4
3
2
1
QD
10
20
35
55
80
$5
Connect the Points
4
3
2
1
o
D
10 20 30 40 50 60 70 80
Quantity of Corn
Copyright McGraw-Hill/Irwin, 2005
Q
GRAPHING DEMAND
Price of Corn
Markets
P
Demand Defined
Demand Graphed
Changes in Deman
d
Supply Defined
Supply Graphed
Changes in Supply
Equilibrium
Surpluses
Shortages
Key Terms
Previous
Slide
End
Show
3 - 18
Next
Slide
CORN
P
$5
4
3
2
1
QD
10
20
35
55
80
$5
What if
Demand
Increases?
4
3
2
1
o
D
10 20 30 40 50 60 70 80
Quantity of Corn
Copyright McGraw-Hill/Irwin, 2005
Q
GRAPHING DEMAND
Price of Corn
Markets
P
Demand Defined
Demand Graphed
Changes in Deman
d
Supply Defined
Supply Graphed
Changes in Supply
Equilibrium
Surpluses
Shortages
Key Terms
Previous
Slide
End
Show
3 - 19
Next
Slide
CORN
P
$5
4
3
2
1
$5
QD
4
1030
20403
3560
Increase
2
5580
in
80+
1
Demand
o
Increase
in Quantity
Demanded
10 20 30 40 50 60 70 80
Quantity of Corn
Copyright McGraw-Hill/Irwin, 2005
D’
D
Q
GRAPHING DEMAND
Price of Corn
Markets
P
Demand Defined
Demand Graphed
Changes in Deman
d
Supply Defined
Supply Graphed
Changes in Supply
Equilibrium
Surpluses
Shortages
Key Terms
Previous
Slide
End
Show
3 - 20
Next
Slide
CORN
P
$5
4
3
2
1
QD
10
20
35
55
80
$5
What if
Demand
Decreases?
4
3
2
1
o
D
10 20 30 40 50 60 70 80
Quantity of Corn
Copyright McGraw-Hill/Irwin, 2005
Q
GRAPHING DEMAND
Price of Corn
Markets
P
Demand Defined
Demand Graphed
Changes in Deman
d
Supply Defined
Supply Graphed
Changes in Supply
Equilibrium
Surpluses
Shortages
Key Terms
Previous
Slide
End
Show
3 - 21
Next
Slide
CORN
P
$5
4
3
2
1
$5
QD
4
10-10 3
20
20
35
40 2 Decrease
55
60
80
in
Decrease
in Quantity
Demanded
1
Demand
o
10 20 30 40 50 60 70 80
Quantity of Corn
Copyright McGraw-Hill/Irwin, 2005
D
D’
Q
Markets
Demand Defined
Demand Graphed
Changes in Deman
d
Supply Defined
Supply Graphed
Changes in Supply
Equilibrium
Shortages
Key Terms
End
Show
3 - 22
– Normal (Superior) & Inferior Goods
• Prices of Related Goods
Surpluses
Previous
Slide
DETERMINANTS OF
DEMAND
• Tastes
• Number of Buyers
• Income
Next
Slide
– Substitutes & Complements
– Unrelated Goods
• Expectations
Copyright McGraw-Hill/Irwin, 2005
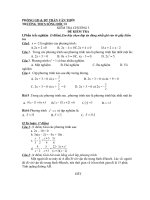
Determinants of Demand
Table 3.1 Determinants of Demand: Factors That Shift the Demand Curve
Determinant
Examples
Change in buyers’ tastes
Physical fitness rises in popularity, increasing the
demand for jogging shoes and bicycles; cell phone
popularity rises, reducing the demand for land-line
phones.
Change in the number of buyers
A decline in the birthrate reduces the demand for
children’s toys.
Change in income
A rise in incomes increases the demand for normal
goods such as restaurant meals, sports tickets, and
necklaces while reducing the demand for inferior
goods such as cabbage, turnips, and inexpensive
wine.
Change in the prices of related
goods
A reduction in airfares reduces the demand for bus
transportation (substitute goods); a decline in the price
of DVD players increases the demand for DVD movies
(complementary goods).
Change in consumer expectations
Inclement weather in South America creates an
expectation of higher future coffee bean prices,
thereby increasing today’s demand for coffee beans.
LO1
3-23
Determinants of Demand
• Consumer taste and preference is a
powerful determinant….
– Consider Subliminal Advertising (see Video)
SUPPLY DEFINED
Markets
Demand Defined
Demand Graphed
Changes in Deman
d
Supply Defined
SUPPLY SCHEDULE
Various Amounts
Supply Graphed
Changes in Supply
Equilibrium
Surpluses
Shortages
Key Terms
Previous
Slide
End
Show
3 - 25
Next
Slide
Copyright McGraw-Hill/Irwin, 2005
CORN
P QS
$1 5
2 20
3 35
4 50
5 60