Break even analysis
Bạn đang xem bản rút gọn của tài liệu. Xem và tải ngay bản đầy đủ của tài liệu tại đây (2.47 MB, 21 trang )
Nikolaos Tsorakidis, Sophocles Papadoulos, Michael Zerres,
Cristopher Zerres
Break-Even Analysis
2
Download free eBooks at bookboon.com
Break-Even Analysis
1st edition
© 2014 Nikolaos Tsorakidis, Sophocles Papadoulos, Michael Zerres, Cristopher Zerres &
bookboon.com
ISBN 978-87-7681-290-4
3
Download free eBooks at bookboon.com
Break-Even Analysis
Contents
Contents
1
Introduction
5
2
Simple Break-Even Point Application
6
3
Restrictions
8
4
Multiproduct Break-Even Point
9
5
Applying Break-Even Analysis in Services Industry
11
6
Operating Leverage
14
7
Discounts and Promotions
19
8
Conclusion
20
Bibliography
21
www.sylvania.com
We do not reinvent
the wheel we reinvent
light.
Fascinating lighting offers an ininite spectrum of
possibilities: Innovative technologies and new
markets provide both opportunities and challenges.
An environment in which your expertise is in high
demand. Enjoy the supportive working atmosphere
within our global group and beneit from international
career paths. Implement sustainable ideas in close
cooperation with other specialists and contribute to
inluencing our future. Come and join us in reinventing
light every day.
Light is OSRAM
4
Download free eBooks at bookboon.com
Click on the ad to read more
Break-Even Analysis
Introduction
1 Introduction
Break-Even analysis is used to give answers to questions such as “what is the minimum level of sales that
ensure the company will not experience loss” or “how much can sales be decreased and the company
still continue to be proitable”. Break-even analysis is the analysis of the level of sales at which a company
(or a project) would make zero proit. As its name implies, this approach determines the sales needed
to break even.
Break-Even point (B.E.P.) is determined as the point where total income from sales is equal to total expenses
(both ixed and variable). In other words, it is the point that corresponds to this level of production
capacity, under which the company operates at a loss. If all the company’s expenses were variable, breakeven analysis would not be relevant. But, in practice, total costs can be signiicantly afected by longterm investments that produce ixed costs. herefore, a company – in its efort to produce gains for its
shareholders – has to estimate the level of goods (or services) sold that covers both ixed and variable costs.
Break-even analysis is based on categorizing production costs between those which are variable (costs
that change when the production output changes) and those that are ixed (costs not directly related
to the volume of production). he distinction between ixed costs (for example administrative costs,
rent, overheads, depreciation) and variable costs (for exampel production wages, raw materials, sellers’
commissions) can easely be made, even though in some cases, such as plant maintenance, costs of utilities
and insurance associated with the factory and production manager’s wages, need special treatment. Total
variable and ixed costs are compared with sales revenue in order to determine the level of sales volume,
sales value or production at which the business makes neither a proit nor a loss.
5
Download free eBooks at bookboon.com
Break-Even Analysis
Simple Break-Even Point Application
2 Simple Break-Even
Point Application
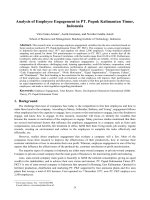
B.E.P. is explained in the following example, the case of Best Ltd. his company produces and sells quality
pens. Its ixed costs amount to €400,000 approximately, whereas each pen costs €12 to be produced. he
company sells its products at the price of €20 each. he revenues, costs and proits are plotted under
diferent assumptions about sales in the break-even point graph presented below. he horizontal axis
shows sales in terms of quantity (pens sold), whereas expenses and revenues in euros are depicted in
vertical axis. he horizontal line represents ixed costs (€400,000). Regardless of the items sold, there
is no change in this value. he diagonal line, the one that begins from the zero point, expresses the
company’s total revenue (pens sold at €20 each) which increases according to the level of production.
he other diagonal line that begins from €400,000, depicts total costs and increases in proportion to
the goods sold. his diagonal shows the cost efect of variable expenses. Revenue and total cost curves
cross at 50,000 pens. his is the break even point, in other words the point where the irm experiences
no proits or losses. As long as sales are above 50,000 pens, the irm will make a proit. So, at 20,000
pens sold company experiences a loss equal to €240,000, whereas if sales are increased to 80,000 pens,
the company will end up with a €240,000 proit.
he following table shows the outcome for diferent quantities of pens sold (Diagram 1):
Pens Sold (Q)
20,000
50,000
80,000
Total Sales (S)
€400,000
€1,000,000
€1,600,000
Variable Costs (VC)
€240,000
€600,000
€960,000
Contribution Margin (C.M.)
€160,000
€400,000
€640,000
Fixed Costs (FC)
€400,000
€400,000
€400,000
Proit / (Loss)
(€240,000)
€0
€240,000
Diagram 1: Diferent quantities of pens sold
he break-even point can easily be calculated. Since the sales price is €20 per pen and the variable
cost is €12 per pen, the diference per item is €8. his diference is called the contribution margin per
unit because it is the amount that each additional pen contributes to proit. In other words, each pen
sold ofers €8 in order to cover the ixed expenses. In our example, ixed costs incurred by the irm are
€400,000 regardless of the number of sales. As each pen contributes €8, sales must reach the following
level to ofset the above costs (Diagram 2):
6
Download free eBooks at bookboon.com
Break-Even Analysis
Simple Break-Even Point Application
Diagram 2: Break-Even Point Graph
Fixed Costs
Selling Price - VC (u)
Fixed Costs
Contributi on Margin
€ 400000
€8
50000 pens (B.E.P)
hus, 50,000 pens is the B.E.P. required for an accounting proit.
Break-even analysis can be extended further by adding variables such as tax rate and depreciation to
our calculations In any case, it is a useful tool because it helps managers to estimate the outcome of
their plans. his analysis calculates the sales igure at which the company (or a single project) breaks
even. herefore, a company uses it during the preparation of annual budget or in cases of new product
development. he B.E.P. formula can be also used in the case where a company wants to specify the
exact volume of sold items required to produce a certain level of proit.
Finally, the marketing-controlling departments of an enterprise may use break-even analysis to estimate
the results of an increase in production volume or when evaluating the option of investing in new, high
technology machinery. In that case, the irm may operate more automatically, fewer workers will be
needed and what inally happens is that variable costs are substituted by ixed ones. his will be examined
later in this chapter.
7
Download free eBooks at bookboon.com
Break-Even Analysis
Restrictions
3 Restrictions
Beside its useful applications, break-even analysis is subject to some restrictions. In every single estimation
of the break-even level, we use a certain value to the variable “selling price”. herefore, if we want to
ind out the level that produces proits under diferent selling prices, many calculations and diagrams
are required.
A second drawback has to do with the variable “total costs”, since in practice these costs are diicult to
calculate due to the fact that there are many things that can go wrong and mistakes that can occur in
production. During estimations, if sales increase and output reaches a level that is marginally covered
by current investments in ixed assets, labor cost will be increased (recruiting of new employees or
increase in overtime costs) and consequently variable costs will grow. Ater a point, new investments
in ixed assets must be realized too. he above afect the production and change both the level and the
inclination of the total costs’ line in B.E.P. graph.
Another afect that is not algebraically measured, is that changes in costs may alter products’ quality.
Also, the break-even point is not easily estimated in the “real world”, because there is no in mathematical
calculation that allows for the “competitive environment”. his refers to the fact that the competition
may cause prices to drop or increase according to demand.
360°
thinking
.
Discover the truth at www.deloitte.ca/careers
8
Download free eBooks at bookboon.com
© Deloitte & Touche LLP and affiliated entities.
Click on the ad to read more
Break-Even Analysis
Multiproduct Break-Even Point
4 Multiproduct Break-Even Point
When B.E.P. of a single product is calculated, sales price corresponds to the price of this product. However,
in reality irms sell many products. It is easily understood that when diferent products are ofered by
a company, the estimation of the values of variables used in B.E.P. formula (sales price, variable costs)
becomes a complicated issue, since the weighted average of these variables has to be computed.
An important assumption in a multiproduct setting is that the sales mix of diferent products is known
and remains constant during the planning period. he sales mix is the ratio of the sales volume for the
various products. To illustrate, let’s look at Quick Cofee, a cafeteria that sells three types of hot drinks:
white/black cofee, espresso and hot chocolate.
he unit selling price for these three hot drinks are €3, €3.5 and €4 respectively. he owner of this
café wants to estimate its break-even point for next year. An important assumption we have to make
is that current sales mix will not change next year. In particular, 50% of total revenue is generated by
selling classic cofee, while espresso and hot chocolate corresponds to 30% and 20% of total revenues
respectively. At the same time, variable costs amount to €0.5 (white/black cofee), €0.6 (espresso) and
€0.7 (hot chocolate). We have to compute the weighted average for these two variables, selling price and
variable costs (Diagram 3):
PRODUCT
PRICE (€)
PROPORTIONAL TO TOTAL
REVENUE
WEIGHTED
AVERAGE
COFFEE
3.0
50%
ESPRESSO
3.5
30%
HOT CHOCOLATE
4.0
20%
3.35
PROPORTIONAL TO
TOTAL REVENUE
WEIGHTED
AVERAGE
PRODUCT
VARIABLE COST (€)
COFFEE
0.5
50%
ESPRESSO
0.6
30%
HOT CHOCOLATE
0.7
20%
0.57
Diagram 3: Weighted Average for some products
Applying the B.E.P. formula – company’s ixed costs are €55,000 – gives us 19,784 units.
B.E.P. = €55,000 / (€3.35 – €0.57) = 19,784 units.
9
Download free eBooks at bookboon.com