Applying Technical Analysis Elliot Waves
Bạn đang xem bản rút gọn của tài liệu. Xem và tải ngay bản đầy đủ của tài liệu tại đây (2.11 MB, 182 trang )
GET
Applying Technical Analysis
T-1
Applying Technical
Analysis
Updated Feb 99
GET
Applying Technical Analysis
T-2
The information presented in this manual is con-
fidential and proprietary to Tom Joseph and Trad-
ing Techniques, Inc.. This information cannot
be used, disclosed, or duplicated, without the
prior written consent of Tom Joseph or Trading
Techniques, Inc.. This work is protected by the
Federal Copyright laws and no unauthorized
copying, adaptation or distribution is permitted.
The material represented in the GET computer
software, the GET User's Guide, Technical Sec-
tion and any additions, revisions, or addenda,
are believed to be accurately presented. How-
ever, it is not guaranteed as to accuracy or com-
pleteness, and is subject to change without no-
tice, at any time. There is no guarantee that the
systems, trading techniques, trading methods, in-
dicators, and/or other information presented in
this manual will result in profits, or that they
will not result in losses. It should not be as-
sumed, or is any representation made, that the
methods presented in the GET Software or User's
Guide, any additions, revisions, and addenda, can
guarantee profits in the Futures or Stock Mar-
ket or any other financial market instruments, or
that future performance will equal that of the
past.
Past performance is not a guarantee of future re-
sults. Only risk capital should be invested in the
Futures or Stock Market or any other financial in-
strument. Neither Trading Techniques, Inc., nor Tom
Joseph, nor anyone else representing Trading Tech-
niques, Inc., or Tom Joseph, take or assume any
responsibility or make any guarantees or make any
specific trading recommendations in any of the above
mentioned products, any of their additions, revisions,
and addenda. All investments and trades carry risk,
and all trading decisions of an individual remain the
responsibility of that individual.
The client acknowledges and agrees that neither Tom
Joseph nor Trading Techniques, Inc., (or their re-
spective heirs or successors) makes any representa-
tion or guarantee regarding the information and tech-
niques described in the above mentioned products
marketed by Tom Joseph or Trading Techniques,
Inc., or regarding how it may perform in the future;
regarding client's ability to utilize the information
and techniques described in the above mentioned
products; or regarding client's likelihood of success
in attempting to utilize same. In the event that any
liability is alleged or awarded in any forum notwith-
standing the above, such liability shall be limited to
the price paid by the client for the aggregate of all
products purchased by client from Trading Tech-
niques, Inc., or Tom Joseph.
The hypothetical computer simulated performance results provided are believed to be accurately presented.
However, it is not guaranteed as to accuracy or completeness and is subject to change without any notice.
Hypothetical or simulated performance results have certain inherent limitations. Unlike an actual performance
record, simulated results do not represent actual trading. Since, also, the trades have not actually been executed,
the results may have been under or over compensated for the impact, if any, of certain market factors such as
liquidity. Simulated trading programs in general are also subject to the fact that they are designed with the benefit
of hindsight. No representation is being made that any account will, or is likely to achieve profits or losses similar
to those shown. All investments and trades carry risks.
TRADING TECHNIQUES, INC.
DISCLOSURE AND DISCLAIMER
The Expert Trend Locator (XTL) is NOT a mechanical Trading System. The XTL is
one of the many Studies (methods) available in Advanced GET.
GET
Applying Technical Analysis
T-3
Technical Table Of Contents
Elliott Wave Technique ................................................................................................ T-5
Impulse Patterns ....................................................................................................................... T-6
Indicator To Provide Elliott Wave Counts ............................................................................. T-9
Elliott Oscillator: Step-By-Step Illustration ....................................................... T-11
Minimum Pull Back Required............................................................................................... T-15
Maximum Oscillator Pull Back ............................................................................................. T-16
Using The Elliott Oscillator in Wave Three ......................................................................... T-17
Using The Elliott Oscillator in Wave Four........................................................................... T-18
Using The Elliott Oscillator in Wave Five ............................................................................ T-19
Oscillator Breakout Bands..................................................................................................... T-20
Adding PTI (Profit Taking Index)......................................................................... T-21
Adding Wave Four Channels ............................................................................... T-23
Profit Taking Index & Wave 4 Channels............................................................. T-24
Adding Displaced Moving Average (DMA) ........................................................ T-25
Elliott Wave Rules & Guidelines.......................................................................... T-26
Elliott Wave Corrections....................................................................................... T-27
Alternation Rule ..................................................................................................................... T-31
Wave Measurements & Ratios ............................................................................. T-32
Ratios For Wave Three .......................................................................................................... T-34
Ratios For Wave Four ............................................................................................................ T-34
Ratios For Wave Five ............................................................................................................. T-35
Elliott Channels For Top Of A Wave Five............................................................................ T-36
Statistical Analysis of Wave Two Ratios............................................................................... T-37
Statistical Analysis of Wave Three Ratios............................................................................ T-38
Statistical Analysis of Wave Four Ratios.............................................................................. T-40
Elliott / Fibonacci Ratios........................................................................................................ T-42
Elliott / Fibonacci Ratios For Wave 5 ................................................................................... T-43
Rules: Type 1 Trade.................................................................................................... T-44
Rules: Type 2 Trade.................................................................................................... T-45
Examples Of Type One & Type two Trades ......................................................................... T-46
Type One Buy Setup ............................................................................................................... T-47
Type Two Buy.......................................................................................................................... T-48
Type Two Sell Setup................................................................................................................ T-49
Forecasting A Double Top...................................................................................................... T-50
Fifth Wave Failure Setup ....................................................................................................... T-51
Power of 60 Minute Charts........................................................................................ T-65
Cross-Referencing to Weekly Data ........................................................................... T-80
GET
Applying Technical Analysis
T-4
Alternatives In Elliott Wave Analysis....................................................................... T-84
Locallized Elliott Wave Counts: ............................................................................................ T-84
Alternate Counts..................................................................................................................... T-84
Alternate 3 (Long Term) ....................................................................................................... T-85
Alternate 2 (Short Term)....................................................................................................... T-86
Alternate 1 (Aggressive)........................................................................................................ T-87
Gann Techniques ........................................................................................................ T-90
Gann Angles And Lines ......................................................................................................... T-91
Using Gann Angles With Elliott Waves ................................................................................ T-95
Optimized Gann Angles ......................................................................................................... T-97
Gann Box Analysis ................................................................................................................. T-98
Regression Trend Channels .................................................................................... T-105
T.J.’s Web Levels ...................................................................................................... T-107
Fibonacci Time Clusters........................................................................................... T-112
Fibonacci Extension Price Clusters .................................................................................... T-115
Fibonacci Retracement Price Clusters .............................................................................. T-117
Andrews Median Lines............................................................................................. T-120
Extended Parallel Lines ....................................................................................................... T-123
Extended Parallel Lines ....................................................................................................... T-124
Combining Median Lines With Wave 3 ............................................................................. T-127
Automatic Regression Trend Channels .................................................................. T-129
Expert Trend Locator - XTL ................................................................................... T-132
Designated Use For XTL............................................................................................................ T-135
Settings For XTL: ...................................................................................................................... T-135
Taking Profits: ............................................................................................................................ T-139
Trade Continuation: ................................................................................................................... T-140
Guidelines for Trade Continuation ........................................................................................... T-141
Using Different Settings for XTL .............................................................................................. T-142
MOB (Make or Break) ............................................................................................. T-147
Bias Reversal ............................................................................................................. T-156
Elliott Wave Trigger ................................................................................................. T-158
T.J’s Ellipse................................................................................................................ T-160
Ellipse Projection (Shadow): ............................................................................................... T-163
The Joseph Trend Iindex (JTI)................................................................................ T-167
How Can JTI Be Used .......................................................................................................... T-172
Cycles ......................................................................................................................... T-173
Trade Pofile .............................................................................................................. T-176
Applying Technical Analysis Index ...........................................................................T179
GET
Applying Technical Analysis
T-5
Elliott Wave Technique
The Practical Approach— In Conjunction With GET
Elliott Wave is a collection of
complex techniques. About
60% of these techniques are
clear and easy to use. The
other 40% are difficult to
identify, especially for the
beginner. The practical and
conservative approach is to
use the 60% that are clear.
When the analysis is not
clear, why not find another
market which is conforming to an Elliott Wave pattern that is easier
to identify?
From years of fighting this battle, I have come up with the following
practical approach to using Elliott Wave principles in trading.
The whole theory of Elliott Wave can be classified into two parts: (a)
impulse pattern and (b) corrective pattern. We will discuss the
impulse pattern and how to use the Elliott Oscillator to identify these
impulse patterns. We will then discuss some general rules and guide-
lines followed by numerous examples.
GET
Applying Technical Analysis
T-6
Impulse Patterns
The impulse pattern consists of five waves. The five waves can be in either direction, up
or down. Some examples are shown below.
The first wave is usually a weak rally with only a small percentage of the traders partici-
pating. Once Wave 1 is over, they sell the market on Wave 2. The sell off in Wave 2 is
very vicious. Wave 2 will finally end without making new lows and the market will start
to turn around for another rally.
The initial stages of the Wave 3 rally is slow and it finally makes it to the top of the pre-
vious rally (the top of Wave 1). At this time, there are a lot of stops above the top of
Wave 1.
Traders are not convinced of the upward
trend and are using this rally to add more
shorts. For their analysis to be correct, the
market should not take the top of the pre-
vious rally.
Therefore, a large amount of stops are
placed above the top of Wave 1.
Wave 1
Wave 2
Wave 3
Wave 4
Wave 5
Wave 1
Wave 3
Wave 4
Wave 5
1
2
Wave Two will not
make new lows
1
2
STOPS
Top of Wave One
Wave Three in
initial stages
Vicious selling
in Wave Two
Upward
Impulse
Action
Downward
Impulse
Action
Wave 2
GET
Applying Technical Analysis
T-7
The Wave 3 rally picks up steam and takes the top of Wave 1. As soon as the Wave 1
high is exceeded, the stops are taken out. Depending on the amount of stops, gaps are left
open. Gaps are a good indication of a Wave 3 in progress. After taking the stops out,
the Wave 3 rally has caught the attention of traders.
The next sequence of events are as follows: Traders who were initially long from the
bottom finally have something to cheer about. They might even decide to add positions.
The traders who were stopped out (after being upset for a while) decide the trend is up
and they decide to buy into the rally. All this sudden interest fuels the Wave 3 rally.
This is the time when the majority of the
traders have decided that the trend is up.
Finally, all the buying frenzy dies down,
Wave 3 comes to a halt.
Profit taking now begins to set in. Trad-
ers who were long from the lows de-
cide to take profits. They have a good
trade and start to protect profits.
This causes a pullback in the prices
and is called Wave 4. Wave 2 was a
vicious sell-off, Wave 4 is an orderly
profit taking decline.
1
2
Top of Wave One
Gap of Wave Three
Wave Three
in progress
STOPS
2
In general,
a majority
of traders
decide and
agree that
the trend
is up.
1
Stops
taken
out
3
Traders
buying
GET
Applying Technical Analysis
T-8
2
1
3
4
5
Price makes
new highs.
However,
strength in
rally is weaker
in comparison
to the third
wave rally.
While profit taking is in progress, the majority of traders are still convinced the trend is
up. They were either late in getting in on this rally, or they have been on the sideline.
They consider this profit taking decline as an excellent place to buy-in and get even.
On the end of Wave 4, more
buying sets in and the prices
start to rally again.
The Wave 5 rally lacks the huge enthusiasm and strength found in the Wave 3 rally. The
Wave 5 advance is caused by a small group of traders.
While the prices make a new high above the top of Wave 3, the rate of power, or
strength, inside the Wave 5 advance is very small when compared to the Wave 3 advance.
Finally, when this lackluster buying
interest dies out, the market tops
out and enters a new phase.
2
1
Vicious
sell-off
4
3
Profit
taking
decline
Rally with
great strength
GET
Applying Technical Analysis
T-9
Indicator To Provide Elliott Wave Counts
The examples of five wave impulse patterns shown on the previous page are very clear and
definitive. However, the markets are not that easy all the time. It becomes almost impossible and
very subjective to identify Waves 3 and 5 from looking at price charts alone. The price chart
fails to show the various strengths of the waves. The following illustration is used to discuss this
concept. Two drivers left the same town at the same time in different vehicles. Driver A drove
within speed limits all the way, while Driver B exceeded the speed limit .
Both drivers took the same amount of time and traveled the same distance. However, the two
drivers used different strategies to arrive at their destination. While Driver A proceeded at a
normal speed, Driver B drove like a bat-out-of-Hades, so to speak. An observer at the other
end would be unable to tell the difference between the two drivers driving patterns. To a
casual observer, both left the same time and arrived at the same time. This is the same
problem we face when we try to distinguish between Waves 3 and 5. Wave 5 makes new
highs; a trader looking at price charts may not be able to tell the difference between a
Wave 3 or Wave 5. However, the internal price pattern of Wave 3 is much stronger in compari-
son to that of Wave 5. Therefore, we need to use an internal strength measuring indicator to tell
the difference.
DRIVER A —
ALWAYS WITHIN SPEED LIMIT
DRIVER B —
TOOK A
DIFFERENT ROUTE;
EXCEEDED THE
SPEED LIMIT.
GET
Applying Technical Analysis
T-10
Indicator To Provide Elliott Wave Counts
To keep tab of the Elliott Wave logic, we require an indicator that measures the rate of
price change in one wave against the rate of price change in another wave. Standard
indicators fail to perform this comparison. They merely compare price against price and
fail to compare the rate of price action. After years of research, the Elliott Oscillator
was developed. The idea of the oscillator is described below.
An Elliott Oscillator is basically calculated
from finding the difference between two
moving averages. If we were to use a small
moving average and a large moving average,
the difference between the two will show
the rate of increase in prices.
The small moving average represents the
current price action, while the larger moving
average represents the overall price action.
When the prices are gapping up inside a
Wave 3 the current prices are surging; the
difference between the small and large mov-
ing averages is great and produces a large
oscillator value.
However, in a Wave 5 the cur-
rent prices are not moving up at
a fast rate and, therefore, the
difference between the small
and large moving averages is
minimal. This produces a
smaller oscillator value.
The analogy is similar to the
two drivers.
Wave 3 is like Driver B who
accelerates beyond speed lim-
its and has a higher rate of
speed, while Wave 5 has a
slow, dragging price action.
Large moving average
representing
price actions
Wave Three
Wave Five
Difference
is large in
Wave 3
Rate of price
increase is
much faster
Small moving aver-
age representing
current prices
Difference is very
small in Wave 5
Rate of price increase is slow
GET
Applying Technical Analysis
T-11
Current prices
moving with slower
rate shows wave
five
Larger MA represents overall price
Current prices moving up rapidly
shows wave three
Small MA
represents
current
price
Small and Large Moving Average
1
2
3
4
5
Prices making
new highs, but
no lasting strength
Sample Price Bar Chart
Elliott Oscillator: Step-By-Step Illustration —
We will use the same chart for illustration. When the prices rally above the top of Wave
1, the Elliott Oscillator is making new highs. Notice also the gapping action. The current
rally is labeled Wave 3.
Finally, the buying subsides in Wave 3. Traders begin to take profits. However, the gen-
eral public is eagerly waiting for a neutral area to buy into this market. When the Elliott
Oscillator pulls back to the zero level, or slightly below, the market is entering a neutral
area.
GET
Applying Technical Analysis
T-12
Small MA
represents
current
price
Prices making new
highs without strength
Current prices
moving with slower
rate shows Wave
Five
Larger MA represents overall price
Current prices moving up rapidly
shows Wave Three
1
2
3
4
5
Prices making
new highs, but
no lasting strength
Sample Price Bar Chart
Small and Large Moving Average
The Elliott Wave Oscillator
Once Wave 4 is over, buying comes in from traders who missed the entire Wave 3 rally.
The prices move to new highs. However, the rally does not have the fast rate of price
increase that was seen in Wave 3. This difference in the rate of price is picked up by the
oscillator and can be easily identified. MORAL OF THE STORY: Always let the Elliott
Oscillator track Elliott Wave counts.
ø
Majority accepting the trend
ø
ø
õ
GET
Applying Technical Analysis
T-13
Rally
with strength
labeled
as Wave
Three
4
New
Phase
2
3
1
5
3
5
New
highs
with
less
strength
Strength
in rally
Five Wave Impulse
(UP)
Identifying a five wave impulse
(up) using the Elliott Oscillator,
which is part of the software.
Divergence
õ
õ
Labeled as
Wave Four
because
oscillator
pulled back
to zero
õ
÷
Elliott
Oscillator
pulls back
to zero
ö
GET
Applying Technical Analysis
T-14
New
lows
with less
strength
New Phase
4
3
Divergence
5
3
5
Decline
with strength
Five Wave Impulse (DOWN)
2
1
Identifying a five wave
impulse (down) using the
Elliott Oscillator, which is
part of the software.
ö
ö
õ
Elliott
Oscillator
pulls back
to zero
ø
÷
Labeled as
Wave Four
because
oscillator
pulled back
to zero
GET
Applying Technical Analysis
T-15
Minimum
90% Pullback
Required
0
3
4
5
Elliott Oscillator
(not shown to any scale)
90%
Divergence
Minimum Pull Back Required
Historically, 94% of all Wave 4 sequences that have ended in a Wave Five making a new
high or a new low, had the Elliott Oscillator pull back at least 90% from the Wave 3 peak.
The Elliott Oscillator
GET
Applying Technical Analysis
T-16
0
3
4
5
Elliott Oscillator
(not shown to any scale)
90%
Divergence
Minimum
90% Pullback
Required
Maximum Pull Back = 38%
of Wave 3 peak in the
Opposite Direction
The Elliott Oscillator
Maximum Oscillator Pull Back
Just as it is important for the Oscillator to pull back to the zero line (or at least 90% of the
Wave 3 Oscillator as discussed on the previous page) it is just as important that the
Oscillator does NOT pull back more than 38% of the Wave 3 Oscillator on the other side
of the zero line.
38% of the Wave 3 Oscillator
123456789012345678901234567890121234567890123456789012345678901212345678901
1
23456789012345678901234567890121234567890123456789012345678901212345678901
1
23456789012345678901234567890121234567890123456789012345678901212345678901
1
23456789012345678901234567890121234567890123456789012345678901212345678901
1
23456789012345678901234567890121234567890123456789012345678901212345678901
123456789012345678901234567890121234567890123456789012345678901212345678901
GET
Applying Technical Analysis
T-17
Using The Elliott Oscillator in Wave Three
¤ When a market rallies with a strong Elliott Oscillator as in Chart A, the rally is
classified as a Wave Three.
¤ Once Wave Three is over, the market will pull back on a profit taking decline.
During the profit taking decline, the Elliott Oscillator should pull back to zero (as
shown in Chart B).
Chart A Chart B
Oscillator
Pullback to
Zero
ï
ö
Strong Oscillator
ö
Wave 3
Once Wave 3 is over,
profit taking sets in.
GET
Applying Technical Analysis
T-18
Using The Elliott Oscillator in Wave Four
¤ Once the Elliott Oscillator pulls back to zero, it signals the end of a potential Wave
Four profit taking decline as shown in Chart A.
¤ New buying comes in and the market makes new highs (as shown in Chart B).
Oscillator
Pullback to
Zero
ò
Chart A Chart B
Profit Taking
Decline Over
ö
New Highs
ð
ñ
New
Buying
ö
Profit Taking
Ended
GET
Applying Technical Analysis
T-19
Using The Elliott Oscillator in Wave Five
¤ The market is making a new high with less strength in the Elliott Oscillator as shown in
Chart A.
¤ This indicates that the current rally is a Wave Five and once the Fifth Wave is over, the
market should change direction.
¤ When the market changes direction after completing a Five Wave sequence, the previous
Wave Four will become the first target. In Chart B, the market changed direction and is
trying to test the previous Wave Four low near 3630.
Chart A
Chart B
ð
New High
Previous
Wave 4
Low
ñ
With Good Oscillator
Divergence
Oscillator
Divergence
ð
When 5 Waves are com-
plete, the market changes
direction
GET
Applying Technical Analysis
T-20
Oscillator above
Breakout Band.
î
Oscillator above Breakout Band.
Confirmed Wave Three in progress.
OSCILLATOR BREAKOUT BANDS
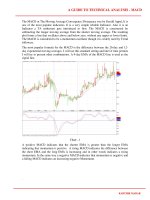
A major task in using Elliott Wave Analysis is to identify Wave Three's accompanied with a strong Oscil-
lator. In the past we have done this by
visually comparing the size of the cur-
rent Oscillator with that of the past.
The Oscillator Break Out Bands pro-
vide an UP Band and a LOW Band.
Anytime the software labels a Wave
Three, the Oscillator needs to be
comfortably above the Break Out
Band. We recommend a setting of
80% for these bands.
The chart on the left is the Daily Swiss
Franc Dec 94 contract. Here the soft-
ware labels a Wave Three Rally and
this rally is accompanied by a strong
Oscillator that is breaking above the
Breakout Bands.
Therefore, this Wave Count can be
used for this market at this time. An-
other example is shown below where
the Oscillator is above the Breakout
Band and confirms with the Elliott
Wave analysis.
GET
Applying Technical Analysis
T-21
Adding PTI (Profit Taking Index) - Theory
Using Elliott Wave analysis, any major rally or decline can be classified as a Wave Three.
Once a Wave Three is in place, Elliott Wave theory continues to look for a Wave Four
Retracement followed by second attempt in the same direction. This last phase is called
Wave Five.
WAVE THREE
Initial Strong
Decline
4
5
3
4
5
WAVE FIVE - 2nd
attempt in the same
direction.
WAVE FOUR
Retracement
WAVE THREE
Initial Strong
Rally
3
WAVE FOUR
Retracement
WAVE FIVE - 2nd
attempt in the same
direction.
DECLINE PHASE
RALLY PHASE
The above patterns are completed Five Wave sequences and are great after the fact.
However, while the pattern is in progress, the Trader is left with a major dilemma at the
end of the WAVE FOUR Retracement. This dilemma is because many times the 2nd
attempt fails to materialize.
4
5
3
WAVE FIVE - 2nd
attempt in the same
direction.
WAVE FOUR
Retracement
WAVE THREE
Initial Strong
Rally
5
3
WAVE THREE
Initial Strong
Rally
4
WAVE FOUR
Retracement
Market continues to
drop without reversing.
Normal Five Wave Pattern
False Five Wave Pattern
Anticipated
WAVE FIVE
GET
Applying Technical Analysis
T-22
From our years of research and development, we designed the Profit Taking Index (PTI).
The Profit Taking Index compares the Buying/Selling momentum in Wave Three with the
Buying/Selling momentum in Wave Four. This comparison is then passed to an algorithm
that calculates the PROFIT TAKING INDEX VALUE.
WAVE FOUR
Retracement
If the Profit Taking Index is
LESS than 35, and the market
still initiates a Fifth Wave Phase,
the potential for a DOUBLE
TOP becomes very high.
WAVE THREE
Initial Strong
Rally
3
PTI
29
4
5
DOUBLE TOP
Statistically, if the Profit Tak-
ing Index is LESS than 35,
the market generally FAILS
to initiate a Fifth Wave or 2nd
Attempt Phase.
3
WAVE THREE
Initial Strong
Rally
4
Market continues to
drop without reversing.
PTI
29
5
WAVE FIVE - 2nd
attempt in the same
direction.
4
WAVE THREE
Initial Strong
Rally
3
59
WAVE FOUR
Retracement
PTI
Statistically, if the Profit Tak-
ing Index is Greater than 35,
the market exhibits a greater
tendency to initiate a Fifth
Wave or a 2nd Attempt
Phase.
CASE 1 - Normal Five Wave Pattern
CASE 2- False Five Wave Pattern
CASE 3 -Failed Five Wave Pattern - Double Top
GET
Applying Technical Analysis
T-23
3
59
PTI
WAVE FIVE - 2nd
attempt in the same
direction.
5
WAVE THREE
Initial Strong
Rally
4
ch 1
ch 2
ch 3
WAVE FOUR
Channels
WAVE FOUR
Retracement holding above
Wave Four Channels
PTI Greater
than 35
The Significance of Wave Four Channels
1) If the wave four retracement holds above the first channel (displayed in BLUE), the
statistical odds are better than 80% for a strong wave five rally.
2) If the wave four retracement holds above the second channel (displayed in GREEN),
the statistical odds for a strong wave five rally is only 60%.
3) The third channel (displayed in RED) is a final stop, because once this channel is
broken the odds for a new high in wave five is very low. The very few times a fifth
wave is generated after breaking the RED channel, the rally becomes a tedious, slow
and drawn out process which literally eats out your patience and option premiums.
Adding Wave Four Channels
Wave Four Channels are another proprietary study developed along with the Profit Taking
Index. The Profit Taking Index mainly deals with Buying/Selling momentum at different
stages. The Wave Four Channels deal with time. After a strong rally, the retracement phase
is allowed a certain amount of time prior to initiating the 2nd attempt (Wave Five) Phase.
Statistical studies show that if the retracement phase consumes too much time, the 2nd
attempt phase diminishes its full effect. The Wave Four Channels are three time/price lines.
If the Wave Four Retracement holds above the Wave Four channels, the odds for a
strong 2nd attempt are greater.
If the Wave Four Retracement breaks below the Wave Four channels, the odds for
a strong 2nd attempt is very low.
GET
Applying Technical Analysis
T-24
Profit Taking Index & Wave 4 Channels
¤ In Chart A, when the Elliott Oscillator pulls back to zero, the Profit Taking Index
(PTI) should be greater than 35. In this case the PTI is at 47 which indicates normal
profit taking in the Wave Four Decline.
¤ In addition, the prices should hold above the Wave Four Channels which indicate the
ideal length of time for normal profit taking. In Chart A, the prices are holding above
the Wave Four Channels.
¤ Everything here looks good for a buy.
Chart B
Chart A
ñ
Buy For New
Highs
PTI > 35
Prices Holding Above
the 2nd Wave 4 Channel
ñ
GET
Applying Technical Analysis
T-25
Adding Displaced Moving Average (DMA)
¤ We introduced the DMA concept in 1988. The DMA is a normal moving average
shifted to the right. The purpose behind the DMA is to allow the market to continue
its momentum.
¤ When the market finally completes a Five Wave sequence, prices will cross the DMA.
¤ At the end of Wave Five, use the DMA to enter the trade. We suggest a 7 period
moving average shifted (displaced) to the right by five periods.
¤ WARNING: The DMA is designed to enter positions at the end of a Fifth Wave and
on certain patterns at the end of Wave Four. DO NOT USE the DMA as a tool to buy
or sell at other places. The accuracy for the DMA as a tool by itself is less than 21%.
DMA
ð
Fifth Wave High
õ
7 Period MA
displaced 5
periods
DMA stays out of the way and lets the
market continue its momentum
ñ
Sell on cross
of DMA
÷