Factors affecting the job satisfaction of sales marketing staff in ho chi minh city
Bạn đang xem bản rút gọn của tài liệu. Xem và tải ngay bản đầy đủ của tài liệu tại đây (328.83 KB, 32 trang )
OUM
OPEN MALAYSIA UNIVERSITY
RESEARCH PROJECT
(BMBR5103)
FACTORS AFFECTING THE JOB
SATISFACTION OF SALES MARKETING
STAFF IN HO CHI MINH CITY
STUDENT FULL NAME
: PHAM VAN HOANG
STUDENT ID
: CGS00064970
INTAKE
: MAY, 2017
ADVISOR'S NAME AND TITLE
: DR. BUI PHI HUNG
July, 2017
1
Contents
I.
AN OVERVIEW OF THE RESEARCH PROBLEM ............................................ 4
I.1. Introduce .................................................................................................................. 4
I.2. Objectives of the study ............................................................................................ 4
I.3. Scope and methodology: ......................................................................................... 4
II.
Theoretical basis and research model: .................................................................. 5
II.1. Agency theory ......................................................................................................... 5
II.2. Research concepts: ................................................................................................. 5
ii.2.1. Job performance and job satisfaction ............................................................ 5
II.2.2. Life satisfaction ................................................................................................ 6
II.2.3. Efford ................................................................................................................ 6
II.2.4. Psychological hardiness ................................................................................... 7
II.2.5. Hope ................................................................................................................... 8
II.2.6. Job attractiveness ............................................................................................... 8
II.3. Research models ..................................................................................................... 9
III. RESEARCH DESIGN:............................................................................................. 11
III.1. Research Methods: ............................................................................................. 11
III.1. Setting the scale: ................................................................................................. 11
IV. RESEARCH RESULTS: .......................................................................................... 14
IV.1. Rating scale.......................................................................................................... 15
IV.2. Analyzing the discovery factor .......................................................................... 16
IV.2.1. Analytical factor for discovering independent variables ................................ 16
IV.2.2. Analyze the factor of dependent variables ..................................................... 18
IV.3. Multiple regression analysis. ............................................................................. 20
IV.3.1. Model testing (1). ........................................................................................... 20
IV.3.3. Model testing (3) ........................................................................................... 22
IV.3.3. Model testing (3) ............................................................................................ 24
IV.4. The results of hypothesis testing........................................................................ 27
V. CONCLUSIONS: ........................................................................................................ 30
LIST OF REFERENCES................................................................................................ 32
2
Table 1: Cronabach's alpha coefficient values of concepts…………………………..15
Table 2: Rotational factor matrix .................................................................................. 17
Table 3: Work Performance Factor Matrix ................................................................. 18
Table 4: Job satisfaction matrix ..................................................................................... 19
Table 5: Factor matrix on life satisfaction .................................................................... 19
Table 6 : shows the suitability of the model .................................................................. 20
Table 7: Tests of suitability of the model ...................................................................... 20
Table 8: Conformity assessment of the model .............................................................. 22
Table 9: Tests of suitability of the model ...................................................................... 22
Table 10: Results received by enter method ................................................................. 23
Table 11: Conformity assessment of the model ............................................................ 24
Table 12: Tests of fit of model ........................................................................................ 24
Table 13: Results recommended by enter method ....................................................... 24
Table 14: Conformity assessment of the model ............................................................ 26
Table 15: Tests for the suitability of the model ............................................................ 26
Table 16: Results recorded by stepwise method ........................................................... 27
3
I.
AN OVERVIEW OF THE RESEARCH PROBLEM
I.1. Introduce
In the trend of economic development as well as towards the process of integration more and
more, the emergence of many brands of products and services of many domestic and
international enterprises make an emerging market such as Vietnam. Men become more
diverse, richer and more vibrant, so that consumer have more choices to suit their preferences
as well as financial ability. In addition, the competitive pressure between brands of product
and services in all sectors and industries has become increasingly acute. Therefore, we cannot
deny the role and influence of marketing activities in different areas.
With Ho Chi Minh city, it can be said that marketing activities have only been noticed by
enterprises for more than ten years. Marketing staff is not focused on investment development,
limited in quantity and quality. Usually the job of brand management and development is done
by direct managers or by some executives. However, they do not have a method and
professional marketing process to ensure the consistency and consistency of the brand. So the
urgent need now is that every business needs to build a marketing staff and a marketing system
appropriate for their own. In order for businesses to become more and more attractive to
passionate marketing talent, enabling them to leverage their dynamic, creative capabilities, the
question is whether marketing at the enterprise brings one person harmony for their work, life?
What element can create that one comedy?
I.2. Objectives of the study
Identify exactly the factors affecting the performance of sales staff in domestic and foreign
businesses in Ho Chi Minh .Clarify the relationship between performance factors and work
satisfaction.
I.3. Scope and methodology:
This study was conducted with marketing staff from enterprises in Ho Chi Minh City, by
quantitative method through direct interview technique.
4
II.
Theoretical basis and research model:
II.1. Agency theory
There have been positive studies of organizational psychology which have paid much attention
to the role a comedian to the role of a comedian in terms of work performance in relation work
efficiency.
Similarly, job satisfaction is also a widely studied structure for sales force ( Brown and Peterson
1993, Markus Christen, Ganesh Iyer, & David Soberman 2006), the management team of retail
stores (Lusch and Serpkenci 1990, from Markus Christer, Ganesh lyer, & David Soberman
2006), and service personnel (Boyt, Lush and Naylor 2001, from Markus Chriesten, Ganesh
lyer, & David Soberman 2006). However, the discoveries in the literature on the relationship
between one’s comedy of work and the premise of one’s comedy are unstable, sometimes
contradictory. For example, if the results of Brown and Peterson’s 1994 study show that there
is a positive effect of one’s humor on the sales person’s work. The study by Markus Christen,
Ganesh lyer, & David Sonerman 2006 demonstrates the negative impact of one-man humor on
the work of sales staff. The contradiction in the results of this study demonstrates the need to
test these correlations in specific economic settings and environments for appropriate
perceptions.
II.2. Research concepts:
ii.2.1. Job performance and job satisfaction
It is easy to see that, for each person’s work, if we can always accomplish them in the best
way, and the achievement is always appreciated, we will feel satisfied about the job dirty.
However, whether the above can be true for all types of work or not, for example for marketinga job that requires dynamism, creativity? The relationship between job performance and job
satisfaction is the focus of organizational psychology studies (Markus Christen, lyer and
Soberman, 2006). However, this connection is still controversial because of the contracdictory
results. For example, Brown and Peterson’s 1993 study, laffaldano and Muchinsky, 1985, show
weak and inappropriate relationships. Meanwhile, the Christen & GCG 2006 study shows a
strong correlation between two components of job performance and job satisfaction.
5
So the question here is, is the marketing performance of a marketing professional having a
positive impact on job satisfaction?
Hypothesis H1: There is a positive correlation between job performance and job satisfaction
of marketing staff
II.2.2. Life satisfaction
It is difficult to give an exact definition of the level of satisfaction of the life because it depends
on each of us’s goals of work, of different needs. However, it can be said that if someone is
happy about their work, it also means that they have reached one of the highest criteria in the
human needs pyramid, the need for communication and Social relations (Diener, 1984, from
Don R. Rahtz and M. Joseph Sirgy, 2000). Research by Rahtz and Sirgy in 2000 in the field of
community health marketing and many other studies has shown that there is a definite
correlation between work achievement and satisfaction level of life.
So the question is, is there a definite correlation between job satisfaction and the satisfaction
of
the
life
of
the
marketing
staff,
while
performance
is
not?
Hypothesis H2: There is a definitive correlation between satisfaction and marketing
satisfaction.
Hypothesis H3: There is a negative correlation between work performance and satisfaction on
the lives of marketing staff.
II.2.3. Efford
For any job, if we have the passion, the real effort, and the determination to do so, then the
result will certainly be adequate. This argument seems to have nothing to argue. But, with the
changes in today’s economy, the increasing risks in all areas, are all efforts to succeed? The
Christen & ctg study in 2006 found that “employee effort” was positively correlated to “job
performance”, and therefore had a direct and definitive correlation for degree of “Heart on the
job”. Or even some studies refer to “employee effort” as a component of “work
accomplishment” (Berhrman and Perreasult 1984, Lusch and Serpkenci 1990; Walker,
Churchill and Ford in 1977, from Christen & ctg in 2006).
6
However, efforts at work do not always seem to bring satisfaction to employee. This can be
explained by the conflict of interest between the employer – always want his employees to
work hard at high performance to maximize profits for business. Employees – always want to
achieve a certain level of income with the lowest level of effort. That is also the basic
contradiction of the theory of economic aout the relationship between the owner – agent( Hart
and Holmstrom 1987, Holmstrom 1979, Chirsten & ctg 2006). But the fact it, will excessive
efforts always reduce the level of employee satisfaction with the job?
So, the question here is, is the marketing effort in the workplace really improving your work
performance and reducing your job satisfaction?
Hypothesis H4: There is a positive correlation between the efforts of the marketing staff and
the results of the work.
Hypothesis H5: There is a negative correlation between the marketing staff’s efforts and the
level of job satisfaction.
II.2.4. Psychological hardiness
More and more research is being conducted on the relationship between consistency and
performance of employees because in today's competitive economic growth and competitive
environment, the pressure and job requirements for each employee The tablet is very large
(Maddi, 2005, from S.Cole & ctg, 2006). This requires each employee to be persistent in his
or her job, ready to face the hardships and work hard to achieve the goals of the job. And so,
those who work hard, persistently pursue the goal are also optimistic people, always find
positive meaning in their work (S.Cole & ctg, 2006), effective Their work will surely increase.
According to Maddi (1999, S.Cole & ctg, 2006), persistence is reflected in the employee
experience, the ability to analyze and respond to stressful events, the ability to successfully
complete Work and professional ethics. So in the real work of marketing staff, is there a
positive correlation between work consistency and performance?
Hypothesis H6: There is a positive correlation between job consistency and the performance
of sales & marketing staff.
Hypothesis H7: There is a positive correlation between job consistency and the performance
of sales & marketing staff.
7
II.2.5. Hope
Perhaps none of us have no wishes, goals in life and in everyday work. "Hope" can be viewed
as a positive psychological force (Luthans & ctg, 2008). Snyder and colleagues (1996) have
defined the term "hope" as a positive emotional state that arises from the desire for success
based on specific goals and the way in which Achieve that goal. Thus, the concept of "hope"
can be seen as consisting of three different but complementary elements: motivation, process
and goal (Luthans & ctg, 2008).
Where "motivation" is the desire, the motivation of an individual to complete a specific task or
a goal in a given situation, so it consists of direct or indirect energy. Next to success. The
"process" is a different way to achieve a goal or accomplish a task. In combination, they form
the desires, goals and paths to achieve that goal. Therefore, if we always identify the right
target, pursue the goal and try to achieve it in many ways, the ability to complete the work will
be high and can bring satisfaction to their work. Research by Youssef and Luthans in 2007
shows that there is a correlation between the "hope" factor and the success of factory workers
in China as well as the satisfaction of their work. As for the work of marketing staff in Vietnam
in this study? Is "hope" a factor that affects work performance and job satisfaction?
Hypothesis H8: There is a positive correlation between "hope" and the performance of a sales
& marketing employee.
Hypothesis H9: There is a positive correlation between "hope" and the level of satisfaction of
the sales & marketing staff.
II.2.6. Job attractiveness
Each job has its own characteristics, and each one has a passion for each job, but one can say
that job attractiveness is important to the ability to fulfill a job. Work success, and job
satisfaction. There have been many studies by authors around the world on the attractiveness
of work. Research by Coleman and Irving (2001) argues that jobs with many attractive or
highly attractive characteristics will attract more applicants and the interest of students looking
for work Franke and Mueschen.s (2001) identify the main factors that affect the attractiveness
of a job as a career opportunity (reputation and income), creativity, and the effort that the job
8
entails. Harris and Fink (1987) found a strong and meaningful correlation between job
attractiveness and job acceptance, in which job attractiveness was influenced by wage and
salary mechanisms. School of work and the nature of work. Smith, Kendall and Hulin (1969,
from Christen & ctg., 2006) have provided job descriptions including five factors, including
job attractiveness. Both have positive effects on job satisfaction and job satisfaction (Christen
& ctg, 2006). So the question is whether, for the job of marketing staff, does attractiveness
contribute to job performance and job satisfaction?
Hypothesis H10: There is a positive correlation between the attractiveness of work and the
performance of a sales & marketing employee.
Hypothesis H11: There is a positive correlation between job attractiveness and job satisfaction
of sales & marketing staff.
II.3. Research models
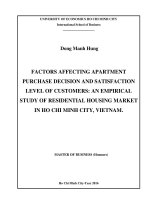
Figure 1: Research model
Efford
Job
Performance
Psychology
cal
hardiness
Job
attractive
ness
Hope
Job satisfaction
9
Life
satisfaction
According to the model illustrated in Figure 1, the efforts of the marketing staff, persistence,
hope, and job attractiveness are all influencing factors. However, the factors that influence job
satisfaction are the factors: the marketing staff's efforts, the hopes and the attractiveness of the
job, except the consistency factor. In addition, the results of the work directly affect the level
of satisfaction with the work; At the same time, these two factors (job satisfaction and job
satisfaction have different effects on the satisfaction of marketing staff in life.
Hypothesis
relationship
Table1: Summary of hypotheses
H1
Achievement
+ Satisfaction on the job
H2
Satisfied about work
+ Satisfied about life
H3
Work Out
- Satisfying life
H4
Employee Efforts
+ Work Outcomes
H5
Efforts of staff
- Satisfied about work
H6
Consistency in work
+ Work achievement
H7
Consistency in work
H8
Hope
+ Work Out
H9
Hope
+ Satisfied about the job
H10
The attractiveness of the job
H11
Job Satisfaction
+ Satisfaction on the job
+ The result of the work
+ Satisfaction with the job
10
III. RESEARCH DESIGN:
III.1. Research Methods:
This study was conducted by quantitative method through direct interview technique.
The sample size of this study was 120.
The subject of the study is the sales & marketing staff are working in domestic and foreign
enterprises in the city. Ho Chi Minh.
The purpose of this study was to test the measurement model (Figure 1) and the hypotheses in
the model. The scale is verified by the Cronbach Alpha reliabilitycoefficient and the EFA
discovery factor analysis. Research model is verified by correlation analysis (multiple
regression).
III.1. Setting the scale:
There are seven research concepts used in this study; concepts are unidirectional concepts.
These concepts include: (1) hope, (2) persistence, (3) effort, (4) job attractiveness, (5) Happy
about work, (7) satisfaction on life,.
- Hope attitude scale
The attitude of hope expressed through the silence towards the goal of individual workers while
performing their duties. The scale is established according to (Youssef and Luthans, 2007, from
Fred Luthans & cgt., 2008), including four observations:
1. I actively pursue my current career goals
2. I have many ways to pursue my current career goals
3. There are many ways to solve the problem I am having at work
4. At the moment, I find myself achieving my goals
-
The scale of work consistency (Psychological Hardiness)
11
Work consistency is reflected in the determination to fulfill the tasks of the employees. The
scale is set according to (Maddi, 1990a & 1990b, from S.Cole & ctg, 2006), including the
following five observations:
5. Whatever the difficulty, I always commit to complete work at the company
6. When necessary, I am willing to work hard to achieve my goals
7. When I have a problem at work, I always have the ability to solve it
8. I have always been in control of the difficulties with me at work
9. I always have the ability to cope with unforeseen difficulties in the work
-
Effort
Effort is expressed through the effort and responsibility to complete the work assigned. The
scale is set up according to (Lusch and Serpkenci, 1990, from Christen & ctg., 2006), including
the four observed variables:
10. I always finish my work at my company
11. I always try to do my job well at my company
12. I always have a high sense of responsibility for my work at my company
13. I am willing to work overtime as needed to finish work at my company
-
Job Atractiveness
The attraction of work expressed through the passion and enjoyment of employees when
performing tasks at the company. The scale is set up according to (Lusch and Serpkenci, 1990,
from Christen & ctg., 2006), including the four observed variables:
12
14. After every working day, I feel I've done something
15. The work I do at the company is very interesting
16. I rarely feel bored with the work I do at the company
17. The work I do at the company is fascinating
-
Performmance
The performance of employees in the performance of their duties is reflected in the
effectiveness and quality of their work. It is evaluated by the workers themselves as well as by
their supervisors and colleagues. This scale is based on (Lusch and Serpkenci, 1990, from
Christen & ctg., 2006) including four observations that measure the performance level of the
marketing staff below:
18. I believe that I am an effective employee
19. I'm always happy with the quality of the work I did
20. My boss always thought I was a good guy
21. My colleagues always value me as a person who works effectively
-
Job sastifaction
Job satisfaction is reflected in the perceived level of respect and the opportunity to demonstrate
self-efficacy, enhance learning, and promote employee creativity. The scale set up according
to (Lusch and Serpkenci, 1990, from Christen & ctg., 2006) consists of four observable
variables:
22. I'm respected at the company
23. My work shows me my best
24. The job helps me improve my expertise
13
25. Work helps me develop creativity
-
Life sastifaction
Life satisfaction reflects the level of quality of life of people through satisfaction of their living
conditions. The scale is set according to (Rahtz and Sirgy, 2000), which consists of four
observations:
26. My living conditions are wonderful
27. I am completely satisfied with my life
28. I almost get what I need in life
29. I hardly ask for anything more for my life
IV. RESEARCH RESULTS:
To apply the model in practice, a survey of marketing & sales staff in Ho Chi Minh City was
conducted. Number of coupons is 123 samples, collected by convenient sampling method and
direct interview with design questionnaire based on 6 factors affecting the level of satisfaction
in the life of the sales & Marketing staff and Points range from 1 to 7.
Collected data is processed by SPSS software. After coding and data cleansing will undergo
formal analysis as follows: evaluation of reliability and scale values, factor analysis will be
used to test the convergence of variables into Conceptual section, accentuated structural model
hypotheses and overall model fit. Next, perform a multiple regression analysis to assess the
suitability of the model and to determine the importance of the independent variables in the
model.
14
IV.1. Rating scale
Scales evaluated for reliability through two tools are the Cronbach Alpha coefficient and factor
analysis. The Cronbach Alpha coefficient is used to exclude "rubbish" variables whose
Corrected item total correlation values less than 0.3 will be rejected and the scale will be
selected when the Cronbach Alpha coefficient is greater than 0.6. (Nunnally & Bernstein,
1994).
Reliability is used to describe the measurement error, because it is not possible to accurately
determine the degree of variation of the correct variable and error, and can not directly calculate
the reliability of the scale. However, we can establish reliability based on the Cronbach Alpha
coefficient. This coefficient indicates the correlation between the variables in the questionnaire,
which is used to calculate the change of each variable and the correlation between variables
(Bob E. Hays, 1983).
Table 1: Cronabach's alpha coefficient values of concepts
Scale
Cronbach’s Alpha
Hope
0,727
Consistency in the work
0,807
0,784
Work effort
The attractiveness of the job
0,867
Work accomplishment
0,852
0,810
Satisfied with the job
0,870
Happy about life
From Table 1, we see that Cronbach's Alpha values of variables are greater than 0.6 and
15
Corrected Item-Total Correlation is greater than 0.3. Therefore, all variables are satisfactory
and included in the exploratory factor analysis in the next section.
IV.2. Analyzing the discovery factor
IV.2.1. Analytical factor for discovering independent variables
To identify the questionnaire elements of 17 observation variables with the four
factors assumed by the theoretical framework (Figure 1). Using SPSS - Factor analysis
software for 4-month test results with guaranteed results:
- The reliability of the factor loadings less than 0.5 will be eliminated, while the
Eigenvalue stop (representing the variation explained by each factor) is greater than 1 and the
total Wrong extraction is more than 50%.
- The coefficient (Kaiser - Meyer - Olkin) KMO is an index used to look at the
relevance of factor analysis. The value of the KMO (0.5
(Trong & Ngoc, 2005).
- Bartlet test for correlation of observed variables (Sig> 0.05)
Extraction of the Principal axis factoring with Varimax rotation will be used in factor analysis
of independent components (Gerbing & Anderson, 1988).
The scale combination after removing the variables at the remaining 17 reliability
rating stage. The process of analyzing the elements of this scale combination goes through two
steps. Specific analysis results of each step are as follows:
The scale combination after removing the variables at the remaining 17 reliability rating stage.
The process of analyzing the elements of this scale combination goes through two steps.
Specific analysis results of each step are as follows: In Step 1, there were 17 observations that
were included in the Eigenvalue analysis of more than one, only four factors were derived and
Cumulative = 66.452%. The first four were explained by 66.452% of variation. data. The
coefficient KMO = 0.826 (> 0.5) and Bartlet p> 0.01. However, the V14 observation variable
was rejected due to its low transmission coefficient (0.492 <0.5). Step 2, after removing the
16
V14 observation variable, 16 remaining observations were included in the Eigenvalue analysis
of greater than 1, only four factors were extracted and the cumulative index increased to
67.306%. The coefficient KMO = 0.807 (> 0.5) and Bartlet has Sig = 0.00 (p.0.01).
Transmission coefficients of observation variables are 0.5 and up.
Table 2: Rotational factor matrix
observed variablesfactor
V13
V11
V06
V12
V05
V10
V09
V08
V07
V16
V15
V17
V03
V02
V01
V04
a.
1
.816
.801
.741
.625
.562
.523
2
3
4
.880
.839
.797
.837
.823
.822
.769
.757
.563
.545
Extraction Method: Principal Component Analysis.
Rotation converged in 6 iterations.
Table 2, shows that factor analysis results are quite consistent with theoretical model and have
high convergence of observed variables. Observational variables include V01, V02, V03, V04
of the hope factor (HOP), the three variables V15, V15, V17 belong to the factor. Job
Activeness (JACT), 3 variables V07, V08, V09 belong to the factor. Psychonological
Hardiness (PSHA) and 6 variables including V05, V06 V10, V11, V12, V13 belong to the
17
factor. Effort at work (Effort - EFFO). However, there are differences in theoretical models
and the results of factor analysis when the two observed variables V05 and V06 converge on
the Effort factor. It is also quite logical to re-analyze the two questions in the questionnaire
(V05 - No matter what the difficulty, I always commit to work at the company and V06 - When
necessary I am ready to work. Hard work to achieve the goals of work) is meaningful when
asked about the efforts and efforts of employees while working.
IV.2.2. Analyze the factor of dependent variables
After conducting factor analysis of independent concepts, our team analyzed the
dependent concepts in the theoretical model. The three concepts analyzed are (1) Job
Performance, (2) Job Satisfaction, and (3) Job Satisfaction. The analysis results are as follows:
Job Performance (JOPE). Four observational variables were included in the analysis
with high convergence and grouped into one factor. Workload factor has load factors greater
than 0.5 and total error variance is 69.978% and KMO coefficient is 0.718 and Bartlet test has
Sig = 0.00 (p> 0.01).
Table 3: Work Performance Factor Matrix
observed variables
factor
1
V21
.899
V20
.865
V18
.839
V19
.734
Extraction Method: Principal Component Analvsis.
a.1 components extracted.
Job sastifaction factor (JOSA). Four analysis variables converged to the factor, the
observed variables having a load factor greater than 0.5 and a total deviation of 63.893%. The
KMO coefficient is 0.752 and the Bartlet test has Sig = 0.00 (p> 0.01).
18
Table 4: Job satisfaction matrix
observed variables
factor
1
.881
.858
.754
.689
V24
V25
V23
V22
Extraction Method: Principal Component Analysis
a.1 components extracted.
The Life Sastifaction (LISA) factor has four observed variables that are
combined into one factor and have a load factor of greater than 0.7 with a total error of
72.498%. The coefficient KMO = 0.818 (> 0.5) and Bartlet has Sig = 0.00 (p> 0.01).
Table 5: Factor matrix on life satisfaction
V28
V26
V27
V29
component
1
.877
.876
.852
.799
Extraction Method: Principal Component Analysis
a.1 components extracted.
so, after analyzing the independent and dependent factors and from the
theoretical model we will have four models included in the test as follows:
JOPE = 0 + 1*EFFO + 2*PSHA + 3*JACT + 4*HOP (1)
JOSA = 5 + 6*EFFO + 7*PSHA + 8*JACT + 9*HOP (2)
JOSA = 10 + 11*JOPE (3)
LISA = 12 + 13*JOPE + 14*JOSA (4)
19
IV.3. Multiple regression analysis.
IV.3.1. Model testing (1).
Regression correlation analysis was performed with four independent variables
including: Analyzes were performed by the Enter method. Variables are included at the same
time to see which variables are accepted.
This result shows that the regression model is quite consistent with significance level
0.05. The adjusted R2 coefficient = 0.548 means that there is about 54.8% variance. The job
performance is explained by four independent variables: Effort (EFFO), Work Reliability
(PSHA) Attractive job (JACT), Hope (HOP)
Table 6 : shows the suitability of the model
Model summaryb
Model
1
a.
b.
R
.750
R. Square
.563
Adjusted
.548
Std. Error of
.6777218762
Predictors: (Constant), HOP, JACT, PSHA, EFFO
Dependent Variable: JOPE
The F test used in the analysis of variance is the hypothesis test of the suitability of
the overall linear regression model. The idea of this test is the linear relationship between the
dependent variable and the independent variable. In the ANOVA analysis table, we see the sig
value. Very small (sig = 0.00), the regression model is consistent with the data set and can be
used
Table 7: Tests of suitability of the model
ANOVA
Model
Regression
Residual
Total
Sum of Squares
df
68.683
4
53.317
118
122.000
122
Mean
Square
F
Sig
17.171
452
38.002
000a
20
a.
b.
Predictors: (Constant), HOP, JACT, PSHA, EFFO
Dependent Variable: JOPE
Analysis of ANOVA for F = 38,002 (sig = 0.00). Multi-collinearity does not affect
the interpretation of the model with the VIF of each variable equal to 1.00 (<10). The rule is
that when VIF exceeds 10 it is a sign of multi-collinearity (Trong & Ngoc, 2005). The
regression equation demonstrating the relationship between job performance explained by four
independent variables: Effort (EFFO), job stability (PSHA), job attractiveness (JACT) , Hope
(HOP) is expressed by the following expression:
JOPE = -1.626E-16+ 0.437*EFFO + 0.426*PSHA + 0.379*HOP + 0.218*JACT
(1)
TABLE 7: RESULTS RECORDED BY THE ENTER METHOD
Coefficients
model
Unstandardized
coefficients
Sig
Correlations
Collinearity
statistics
Zerroorder Partia
Part Toleran
VIF
437
426
218
379
437
426
218
379
1000
1000
1000
1000
Std. Error beta
B
-1.626
1 Constant 16
437
EFFO
426
PSHA
218
JACT
379
HOP
a.
StandardizedT
Coefficient
061
061
061
061
061
437
426
218
379
000
1.000
7.715
7.004
3.576
6.220
000
000
001
000
551
542
313
497
1000
1000
1000
1000
Dependent Variable: JOPE
To determine which independent variables play a more important role in dependent variables,
we use Partial correlations. Regression results show that the composition of job attractiveness
has the most important impact on job satisfaction for sales & marketing staff (Partial = 0.668),
21
followed by Work Effort (Partial = 0.428), followed by Hope (Partial = 0.364), and finally the
Partial = 0.238 component.
IV.3.3. Model testing (3)
Regression correlation analysis was performed with four independent variables including:
Effort (EFFO), Work Stability (PSHA), Work Motivation (JACT), Hope (HOPE) Enter by the
Enter method to see which variable to accept. This result shows that the regression model is
quite consistent with 0.05. The adjusted R2 coefficient = 0.539 means that there is about 53.9%.
Job satisfaction explained by four independent variables is: Effort (EFFO), persistence in work
(PSHA), job attractiveness (JACT), hope.
Table 8: Conformity assessment of the model
Model summary
Model
R
R Square
Square
1
744
554
539
Predictors: (constant), HOP,JACT,PSHA,EFFO
Dependent Variable: JOSA
a.
b.
The Estimate
67911891
The F test used in the analysis of variance is the hypothesis test of the suitability of
the overall linear regression model. The idea of this test is the linear relationship between the
dependent variable and the independent variable. In the ANOVA analysis table, we see the sig
value. Very small (sig = 0.00), the regression model is consistent with the data set and can be
used.
.
Table 9: Tests of suitability of the model
ANOVA
Model
Sum of squaresDf
Regression 67.578
Residual
54.422
Total
122.000
a.
b.
Mean
Square
16.895
461
4
118
122
Predictors: (Constant), HOP, JACT, PSHA, EFFO
Dependent Variable: JOSA
22
F
Sig
36.631
000a
Analysis of ANOVA for F = 38,002 (sig = 0.00). Multi-collinearity does not affect
the interpretation of the model with the VIF of each variable equal to 1.00 (<10). The rule is
that when VIF exceeds 10 it is a sign of multi-collinearity (Trong & Ngoc, 2005).
The regression equation demonstrating the relationship between job performance
explained by four independent variables: Effort (EFFO), job stability (PSHA), job
attractiveness (JACT) , Hope (HOP) is expressed by the following expression:
JOPE = -1.626E-16+ 0.437*EFFO + 0.426*PSHA + 0.379*HOP + 0.218*JACT
(1)
Table 10: Results received by enter method
Coefficients
Model
Unstandardized
Coefficient
B
StandardizeT
d
coefficient
Std. Error BETA
Sig
1 (Constant)1.104
0.61
000
1.000
EFFO
PSHA
JACT
HOP
061
061
061
061
5.144
2.665
9.746
4.240
000
009
000
000
a.
316
164
599
261
164
599
261
Correlations
Collinearity
statistics
ZerroordPartial Part
er
Tolearnce VIF
316
164
599
261
428
238
668
364
316
164
599
261
1000
1000
1000
1000
Dependent Variable: JOSA
To determine which independent variables play a more important role in dependent
variables, we use Partial correlations. The regression results show that the composition of job
attractiveness has the most significant impact on job satisfaction for sales & marketing staff
(Partial = 0.668), followed by Work Effort (Partial = 0.428), followed by Hope (Partial =
0.364), and finally the Partial = 0.238 component.
23
1000
1000
1000
1000
IV.3.3. Model testing (3)
Correlation regression analysis was performed with a single independent variable
including: JOPE impact on Job satisfaction (JOSA). This is done by the Enter method to see if
it is accepted. This result shows the regression model given relative
In line with significance level 0.05. R2 = 0.342 means that there is about 34.2% variance. Job
satisfaction explained by an independent variable is job achievement. Job performance and job
satisfaction are shown to be quite correlated.
Table 11: Conformity assessment of the model
Model Summary
a.
Model
R
R Square
1
574
330
Adjusted
Square
324
Std. Error of
the Esitmate
82202121
Predictors: (constant), JOPE
Table 12: Tests of fit of model
ANOVA
a.
b.
Model
Sum of squares
df
Regression 40.238
1
Residual
81.762
121
Total
122.000
122
Predictors: (Constant), JOPE
Dependent Variable: JOSA
Mean Square F
40.238
59.548
676
Sig
000
The F test used in the variance analysis is the hypothesis test of the suitability of the overall
linear regression model. The idea of this test is the linear relationship between the dependent
variable and the independent variable. In the ANOVA analysis, we see that F = 59.548 and sig
= 0.00, so the regression model is consistent with the data set and can be used.
Table 13: Results recommended by enter method
Coefficients
24
Model
Unstandardized
Coefficients
Standardized
Coefficients
B
Beta
Std. Error
-9.045
1 (Constant) 574
2 JOPE
a.
0.74
0.74
Correlations
Sig
t
574
000
1.000
7.717 000
Dependent Variable: JOSA
The regression equation demonstrating the relationship between job satisfaction explained by
the independent variable Job Performance (JOPE) is shown by the following expression:
JOSA = -9.045E-17+ 0,574*JOPE (3)
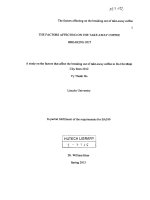
IV.3.4.
TESTING
THE
MODEL
Regression correlation analysis was performed with 2 independent variables including Job
Performance (JOPE), Job Satisfaction (JOSA) and Dependent Variable as Life Satisfaction
(LISA). This is done by the Stepwise method to see which variables are accepted. This result
shows that the regression model is relatively consistent with significance level 0.05. The
coefficient R2 = 0.241 means that there is about 24.1% variance. The satisfaction in life
explained by an independent variable is job achievement. But when both variables were found
at work and job satisfaction at the same time, the coefficient R2 = 0.278, which means that
about 27.8% of the variance was explained for satisfaction in life. Thus, the relationship
between the two concepts of job achievement and job satisfaction shows a relatively small
(approximately 30%) satisfaction in the lives of sales & marketing staff. The remaining 70%
of life satisfaction is due to factors other than their work.
25