Landslide susceptibility modeling optimization and factor effect analysis
Bạn đang xem bản rút gọn của tài liệu. Xem và tải ngay bản đầy đủ của tài liệu tại đây (2.77 MB, 18 trang )
6
Landslide Susceptibility Modeling:
Optimization and Factor Effect Analysis
Biswajeet Pradhan and Maher Ibrahim Sameen
6.1
Introduction
Landslides are considered devastating natural geohazards
worldwide; they pose significant threats to human life and
result in socioeconomic losses in many countries (Mahalingam et al. 2016). A literature search shows that considerable efforts have been exerted to develop new ideas and tools
that can improve the mitigation of landslide effects. One field
that is attracting the attention of an increasing number of
researchers worldwide is landslide susceptibility modeling
(LSM). LSM is the basic information required for hazard and
risk assessments; it is also a critical component in disaster
management and mitigation (Pradhan and Lee 2009; Bui
et al. 2015; Gaprindashvili and van Westen 2016). Significant
studies on landslide susceptibility mapping were conducted
in the last decades, thereby creating new ideas and research
directions for future studies. The optimization of landslide
conditioning factors (Jebur et al. 2014), the study of the
effects of landslide sampling procedures (Hussin et al. 2016),
the development of novel and hybrid models (Moosavi and
Niazi 2015), and the analysis of the effects of landslide factors (Guo and Hamada 2013) are among recent and significant research directions in landslide susceptibility studies.
Landslides are triggered by several factors that create
challenges for researchers in analyzing and predicting different types of landslides. In general, geomorphological,
topographical, geological, and hydrological factors are
among the factors that are widely studied and considered in
LSM (Pradhan 2013; Pereira et al. 2013). However, landslide conditioning factors, such as slope, aspect, land use,
distance to road, and vegetation density are not consistent
among studies. In addition, the quality and quantity of data
can also vary, thereby affect the accuracy of LSM. Therefore, a detailed analysis and comprehensive investigation of
the input data before LSM is performed are important to
B. Pradhan (&) Á M.I. Sameen
Department of Civil Engineering, University Putra Malaysia,
Serdang, Malaysia
e-mail:
© Springer International Publishing AG 2017
B. Pradhan (ed.), Laser Scanning Applications in Landslide Assessment,
DOI 10.1007/978-3-319-55342-9_6
increase the accuracy of landslide susceptibility models. In
addition, recent advances in light detection and ranging
(LiDAR) technology enable landslide researchers to collect
high-quality data (Kasai et al. 2009). Nevertheless, challenges remain because of the variability in topography and
other conditions of different study areas.
Several studies have attempted to provide insights into
landslide conditioning factors and have investigated these
factors for LSM. Mahalingam et al. (2016) evaluated landslide
susceptibility
mapping
techniques
using
LiDAR-derived factors in Oregon City. The results of their
study showed that only a few factors were necessary to
produce satisfactory maps with a high predictive capability
(area under the curve >0.7). Qin et al. (2013) investigated
uncertainties caused by digital elevation map (DEM) error in
LSM. The uncertainty assessment showed that modeling
techniques could have varying sensitivities to DEM errors.
Mahalingam and Olsen (2015) assessed the influences of the
source and spatial resolution of DEMs on derivative products used in landslide mapping. Their study showed that a
fine resolution would not necessarily guarantee high predictive accuracy in landslide mapping, and the source of the
datasets would be an important consideration in LSM. The
effects of landslide conditioning factor combinations on the
accuracy of LSM were explored by Meten et al. (2015). In
their study, the accuracy of LSM was improved by removing
certain landslide conditioning factors based on their correlations with other factors. Kayastha (2015) conducted a
study on factor effect analysis using the frequency ratio
(FR) model in Nepal. The results indicated that using all nine
causative factors produced the best success rate accuracy of
over 80%. However, in the study of Vasu and Lee (2016), an
LSM with 13 relevant factors selected from the initial 23
factors presented a success rate of 85% and a prediction rate
of 89.45%. Hussin et al. (2016) evaluated the effects of
different landslide sampling procedures on a statistical susceptibility model. The study demonstrated that the highest
success rates were obtained when sampling shallow
115
116
landslides as 50 m grid points and debris flow scarps as
polygons. The highest prediction rates were achieved when
the entire scarp polygon method was used for both landslide
types. The sample size test using the landslide centroids
showed that a sample of 104 debris flow scarps was sufficient to predict the remaining 941 debris flows, whereas 161
shallow landslides were the minimum number required to
predict the remaining 1451 scarps.
The current study used 15 landslide conditioning factors
and an adequate number of landslide inventories to investigate the optimization of landslide conditioning factors and
conduct a factor effect analysis for developing landslide
susceptibility models in the Cameron Highlands, western
Malaysia. After multicollinearity and factor effect analyses
were performed, Ant colony optimization (ACO) was utilized to select significant landslide conditioning factors
among the initial 14 factors for further analysis. Data mining
techniques, including support vector machine (SVM) and
random forest (RF), were used to analyze the effects of the
selected landslide conditioning factors on the prediction rate
accuracy of the susceptibility models. Details and discussions on the obtained results are presented in the remainder
of this chapter.
B. Pradhan and M.I. Sameen
6.2
Study Area and Landslide Inventory
Data
The Cameron Highlands is a tropical rain forest district
located in western Malaysia at the northwestern tip of
Pahang. It is approximately 200 km from Kuala Lumpur.
Previous studies have reported several landslides in this
region, which have caused significant damages to properties
(Khan 2010). The lithology of the Cameron Highlands
mainly consists of Quaternary and Devonian granite and
schist (Pradhan and Lee 2010). The granite in the Cameron
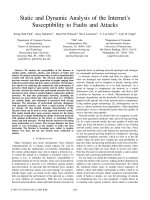
Highlands is classified as megacrysts biotite granite (Pradhan and Lee 2010). A subset that occupies a surface area of
approximately 25 km2 was selected for the current study
because of the frequent occurrence of landslides in this area
(Fig. 6.1). The lowest and highest altitudes are 889.61 and
1539.49 m, respectively.
Multisource remote sensing images and geographic
information system (GIS) data were used to collect and
prepare a landslide inventory database for LSM. Remote
sensing data, including archived 1: 10,000–1: 50,000 aerial
photographs, SPOT 5 panchromatic satellite images, and
high-resolution LiDAR-based orthophotos, were used to
Fig. 6.1 Geographic location of the study area and the landslide inventory map created by using multisource remote sensing data
6
Landslide Susceptibility Modeling …
visually detect landslide occurrences in the study area. In
addition, all historical landslide reports, newspaper records,
and archived data for the period under examination were
collected. The locations of the individual landslides were
drawn on 1:25,000 maps based on the site description,
archived database, and aerial photograph interpretation.
Field observations were performed to confirm fresh landslide
scarps. In the aerial photographs and SPOT 5 satellite images, historical landslides could be observed as breaks in the
forest canopy, bare soil, or geomorphological features, such
as head and side scarps, flow tracks, and soil and debris
deposits below a scarp. These landslides were then classified
and sorted based on their modes of occurrence. Most of the
landslides are shallow rotational, whereas a few are translational. A few landslides that occurred in flat areas were not
considered, and thus eliminated from the analysis. To create
a database for assessing the surface area and number of
landslides in the study area, landslides were mapped within
an area of 25 km2. The landslide inventory map is shown in
Fig. 6.1.
6.2.1 Preparation of Landslide Conditioning
Factors
A geospatial database that contained 15 landslide conditioning factors was prepared for susceptibility analysis in
GIS. Some factors were derived from a LiDAR-based DEM
and Advanced Spaceborne Thermal Emission and Reflection Radiometer (ASTER) images, whereas others were
digitized from GIS layers collected from government
agencies. First, a DEM at 0.5 m spatial resolution was
created from LiDAR point clouds using a multiscale curvature algorithm and inverse distance weighted (IDW) interpolation techniques implemented in ArcGIS 10.3.
Subsequently, slope, aspect, profile, and plan curvature
were derived from the generated DEM at 0.5 m spatial
resolution using the spatial analysis tools of GIS. In the case
of curvature, negative curvatures represent concave surfaces, zero curvatures represent flat surfaces, and positive
curvatures represent convex surfaces. In addition, four
hydrological factors, namely the topographic wetness index
(TWI), the topographic roughness index (TRI), the stream
power index (SPI), and the sediment transport index (STI),
were derived from the slope and flow accumulation layers.
The land cover map was prepared from SPOT 5 satellite
images (10 m spatial resolution) using a supervised classification method. The map was verified via field survey.
Then, 10 classes of land cover types were identified,
including water bodies, transportation, agriculture, residential, and bare land. The normalized difference vegetation
index (NDVI) map was generated from SPOT 5 satellite
images (10 m spatial resolution). The NDVI value was
117
calculated using the formula NDVI = (IR − R)/(IR + R),
where IR and R denote the energy reflected in the infrared
and red portions, respectively, of the electromagnetic
spectrum. Finally, distance to road, distance to river, and
distance to lineament were calculated based on the Euclidean distance method using the GIS layers.
Several studies have explained the contributing factors of
a landslide. The significance of a particular factor depends
on site-specific conditions. In the current study, soil and
lithology were not used because the study area consists of
only one type of soil and lithology. However, 15 factors
were used, namely altitude, slope, aspect, profile curvature,
plan curvature, land use, TWI, TRI, SPI, STI, NDVI, vegetation density, distance to road, distance to river, and distance to the fault. The succeeding paragraphs briefly
describe these factors.
Altitude is controlled by several geological and geomorphological processes. Landslides typically occur at
intermediate elevations because slopes tend to be covered by
a layer of thin colluvium, which is prone to landslides. In
this study, the lowest and highest altitudes were 889.61 and
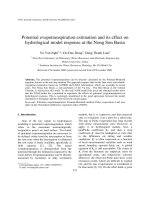
1539.49 m, respectively. The altitude layer was reclassified
into six classes using the quantile classification method, as
shown in Fig. 6.2d.
The slope is a measure of the rate of change in elevation
in the direction of the steepest descent and is considered the
main cause of landslides. The slope gradient map of the
study area was divided into six slope angle classes. The
study area has flat regions. The highest slope was observed
at 80° (Fig. 6.2e).
Aspect is defined as the slope direction measured (in
degrees) from the north in a clockwise direction. It ranges from
0° to 360°. Parameters, such as exposure to sunlight, rainfall,
and dry winds control the concentration of soil moisture,
which in turn, determines landslide occurrence (Fig. 6.2f).
Plan curvature is described as the curvature of a contour
line formed by the intersection of a horizontal plane with the
surface. It influences the convergence and divergence of flow
across a surface. Profile curvature, in which the vertical
plane is parallel to the slope direction, affects the acceleration and deceleration of downslope flows and, consequently,
influences erosion and deposition. Plan and profile curvature
maps were reclassified into three classes, namely convex,
flat, and concave lands, with negative, zero, and positive
values, respectively (Figs. 6.2g and h).
In addition to the topographical factors, land use, NDVI,
and vegetation density are key conditioning factors that
contribute to the occurrence of landslides. Sparsely vegetated areas are more prone to erosion and increased instability than forests. Vegetation strengthens the soil through an
interlocking network of roots that forms erosion-resistant
mats that stabilize slopes. Evapotranspiration controls the
wetness of slopes. NDVI is frequently considered a
118
Fig. 6.2 Landslide conditioning factor used in the current study
B. Pradhan and M.I. Sameen
6
Landslide Susceptibility Modeling …
Fig. 6.2 (continued)
119
120
Fig. 6.2 (continued)
B. Pradhan and M.I. Sameen
6
Landslide Susceptibility Modeling …
Fig. 6.2 (continued)
121
122
controlling factor in landslide susceptibility mapping. In
general, when the value of NDVI is high, the area covered
by vegetation is large. Furthermore, a relatively low vegetation coverage can easily lead to a landslide incident. In this
study, a land use layer that consisted of 10 classes was used
for LSM. Vegetation density was reclassified into four
classes, namely non-vegetation, low vegetation, moderate
vegetation, and dense vegetation (Fig. 6.2a). NDVI was
reclassified into six classes starting from the lowest value of
−0.521 to 0.96 (Fig. 6.2b).
Four hydrological factors were also used for LSM in the
current study. TWI describes the effects of topography on
the location and size of saturated source areas of runoff
generation. This index is calculated using Ln[AS/tan(b)],
where AS is the specific catchment area of each cell, and b
represents the slope gradient (in degrees) of the topographic heights. SPI, which is a measure of the erosion
power of a stream, is also considered a factor that contributes to the stability of the study area. This index is
expressed as SPI = AS Â tan(b), where AS is the area of a
specific catchment, and b is the local slope gradient measured in degrees. STI, which reflects the erosive power of
overland flow, is derived by considering transport capacity
limiting sediment flux and catchment evolution erosion
theories. TRI is another important factor that affects landslide susceptibility. These hydrological factors were
reclassified into six classes using the quantile method and
then applied in LSM.
Anthropogenic factors, such as distance to roads, distance
to rivers, and distance to faults, have been considered
important factors that influence landslides. Extensive excavations, application of external loads, and vegetation
removal are some of the most common actions that occur
along road network slopes during their construction. The
intermittent flow regime of a hydrological network and
gullies encompasses erosive and saturation processes,
thereby increasing pore water pressure and leading to landslides in areas adjacent to drainage channels. In addition,
geological faults are important triggering factors of landslides. The fracturing and shearing degree plays an important
role in determining slope instability. Proximity (buffers) to
these structures increases the likelihood of landslides given
that selective erosion and the movement of water along fault
planes promote these phenomena. The aforementioned layers were reclassified into six classes using the quantile
method.
B. Pradhan and M.I. Sameen
6.3
Methodology
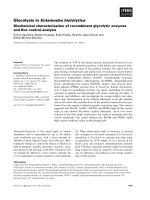
6.3.1 Overall Research Flow
This study encompasses four methodological steps. The first
step is the multicollinearity and factor effect analyses. In the
second step, relevant factors among the initial 15 landslide
conditioning factors are selected using ACO. The third step
involves the application of the susceptibility models using
several experiments that aim to analyze the effects of relevant factors. In the last step, susceptibility models are validated using receiver operator characteristic (ROC) curves.
The overall workflow of this study is shown in Fig. 6.3.
6.3.2 Selection of Relevant Factors Using ACO
ACO is a metaheuristic optimization technique whose
applications have developed significantly. The advantages of
ACO include a probabilistic decision in terms of artificial
pheromone trails and local heuristic information. These
advantages enable the exploration of a larger number of
solutions compared with that of greedy heuristics (Gottlieb
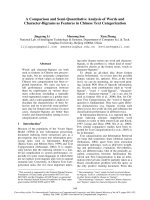
et al. 2003). The overall workflow of the ACO-based landslide factor selection is presented in Fig. 6.4. First, ants were
generated and then placed randomly on a graph, i.e., each ant
starts with one random landslide factor. The number of ants
placed on the graph may be set to be equal to the number of
factors of the data; each ant initiates a path construction at a
different factor. The ants traverse nodes probabilistically
from their initial positions until a traversal stopping criterion
is satisfied. The resulting subsets are gathered and evaluated.
When an optimal subset has been found or when the algorithm has been executed a certain number of times, the
process stops and the best encountered factor subset is outputted. If none of these conditions hold, then the pheromone
is updated, a new set of ants are created, and the process is
reiterated.
6.3.3 Susceptibility Models
In this study, susceptibility maps were produced using two
data mining approaches: SVM and RF. These algorithms
were used to determine whether the results were consistent
or the performance of the susceptibility models with
6
Landslide Susceptibility Modeling …
123
Fig. 6.3 Overall research activities used to optimize landslide conditioning factors, conduct factor effect analysis, and develop improved
susceptibility models
Fig. 6.4 Overall workflow of factor subset selection by ACO method
124
significant factors varied from one model to another. The
subsequent sections briefly describe the basic concept of the
algorithms.
6.3.3.1 SVM
SVM was originally developed by Vladimir and Vapnik
(1995) as a more recent machine learning method than
artificial neural networks. SVM uses the training data to
convert the original input space implicitly into
high-dimensional feature space based on kernel functions
(Brenning 2005). Subsequently, the optimal hyperplane in
the feature space is determined by maximizing the margins
of class boundaries (Abe 2005). Therefore, SVM training is
modeled by constraining the duality optimal solution. In
general, kernel types include linear, polynomial, and radial
basis function (RBF) or Gaussian kernels. The RBF kernel
was applied in this study because it was proven to be the
most powerful kernel for addressing nonlinear cases (Yao
et al. 2008).
6.3.3.2 RF
RF is an ensemble machine learning method that generates
numerous classification trees that are combined to compute a
classification (Breiman et al. 1984; Breiman 2001). Hansen
and Salamon (1990) indicated that a necessary and sufficient
condition for an ensemble of classification trees to be more
accurate than any of its individual member was that the
members of the ensemble must perform better than random
members and should be diverse. RF increases diversity
among classification trees by resampling the data with
replacement and randomly changing the predictive variable
sets over different tree induction processes. The RF algorithm involves two main user-defined parameters that require
appropriate specifications: the number of trees (k) and the
number of predictive variables. A predictive variable may be
numerical or categorical, and translation into the design
variables is unnecessary. An unbiased estimate of the generalization error is obtained during the construction of an
RF. The proportion of misclassifications (%) overall
out-of-bag (OOB) elements is called the OOB error.
The OOB error is an unbiased estimate of the generalization
error. Breiman (2001) proved that RF produces a limiting
value of the generalization error. As the number of trees
increases, the generalization error always converges. The
value of k must be set sufficiently high to allow this convergence. The RF algorithm estimates the importance of a
predictive variable by examining the OOB errors. An
increase in the OOB error is relative to predictive variable
importance.
B. Pradhan and M.I. Sameen
The advantages of RF include resistance to overtraining
and the capability to grow a large number of RF trees
without creating a risk of overfitting. RF algorithm data do
not need to be rescaled, transformed, or modified; they are
also resistant to outliers in predictors. In this study, the
number of trees in an RF was fixed at 500 for RF modeling
after a primary analysis, and m sampled at each node was set
at 3 to analyze the combined contributions of subsets of
features while maintaining fast convergence during iterations. No calibration set is required to regulate the parameters (Micheletti et al. 2014). The importance and
standardized rank of each landslide variable were calculated.
The ranks were then used to overlay landslide factors and
generate the susceptibility maps.
6.4
Results
6.4.1 Multicollinearity Analysis
Multicollinearity analysis is an important step in LSM. The
existence of a near-linear relationship among factors can
create a division-by-zero problem during regression calculations. This problem can cause the calculations to be
aborted and the relationship to be inexact; division by an
extremely small quantity still distorts the results. Therefore,
analyzing landslide conditioning factors before LSM is
important. In multicollinearity analysis, collinear (dependent) factors are identified by examining a correlation matrix
constructed by calculating R2. Various quantitative methods
for detecting multicollinearities, such as pairwise scatter
plots, estimation of the variance inflation factor (VIF), and
investigation of eigenvalues in a correlation matrix, are
available. In this study, multicollinearity was detected by
calculating the VIF values of each landslide conditioning
factor. In addition, communalities similar to R2 were calculated for each factor (Costello 2009). Communality shows
how well a variable is predicted by the retained factors.
Table 6.1 presents the estimated communalities and VIF
values for each landslide conditioning factor. The second
column of Table 6.1 indicates that some factors, such as land
use, distance to road, distance to river, slope, STI, TWI, and
TRI, exhibit strong linear relationships with other factors.
These factors may negatively affect the regression analysis.
However, VIF values are quantitative measures that are
typically used to conclude whether a factor has a problem. In
some studies, a VIF greater than two was considered problematic, whereas in other studies, a VIF greater than 10 was
considered problematic (Garrosa et al. 2010). To solve the
6
Landslide Susceptibility Modeling …
Table 6.1 Calculated
communalities and VIF values for
each landslide conditioning factor
125
Factors
Communality
VIF
Aspect
0.053
1.14
Land use
0.566
3.15
Vegetation density
0.044
2.9
NDVI
0.069
2.93
Distance to lineament
0.001
1.25
Distance to road
0.576
3.74
Distance to river
0.626
4.15
Altitude
0.35
2.47
Slope
0.608
9.02
Profile curvature
0.015
1.11
Plan curvature
0.1
1.25
SPI
0.311
1.57
STI
0.684
2.77
TWI
0.638
2.46
TRI
0.589
39.79
multicollinearity problem, factors can be excluded from
further analysis or other sampling techniques should be
examined. In this study, factors with VIF values greater than
10 (e.g., TRI) were removed from further analysis.
6.4.2 Factor Analysis
The previous section shows that multicollinearity analysis
identifies landslide factors that exhibit the problem of having
a strong correlation with other remaining factors. To determine underlying factors that are responsible for correlations
in data, factor analysis was conducted in the current study.
Factor analysis is an investigative method that is applied to a
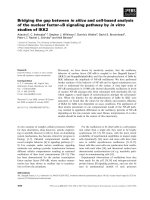
Fig. 6.5 Graph of factors versus
the corresponding eigenvalues
calculated based on the
correlation matrix
set of observed variables; it aims to identify underlying
factors from which observed variables are generated (Roscoe
et al. 1982). Factor analysis using the principal component
extraction method was applied in this study to determine the
factors that underlay the data. Figure 6.5 shows the graph of
the underlying factors versus the eigenvalues calculated
based on the correlation matrix. The graph provides information about the factors. It was used to determine how well
the selected number of components fit the data. The graph
indicated that the first eight factors accounted for the
majority of the total variability in the data (given by the
eigenvalues). The remaining factors accounted for a minimum amount of the variability (nearly zero) and were likely
insignificant.
4
Eigenvalue
3
2
1
0
1
2
3
4
5
6
7
8
9
Factor Number
10
11
12
13
14
15
126
Table 6.2 presents the sorted unrotated factor loadings
and communalities resulting from the factor analysis.
Communalities describe the proportion of variability of each
variable that is explained by the factors. When a communality is closer to 1, the variable is better explained by the
factors. Variance demonstrates the variability in the data
explained by each factor (i.e., the variance is equal to the
eigenvalue). Meanwhile, %Var shows the proportion of
variability in the data explained by each factor.
In the factor analysis, 8 factors were extracted from the 15
variables. All the variables were well-represented by the 8
selected factors given that the corresponding communalities
were generally high. For example, 0.974 or 97.4% of the
variability in aspect and profile curvature was explained by
the 8 factors. In addition, the 8 selected factors explained
most of the total data variation (0.881 or 88.1%, Table 6.2).
Furthermore, Table 6.2 shows the variable loading on each
factor. For example, distance to river (−0.823), distance to
road (−0.796), land use (0.795), slope (0.779), TRI (0.77),
altitude (−0.656), TWI (−0.322), and NDVI (0.324) have
large absolute loadings on factor 1. This result indicates that
this subset of variables can be reduced into fewer variables.
By contrast, STI (0.84), TWI (0.782), SPI (0.718), and plan
curvature (−0.402) have large absolute loadings on factor 2.
This finding suggests that these factors can be combined and
reduced into fewer theoretical factors. In addition, land use,
NDVI, and vegetation density have large absolute loadings
on factor 3, thereby suggesting that a theoretical factor can
combine these three interrelated factors. Furthermore, several factors, including slope, aspect, and profile curvature,
have large loadings on factor 4. LiDAR-derived factors and
distance to the road have large absolute loadings on factor 5.
SPI, distance to lineament, and both curvature layers have a
few underlying factors. Aspect and profile curvature have
large positive loadings on factor 7. Plan and profile curvatures have large absolute loadings on factors 5, 6, and 8. This
finding indicates that these two variables can be combined
into one variable. This resulting variable can be the total
curvature, which has not been used in the current study.
6.4.3 ACO-Based Factor Selection
Table 6.3 shows the landslide conditioning factors and their
corresponding codes used in the subsequent tables. This
section describes the six experiments conducted in this study
to analyze the effects of landslide conditioning factors on
LSM.
The six experiments were classified into two main
groups. The first group included all the 14 factors
(Table 6.4), whereas the second group contained only the
LiDAR-derived factors. In the first group, the three experiments included 5 factors, 10 factors, and the produced
B. Pradhan and M.I. Sameen
susceptibility models that used all the 14 factors. In the
second group, the three experiments involved 3 LiDAR
factors, 6 LiDAR factors, and 8 LiDAR factors, which were
the total number of LiDAR factors derived from the DEM.
These subsets were evaluated using the SVM and RF
models. The selected factors and the prediction accuracy rate
of both models are presented in Table 6.4. The results
showed that using all the conditioning factors did not necessarily guarantee the highest accuracy. In the case of the
first group, the highest accuracy was achieved with either 10
or 14 factors when the RF model was used. In the case of the
SVM model, using all the 14 factors produced the highest
accuracy. In the three experiments in the first group, the RF
model performed better than the SVM model. However, no
significant difference was found between using all the 14
factors and using only 10 factors in the susceptibility analysis for both the SVM and RF models. In the experiments in
the second group, accuracy decreased by approximately 0.16
on average. This result indicated that some factors, such as
land use, vegetation density, and NDVI, were important for
predicting landslides in the study area. The highest accuracy
was achieved using the RF model with 8 LiDAR factors.
The RF model with only 3 factors selected via ACO performed better than the SVM model with 8 LiDAR factors. In
the SVM model, the findings indicated that using only 3
LiDAR factors yielded better results than using 6 factors
mainly because the selected individual factors in the subset
with 3 factors were more important than those selected in the
subset with 6 factors. Consequently, including additional
factors to LiDAR-derived factors was necessary for accurate
LSM in the study area. The RF model performed better than
the SVM model even with fewer factors. The second subset
of the first group, which had 10 factors that included
LiDAR-derived and non-LiDAR-derived factors, was recommended to produce landslide susceptibility maps in the
study area for land use planning.
6.4.4 Landslide Susceptibility Models
In the current study, four landslide susceptibility maps were
produced for the study area (Fig. 6.6). These maps were
generated using the SVM and RF models with the best
subsets of the two groups as described in the previous section. The first examination of the maps showed no spatial
agreement among the susceptibility classes of the four
models. For example, the maps produced using a combination of LiDAR and non-LiDAR factors were different from
those produced using only LiDAR factors. In addition, the
two maps produced using the SVM and RF models with the
significant factors selected among the 14 factors were different. The apparent difference was mainly observed in the
middle part of the study area. The map produced using the
0.216
0.003
−0.157
4.0649
0.271
Profile Curvature
Variance
% Var
0.138
2.0748
−0.402
−0.213
Plan Curvature
0.118
1.7765
−0.112
−0.09
0.112
−0.119
0.274
Aspect
0.088
1.3129
−0.442
−0.182
0.404
0.691
0.086
1.2884
0.448
0.503
−0.153
−0.002
0.173
0.14
−0.009
−0.835
0.164
0.109
−0.005
0.324
−0.05
NDVI
Distance to Lineament
0.718
0.278
0.265
Vegetation Density
0.121
−0.112
0.033
−0.196
−0.022
0.104
SPI
0.048
0.015
−0.851
0.782
−0.322
TWI
−0.427
−0.434
−0.413
0.105
−0.252
−0.345
Factor5
0.188
−0.295
0.051
0.84
0.236
STI
−0.125
−0.303
0.182
−0.176
−0.04
Factor4
0.102
−0.045
−0.656
−0.174
−0.138
0.77
Altitude
−0.175
TRI
0.304
−0.14
Slope
−0.003
0.795
0.779
Land use
−0.289
−0.04
−0.796
Distance to Road
−0.194
−0.025
−0.823
Distance to river
Factor3
Factor2
Factor1
Variable
Table 6.2 Sorted unrotated variable loadings on extracted factors resulted from factor effect analysis
0.072
1.0738
0.424
0.374
−0.073
0.586
−0.043
−0.061
0.403
−0.175
0.092
0.29
0.216
0.21
0.074
−0.019
0.131
Factor6
0.06
0.8964
0.369
0.056
0.817
−0.124
−0.033
−0.002
−0.114
0.13
0.134
−0.042
0.025
0.016
−0.025
0.083
0.12
Factor7
0.049
0.7292
−0.474
0.534
0.11
0.084
−0.07
−0.005
0.037
0.089
0.189
−0.257
0.084
0.081
−0.206
0.166
−0.021
Factor8
0.881
13.217
0.974
0.93
0.974
0.872
0.899
0.905
0.707
0.789
0.875
0.818
0.971
0.97
0.817
0.848
0.868
Communality
6
Landslide Susceptibility Modeling …
127
128
B. Pradhan and M.I. Sameen
Table 6.3 Assigned code of
each landslide conditioning factor
Factor
Code
Aspect
1
Distance to Road
Land use
2
Distance to river
7
SPI
12
Vegetation density
3
Altitude
8
STI
13
NDVI
4
Slope
9
TWI
14
Distance to lineament
5
Profile curvature
10
RF model exhibited nearly moderate and very high susceptibility in the middle part of the study area, whereas the map
produced using the SVM model exhibited high and very
high susceptibility in the same area. The southeastern part of
the study area had very low and low susceptibility based on
the RF model, whereas its susceptibility was moderate and
high based on the SVM model. Consequently, no exact
spatial agreement was found on the susceptibility classes in
most parts of the study area based on the two models. The
susceptibility maps produced using only LiDAR-derived
factors are different from those produced using the significant factors selected among the 14 factors. However, spatial
agreements were found among the susceptible zones in the
northern, middle, and southern parts of the study area when
the RF- and SVM-generated maps were compared.
6.4.5 Validation
The ROC curve is a graph with a false positive rate plotted
on the x-axis and a true positive rate plotted on the y-axis. It
uses a visual comparison of the performance of the methods.
The area under the ROC curve (AUC) shows the global
accuracy statistics for each model. If the AUC (which varies
from 0.5 to 1) increases, then the prediction performance of
the method increases (Erener and Düzgün 2010). Figure 6.7
shows the plotted ROC curves and the estimated AUC
values for the four susceptibility maps described in previous
section. On the one hand, the highest accuracy was achieved
using the RF model with 10 factors selected among the 14
initial factors. On the other hand, the lowest accuracy was
achieved using the SVM model with only LiDAR-derived
factors.
6.5
Discussion and Conclusion
In this study, we optimized landslide conditioning factors
and conducted a factor effect analysis to provide useful
information about landslide susceptibility analysis in the
Cameron Highlands, Malaysia. This study first identified
problematic factors by calculating VIF values during multicollinearity analysis. As mentioned earlier, problematic
factors can disrupt or distort the regression results.
6
Plan curvature
11
Therefore, removing these factors is an essential step in
LSM. The communality of each variable was calculated
from the correlation matrix. The communalities indicated
that land use (0.566), distance to road (0.576), distance to
river (0.626), altitude (0.35), slope (0.608), SPI (0.311), STI
(0.684), TWI (0.638), and TRI (0.589) demonstrated relatively strong correlations with other factors. However, only
TRI was problematic (given by the VIF) based on the
selected threshold (VIF > 10 was considered problematic),
and thus, it was excluded from LSM. In addition, slope had a
relatively high VIF of approximately 10. However, slope is
the most important factor for LSM, and thus, it has been
retained. In future studies, this problem could be solved by
using different sampling procedures, such as landslide
polygons instead of the centroid of landslides, which was
adopted in the current study. The use of different sampling
procedures or the removal of inaccurate landslide inventories
may solve the problem of collinear factors.
Factor analysis was conducted to identify underlying
factors. The eigenvalues showed that the first 8 factors
accounted for the majority of the total variability in the data.
The remaining factors accounted for a minimal amount of
the variability (approximately 0) and were likely insignificant. Therefore, 8 factors were extracted from the 15 landslide conditioning factors. The corresponding communalities
were generally high, and thus, the landslide-related variables
were well-represented by the 8 factors. The highest percentage of over 97% of the variability in aspect and profile
curvature was explained through these 8 extracted factors. In
general, the factor effect analysis suggested reducing the
number of landslide conditioning factors by combining some
of the factors into fewer theoretical factors. For example,
plan and profile curvature were highly recommended to be
combined (Table 6.2). To achieve such combination, a
comprehensive analysis of landslide conditioning factors is
required. In addition, distance to river (−0.823), distance to
road (−0.796), land use (0.795), slope (0.779), TRI (0.77),
altitude (−0.656), TWI (−0.322), and NDVI (0.324) were
found to have large absolute loadings on factor 1. This result
indicated that this subset of variables could be reduced into
fewer theoretical factors.
Thereafter, ACO was used to select significant variable
subsets from the available variables. The SVM and RF
classification models were adopted to evaluate the selected
6
Landslide Susceptibility Modeling …
129
Fig. 6.6 Landslide susceptibility maps
subsets. A total of six experiments were conducted in the
study to analyze the effects of landslide conditioning factors
on LSM. These experiments were as follows: 5 factors, 10
factors, all the 14 factors, 3 LiDAR factors, 6 LiDAR
factors, and 8 LiDAR factors. The evaluation of the six
experiments showed that the RF model with 10 landslide
factors selected from among the 14 factors produced the best
result (AUC = 0.95). In addition, a significant decrease in
130
B. Pradhan and M.I. Sameen
Fig. 6.7 ROC curves of the produced susceptibility map
Fig. 6.8 Percentages of landslide inventories in each susceptibility
zone
Table 6.4 Results of factor
subset selection of ACO-based
experiments
Dataset
All data
Only
LiDAR
Experiment
accuracy was observed when only the LiDAR-derived factors were used. Factors, such as land use, vegetation density,
and NDVI were found to be important for predicting landslides in the study area.
In this study, 4 landslide susceptibility maps were produced for the study area. The susceptibility maps produced
using only LiDAR-derived factors were different from those
produced using significant factors selected from all the 14
factors. This study showed that spatial agreement on susceptibility zones decreased by adding non-LiDAR factors in
the analysis. A visual interpretation of the susceptibility
maps indicated spatial agreements on susceptible zones in
the northern, middle, and southern parts of the study area
when LiDAR-based factors were used. Therefore, statistical
validation methods, such as ROC curves and spatial agreement analysis should be considered to decide whether a map
can be used for land use planning. In addition, Fig. 6.8
shows the percentages of landslides in each susceptibility
class. The graph shows that most of the landslides are
located in high and very high susceptibility zones.
In general, the RF model performed better than the SVM
algorithm regardless of the combination of factors used for
modeling. Although the parameters of the SVM algorithm
were fine-tuned in the current study, concluding that RF
should be used for LSM in the Cameron Highlands would be
difficult. This study suggests that significant attention should
be directed toward analyzing input landslide factors. Moreover, problematic factors and observations should be
removed. Several factors are typically derived from a
LiDAR DEM, and thus, collinearity can be found among
these factors. Therefore, additional factors, including
non-LiDAR factors, should always be used in LSM.
Sometimes, factors such as distance to the road have a strong
correlation with land use. The careful design of classification
schemes when producing land use maps is recommended.
Total number of
factors
Selected factors
AUC
SVM
RF
5-Factors
14
[7 8 6 5 9]
0.83
0.89
10-Factors
14
[2 10 4 8 3 1 12 6 14 7]
0.89
0.95
14-Factors
14
[9 10 4 3 5 12 11 1 7 8 2 6 14
13]
0.91
0.95
3-Factors
8
[3 4 2]
0.72
0.77
6-Factors
8
[6 1 5 4 8 7]
0.69
0.70
8-Factors
8
[4 5 2 8 7 6 3 1]
0.75
0.81
6
Landslide Susceptibility Modeling …
For example, roads can be classified into different classes
based on road type or width. Such classification can reduce
the correlation among landslide factors, and thus improve
LSM.
This study examined the optimization of landslide conditioning factors and conducted a factor effect analysis to
improve understanding of susceptibility models. However,
several issues should be considered in future studies. First,
the effects of landslide sampling procedures and the spatial
resolution of DEMs should be investigated in detail.
Attention should also be directed toward developing new
theoretical factors in future studies. LiDAR-derived factors
can be reduced into fewer factors, which can decrease
collinearity among factors. Quantitative accuracy indicators,
such as AUC, may be insufficient when deciding which
algorithm or LSM approach should be used. Therefore, new
indicators that consider spatial agreements on susceptible
classes should be developed. In summary, comprehensive
analysis on landslide conditioning factors should be conducted to improve understanding of LSM in the future.
References
Abe, S. (2005). Support vector machines for pattern classification (Vol.
2). London: Springer.
Breiman, L. (2001). Random forests. Machine Learning, 45(1), 5–32.
Breiman, L., Friedman, J., Stone, C. J., & Olshen, R. A. (1984).
Classification and regression trees. Boca Raton: CRC press.
Brenning, A. (2005). Spatial prediction models for landslide hazards:
review, comparison and evaluation. Natural Hazards and Earth
System Science, 5(6), 853–862.
Bui, D. T., Tuan, T. A., Klempe, H., Pradhan, B., & Revhaug, I.
(2015). Spatial prediction models for shallow landslide hazards: A
comparative assessment of the efficacy of support vector machines,
artificial neural networks, kernel logistic regression, and logistic
model tree. Landslides, 1–18.
Costello, A. B. (2009). Getting the most from your analysis. Pan, 12(2),
131–146.
Erener, A., & Düzgün, H. S. B. (2010). Improvement of statistical
landslide susceptibility mapping by using spatial and global
regression methods in the case of More and Romsdal (Norway).
Landslides, 7(1), 55–68.
Gaprindashvili, G., & Van Westen, C. J. (2016). Generation of a
national landslide hazard and risk map for the country of Georgia.
Natural Hazards, 80(1), 69–101.
Garrosa, E., Rainho, C., Moreno-Jimenez, B., & Monteiro, M.
J. (2010). The relationship be-tween job stressors, hardy personality, coping resources and burnout in a sample of nurs-es: A
correlational study at two time points. International Journal of
Nursing Studies, 47(2), 205–215.
Gottlieb, J., Puchta, M., & Solnon, C. (2003). A study of greedy, local
search, and ant colony optimization approaches for car sequencing
problems. In Applications of evolutionary computing (pp. 246–257).
Berlin Heidelberg: Springer.
131
Guo, D., & Hamada, M. (2013). Qualitative and quantitative analysis on
landslide influential factors during Wenchuan earthquake: A case
study in Wenchuan County. Engineering Geology, 152(1), 202–209.
Hansen, L. K., & Salamon, P. (1990). Neural network ensembles. IEEE
Transactions on Pattern Analysis and Machine Intelligence, 12(10),
993–1001.
Hussin, H. Y., Zumpano, V., Reichenbach, P., Sterlacchini, S., Micu,
M., van Westen, C., & Bălteanu, D. (2016). Different landslide
sampling strategies in a grid-based bi-variate statistical susceptibility model. Geomorphology, 253, 508–523.
Jebur, M. N., Pradhan, B., & Tehrany, M. S. (2014). Optimization of
landslide conditioning factors using very high-resolution airborne
laser scanning (LiDAR) data at catchment scale. Remote Sensing of
Environment, 152, 150–165.
Kasai, M., Ikeda, M., Asahina, T., & Fujisawa, K. (2009).
LiDAR-derived DEM evaluation of deep-seated landslides in a
steep and rocky region of Japan. Geomorphology, 113(1), 57–69.
Kayastha, P. (2015). Landslide susceptibility mapping and factor effect
analysis using frequency ratio in a catchment scale: A case study
from Garuwa sub-basin, East Nepal. Arabian Journal of Geosciences, 8(10), 8601–8613.
Khan, Y. A. (2010). Monitoring of hill-slope movement due to rainfall
at Gunung Pass of Cameron Highland district of Peninsular
Malaysia. International Journal of Earth Sciences and Engineering,
3, 06–12.
Mahalingam, R., & Olsen, M. J. (2015). Evaluation of the influence of
source and spatial reso-lution of DEMs on derivative products used
in landslide mapping. Geomatics, Natural Hazards and Risk, 1–21.
Mahalingam, R., Olsen, M. J., & O’Banion, M. S. (2016). Evaluation
of landslide susceptibility mapping techniques using lidar-derived
conditioning factors (Oregon case study). Geomatics, Natural
Hazards and Risk, 1–24.
Meten, M., PrakashBhandary, N., & Yatabe, R. (2015). Effect of
landslide factor combinations on the prediction accuracy of
landslide susceptibility maps in the Blue Nile Gorge of Central
Ethiopia. Geoenvironmental Disasters, 2(1), 1–17.
Micheletti, N., Foresti, L., Robert, S., Leuenberger, M., Pedrazzini, A.,
Jaboyedoff, M., & Kanevski, M. (2014). Machine learning feature
selection methods for landslide susceptibility mapping. Mathematical Geosciences, 46(1), 33–57.
Moosavi, V., & Niazi, Y. (2015). Development of hybrid wavelet
packet-statistical models (WP-SM) for landslide susceptibility
mapping. Landslides, 1–18.
Pereira, S. D. S., Zêzere, J. L. G. M. D., & Bateira, C. (2013). Technical
note: Assessing predictive capacity and conditional independence of
landslide predisposing factors for shallow landslide susceptibility
models. Natural Hazards and Earth System Sciences, n. 12 (2012),
979–988.
Pradhan, B. (2013). A comparative study on the predictive ability of the
decision tree, support vector machine and neuro-fuzzy models in
landslide susceptibility mapping using GIS. Computers and Geosciences, 51, 350–365.
Pradhan, B., & Lee, S. (2009). Landslide risk analysis using artificial
neural network model focusing on different training sites. International Journal of Physical Sciences, 3(11), 1–15.
Pradhan, B., & Lee, S. (2010). Regional landslide susceptibility
analysis using back-propagation neural network model at Cameron
Highland, Malaysia. Landslides, 7(1), 13–30.
Qin, C. Z., Bao, L. L., Zhu, A. X., Wang, R. X., & Hu, X. M. (2013).
Uncertainty due to DEM error in landslide susceptibility mapping.
International Journal of Geographical Information Science, 27(7),
1364–1380.
132
Roscoe, B. A., Hopke, P. K., Dattner, S. L., & Jenks, J. M. (1982). The
use of principal component factor analysis to interpret particulate
compositional data sets. Journal of the Air Pollution Control
Association, 32(6), 637–642.
Vasu, N. N., & Lee, S. R. (2016). A hybrid feature selection algorithm
integrating an extreme learning machine for landslide susceptibility
B. Pradhan and M.I. Sameen
modeling of Mt. Woomyeon, South Korea. Geomorphology, 263,
50–70.
Vladimir, V. N., & Vapnik, V. (1995). The nature of statistical learning
theory.
Yao, X., Tham, L. G., & Dai, F. C. (2008). Landslide susceptibility
mapping based on support vector machine: a case study on natural
slopes of Hong Kong, China. Geomorphology, 101(4), 572–582.