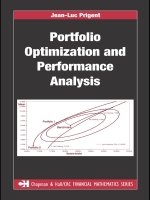
Portfolio optimization and performance analysis
Bạn đang xem bản rút gọn của tài liệu. Xem và tải ngay bản đầy đủ của tài liệu tại đây (3.9 MB, 451 trang )
CHAPMAN & HALL/CRC FINANCIAL MATHEMATICS SERIES
Portfolio
Optimization and
Performance
Analysis
CHAPMAN & HALL/CRC
Financial Mathematics Series
Aims and scope:
The field of financial mathematics forms an ever-expanding slice of the financial sector. This series
aims to capture new developments and summarize what is known over the whole spectrum of this
field. It will include a broad range of textbooks, reference works and handbooks that are meant to
appeal to both academics and practitioners. The inclusion of numerical code and concrete real-world
examples is highly encouraged.
Series Editors
M.A.H. Dempster
Centre for Financial
Research
Judge Business School
University of Cambridge
Dilip B. Madan
Robert H. Smith School
of Business
University of Maryland
Rama Cont
Center for Financial
Engineering
Columbia University
New York
Published Titles
American-Style Derivatives; Valuation and Computation, Jerome Detemple
Financial Modelling with Jump Processes, Rama Cont and Peter Tankov
An Introduction to Credit Risk Modeling, Christian Bluhm, Ludger Overbeck, and
Christoph Wagner
Portfolio Optimization and Performance Analysis, Jean-Luc Prigent
Robust Libor Modelling and Pricing of Derivative Products, John Schoenmakers
Structured Credit Portfolio Analysis, Baskets & CDOs, Christian Bluhm and
Ludger Overbeck
Proposals for the series should be submitted to one of the series editors above or directly to:
CRC Press, Taylor and Francis Group
24-25 Blades Court
Deodar Road
London SW15 2NU
UK
CHAPMAN & HALL/CRC FINANCIAL MATHEMATICS SERIES
Portfolio
Optimization and
Performance
Analysis
Jean-Luc Prigent
Boca Raton London New York
Chapman & Hall/CRC is an imprint of the
Taylor & Francis Group, an informa business
Chapman & Hall/CRC
Taylor & Francis Group
6000 Broken Sound Parkway NW, Suite 300
Boca Raton, FL 33487‑2742
© 2007 by Taylor & Francis Group, LLC
Chapman & Hall/CRC is an imprint of Taylor & Francis Group, an Informa business
No claim to original U.S. Government works
Printed in the United States of America on acid‑free paper
10 9 8 7 6 5 4 3 2 1
International Standard Book Number‑10: 1‑58488‑578‑5 (Hardcover)
International Standard Book Number‑13: 978‑1‑58488‑578‑8 (Hardcover)
This book contains information obtained from authentic and highly regarded sources. Reprinted
material is quoted with permission, and sources are indicated. A wide variety of references are
listed. Reasonable efforts have been made to publish reliable data and information, but the author
and the publisher cannot assume responsibility for the validity of all materials or for the conse‑
quences of their use.
No part of this book may be reprinted, reproduced, transmitted, or utilized in any form by any
electronic, mechanical, or other means, now known or hereafter invented, including photocopying,
microfilming, and recording, or in any information storage or retrieval system, without written
permission from the publishers.
For permission to photocopy or use material electronically from this work, please access www.
copyright.com ( or contact the Copyright Clearance Center, Inc. (CCC)
222 Rosewood Drive, Danvers, MA 01923, 978‑750‑8400. CCC is a not‑for‑profit organization that
provides licenses and registration for a variety of users. For organizations that have been granted a
photocopy license by the CCC, a separate system of payment has been arranged.
Trademark Notice: Product or corporate names may be trademarks or registered trademarks, and
are used only for identification and explanation without intent to infringe.
Library of Congress Cataloging‑in‑Publication Data
Prigent, Jean‑Luc, 1958‑
Portfolio optimization and performance analysis / Jean‑Luc Prigent.
p. cm. ‑‑ (Chapman & Hall/CRC financial mathematics series ; 7)
Includes bibliographical references and index.
ISBN‑13: 978‑1‑58488‑578‑8 (alk. paper)
ISBN‑10: 1‑58488‑578‑5 (alk. paper)
1. Portfolio management. 2. Investment analysis. 3. Hedge funds. I. Title. II.
Series.
HG4529.5.P735 2007
332.6‑‑dc22
Visit the Taylor & Francis Web site at
and the CRC Press Web site at
2006100727
Preface
Since the seminal mean-variance analysis was introduced by Markowitz (1952),
the portfolio management theory has been expanded to take account of different features:
• Dynamic portfolio optimization as per Merton (1962);
• Choice of new decision criteria, based on risk aversion (utility functions)
or risk measures (VaR, CVaR and beyond);
• Market imperfections, e.g., transaction costs; and,
• Specific portfolio strategies, such as portfolio insurance or alternative
methods (hedge-funds).
At the same time, many new financial products has been introduced, based
in particular on financial derivatives.
Due to this intensive development and increasing complexity, this book has
four purposes:
• First, to recall standard results and to provide new insights about the
axiomatics of the individual choice in an uncertain framework. A concise
introduction to portfolio choice under uncertainty based on investors’
preferences (usually represented by utility functions), and on several
kinds of risk measures. These theories are the fundamental basis of
portfolio optimization.
- Chapter 1 recalls the seminal approach of the utility maximization,
introduced by Von Neumann and Morgenstern. It also deals with
further extensions of this theory, such as weighted expected utility
theory, non-expected utility theory, etc.
- Chapter 2 contains a survey about a new approach: the risk measure
minimization. Such risk measures have been recently introduced
in particular to take better account of nonsymmetric asset return
distributions.
• Second, to provide a precise overview on standard portfolio optimization. Both passive and active portfolio management are considered.
Other results, such as risk measure minimization, are more recent.
V
VI
Portfolio Optimization and Performance Analysis
- Chapter 3 is devoted to the very well-known Markowitz analysis.
Some extensions are analyzed, in particular with risk minimization
constraints such as safety criteria.
- Chapter 4 deals with two important standard fund managements:
managing indexed funds and benchmarked portfolio optimization.
In particular, statistical methods to replicate a financial index are
detailed and discussed. As regards benchmarking, the tracking error is computed and analyzed.
- Chapter 5 recalls results about the main performance measures, such
as the Sharpe and Treynor ratios and the Jensen alpha.
• Third, to make accessible the literature about stochastic optimization
applied to mathematical finance (see for example Part III) to students,
to researchers who are not specialists on this subject, and to financial
engineers. In particular, a review of the main standard results both for
static and dynamic cases are provided. For this purpose, precise mathematical statements are detailed without “too many” technicalities. In
particular:
- Chapter 6 provides an introduction to dynamic portfolio optimization. The two main methods are the theory of stochastic control
based on dynamic programming principle and, more recently, the
martingale approach jointly used with convex duality.
- Chapter 7 gives two important applications of previous results: the
search for an optimal portfolio profile and the long-term management.
- Chapter 8 is the more “technical” one. It provides an overview on
portfolio optimization with market frictions, such as incompleteness, transaction costs, labor income, random time horizon, etc.
• Finally, to show how theoretical results can be applied to practical and
operational portfolio optimization (Part IV). This last part of the book
deals with structured portfolio management which has grown significantly in the past few years.
Preface
VII
- Chapter 9 is devoted to portfolio insurance and, in particular, to
OBPI and CPPI strategies.
- Chapter 10 shows how common strategies, used by practitioners, may
be justified by utility maximization under, for example, guarantee
constraints. It summarizes the main results concerning optimal
portfolios when risk measures such as expected shortfall are introduced to limit downside risk.
- Chapter 11 recalls some problems when dealing with hedge funds, in
particular the choice of appropriate performance measures.
As a by-product, special emphasis is put on:
• Utility theory versus practice;
• Active versus passive management; and,
• Static versus dynamic portfolio management.
I hope this book will contribute to a better understanding of the modern
portfolio theory, both for students and researchers in quantitative finance.
I am grateful to the CRC editorial staff for encouraging this project, in particular Sunil Nair, and for the help during the preparation of the final version:
Michele Dimont and Shashi Kumar.
Jean-Luc PRIGENT, PARIS, February 2007.
Contents
List of Tables
XIII
List of Figures
XV
I
Utility and risk analysis
1
1 Utility theory
1.1 Preferences under uncertainty . . . . . . . . .
1.1.1 Lotteries . . . . . . . . . . . . . . . . . .
1.1.2 Axioms on preferences . . . . . . . . . .
1.2 Expected utility . . . . . . . . . . . . . . . . .
1.3 Risk aversion . . . . . . . . . . . . . . . . . . .
1.3.1 Arrow-Pratt measures of risk aversion .
1.3.2 Standard utility functions . . . . . . . .
1.3.3 Applications to portfolio allocation . . .
1.4 Stochastic dominance . . . . . . . . . . . . . .
1.5 Alternative expected utility theory . . . . . . .
1.5.1 Weighted utility theory . . . . . . . . .
1.5.2 Rank dependent expected utility theory
1.5.3 Non-additive expected utility . . . . . .
1.5.4 Regret theory . . . . . . . . . . . . . . .
1.6 Further reading . . . . . . . . . . . . . . . . .
.
.
.
.
.
.
.
.
.
.
.
.
.
.
.
.
.
.
.
.
.
.
.
.
.
.
.
.
.
.
.
.
.
.
.
.
.
.
.
.
.
.
.
.
.
.
.
.
.
.
.
.
.
.
.
.
.
.
.
.
.
.
.
.
.
.
.
.
.
.
.
.
.
.
.
.
.
.
.
.
.
.
.
.
.
.
.
.
.
.
.
.
.
.
.
.
.
.
.
.
.
.
.
.
.
.
.
.
.
.
.
.
.
.
.
.
.
.
.
.
5
7
7
8
9
11
13
15
17
19
24
25
27
32
33
35
2 Risk measures
2.1 Coherent and convex risk measures .
2.1.1 Coherent risk measures . . . .
2.1.2 Convex risk measures . . . . .
2.1.3 Representation of risk measures
2.1.4 Risk measures and utility . . .
2.1.5 Dynamic risk measures . . . .
2.2 Standard risk measures . . . . . . . .
2.2.1 Value-at-Risk . . . . . . . . . .
2.2.2 CVaR . . . . . . . . . . . . . .
2.2.3 Spectral measures of risk . . .
2.3 Further reading . . . . . . . . . . . .
.
.
.
.
.
.
.
.
.
.
.
.
.
.
.
.
.
.
.
.
.
.
.
.
.
.
.
.
.
.
.
.
.
.
.
.
.
.
.
.
.
.
.
.
.
.
.
.
.
.
.
.
.
.
.
.
.
.
.
.
.
.
.
.
.
.
.
.
.
.
.
.
.
.
.
.
.
.
.
.
.
.
.
.
.
.
.
.
37
37
38
39
40
41
43
48
48
54
59
62
.
.
.
.
.
.
.
.
.
.
.
.
.
.
.
.
.
.
.
.
.
.
.
.
.
.
.
.
.
.
.
.
.
.
.
.
.
.
.
.
.
.
.
.
.
.
.
.
.
.
.
.
.
.
.
IX
X
II
Portfolio Optimization and Performance Analysis
Standard portfolio optimization
3 Static optimization
3.1 Mean-variance analysis . . . . . . . .
3.1.1 Diversification effect . . . . . .
3.1.2 Optimal weights . . . . . . . .
3.1.3 Additional constraints . . . . .
3.1.4 Estimation problems . . . . . .
3.2 Alternative criteria . . . . . . . . . .
3.2.1 Expected utility maximization
3.2.2 Risk measure minimization . .
3.3 Further reading . . . . . . . . . . . .
65
.
.
.
.
.
.
.
.
.
.
.
.
.
.
.
.
.
.
.
.
.
.
.
.
.
.
.
.
.
.
.
.
.
.
.
.
.
.
.
.
.
.
.
.
.
.
.
.
.
.
.
.
.
.
.
.
.
.
.
.
.
.
.
.
.
.
.
.
.
.
.
.
.
.
.
.
.
.
.
.
.
.
.
.
.
.
.
.
.
.
.
.
.
.
.
.
.
.
.
.
.
.
.
.
.
.
.
.
67
68
68
71
78
82
85
85
93
100
4 Indexed funds and benchmarking
4.1 Indexed funds . . . . . . . . . . . . . . .
4.1.1 Tracking error . . . . . . . . . . .
4.1.2 Simple index tracking methods . .
4.1.3 The threshold accepting algorithm
4.1.4 Cointegration tracking method . .
4.2 Benchmark portfolio optimization . . . .
4.2.1 Tracking-error definition . . . . . .
4.2.2 Tracking-error minimization . . . .
4.3 Further reading . . . . . . . . . . . . . .
.
.
.
.
.
.
.
.
.
.
.
.
.
.
.
.
.
.
.
.
.
.
.
.
.
.
.
.
.
.
.
.
.
.
.
.
.
.
.
.
.
.
.
.
.
.
.
.
.
.
.
.
.
.
.
.
.
.
.
.
.
.
.
.
.
.
.
.
.
.
.
.
.
.
.
.
.
.
.
.
.
.
.
.
.
.
.
.
.
.
.
.
.
.
.
.
.
.
.
103
103
104
105
106
112
117
118
119
127
5 Portfolio performance
5.1 Standard performance measures . . . . . . . . .
5.1.1 The Capital Asset Pricing Model . . . . .
5.1.2 The three standard performance measures
5.1.3 Other performance measures . . . . . . .
5.1.4 Beyond the CAPM . . . . . . . . . . . . .
5.2 Performance decomposition . . . . . . . . . . . .
5.2.1 The Fama decomposition . . . . . . . . .
5.2.2 Other performance attributions . . . . . .
5.2.3 The external attribution . . . . . . . . . .
5.2.4 The internal attribution . . . . . . . . . .
5.3 Further Reading . . . . . . . . . . . . . . . . . .
.
.
.
.
.
.
.
.
.
.
.
.
.
.
.
.
.
.
.
.
.
.
.
.
.
.
.
.
.
.
.
.
.
.
.
.
.
.
.
.
.
.
.
.
.
.
.
.
.
.
.
.
.
.
.
.
.
.
.
.
.
.
.
.
.
.
.
.
.
.
.
.
.
.
.
.
.
129
130
130
132
140
145
151
151
153
153
155
163
III
.
.
.
.
.
.
.
.
.
Dynamic portfolio optimization
6 Dynamic programming optimization
6.1 Control theory . . . . . . . . . . . . . . .
6.1.1 Calculus of variations . . . . . . .
6.1.2 Pontryagin and Bellman principles
6.1.3 Stochastic optimal control . . . . .
6.2 Lifetime portfolio selection . . . . . . . .
165
.
.
.
.
.
.
.
.
.
.
.
.
.
.
.
.
.
.
.
.
.
.
.
.
.
.
.
.
.
.
.
.
.
.
.
.
.
.
.
.
.
.
.
.
.
.
.
.
.
.
.
.
.
.
.
169
169
169
175
182
187
Contents
6.3
6.2.1 The optimization problem . . . . . .
6.2.2 The deterministic coefficients case .
6.2.3 The general case . . . . . . . . . . .
6.2.4 Recursive utility in continuous-time
Further reading . . . . . . . . . . . . . . .
XI
.
.
.
.
.
.
.
.
.
.
.
.
.
.
.
.
.
.
.
.
.
.
.
.
.
.
.
.
.
.
.
.
.
.
.
.
.
.
.
.
.
.
.
.
.
.
.
.
.
.
187
188
195
203
205
7 Optimal payoff profiles and long-term management
7.1 Optimal payoffs as functions of a benchmark . . . . .
7.1.1 Linear versus option-based strategy . . . . . .
7.2 Application to long-term management . . . . . . . . .
7.2.1 Assets dynamics and optimal portfolios . . . .
7.2.2 Exponential utility . . . . . . . . . . . . . . . .
7.2.3 Sensitivity analysis . . . . . . . . . . . . . . . .
7.2.4 Distribution of the optimal portfolio return . .
7.3 Further reading . . . . . . . . . . . . . . . . . . . . .
.
.
.
.
.
.
.
.
.
.
.
.
.
.
.
.
.
.
.
.
.
.
.
.
.
.
.
.
.
.
.
.
207
207
207
214
214
220
223
225
226
8 Optimization within specific markets
8.1 Optimization in incomplete markets . . . . . . . . . .
8.1.1 General result based on martingale method . .
8.1.2 Dynamic programming and viscosity solutions
8.2 Optimization with constraints . . . . . . . . . . . . .
8.2.1 General result . . . . . . . . . . . . . . . . . . .
8.2.2 Basic examples . . . . . . . . . . . . . . . . . .
8.3 Optimization with transaction costs . . . . . . . . . .
8.3.1 The infinite-horizon case . . . . . . . . . . . . .
8.3.2 The finite-horizon case . . . . . . . . . . . . . .
8.4 Other frameworks . . . . . . . . . . . . . . . . . . . .
8.4.1 Labor income . . . . . . . . . . . . . . . . . . .
8.4.2 Stochastic horizon . . . . . . . . . . . . . . . .
8.5 Further reading . . . . . . . . . . . . . . . . . . . . .
.
.
.
.
.
.
.
.
.
.
.
.
.
.
.
.
.
.
.
.
.
.
.
.
.
.
.
.
.
.
.
.
.
.
.
.
.
.
.
.
.
.
.
.
.
.
.
.
.
.
.
.
229
230
230
238
242
242
249
256
256
260
263
263
272
276
IV
Structured portfolio management
9 Portfolio insurance
9.1 The Option Based Portfolio Insurance . . . . . .
9.1.1 The standard OBPI method . . . . . . . .
9.1.2 Extensions of the OBPI method . . . . .
9.2 The Constant Proportion Portfolio Insurance . .
9.2.1 The standard CPPI method . . . . . . . .
9.2.2 CPPI extensions . . . . . . . . . . . . . .
9.3 Comparison between OBPI and CPPI . . . . . .
9.3.1 Comparison at maturity . . . . . . . . . .
9.3.2 The dynamic behavior of OBPI and CPPI
9.4 Further reading . . . . . . . . . . . . . . . . . .
279
.
.
.
.
.
.
.
.
.
.
.
.
.
.
.
.
.
.
.
.
.
.
.
.
.
.
.
.
.
.
.
.
.
.
.
.
.
.
.
.
.
.
.
.
.
.
.
.
.
.
.
.
.
.
.
.
.
.
.
.
.
.
.
.
.
.
.
.
.
.
281
282
284
286
294
295
303
305
305
310
318
XII
Portfolio Optimization and Performance Analysis
10 Optimal dynamic portfolio with risk limits
10.1 Optimal insured portfolio: discrete-time case . . . . . . . . .
10.1.1 Optimal insured portfolio with a fixed number of assets
10.1.2 Optimal insured payoffs as functions of a benchmark .
10.2 Optimal Insured Portfolio: the dynamically complete case . .
10.2.1 Guarantee at maturity . . . . . . . . . . . . . . . . . .
10.2.2 Risk exposure and utility function . . . . . . . . . . .
10.2.3 Optimal portfolio with controlled drawdowns . . . . .
10.3 Value-at-Risk and expected shortfall based management . . .
10.3.1 Dynamic safety criteria . . . . . . . . . . . . . . . . .
10.3.2 Expected utility under VaR/CVaR constraints . . . .
10.4 Further reading . . . . . . . . . . . . . . . . . . . . . . . . .
319
321
321
326
333
333
335
337
340
340
347
350
11 Hedge funds
11.1 The hedge funds industry . . . . . . . . . . . .
11.1.1 Introduction . . . . . . . . . . . . . . .
11.1.2 Main strategies . . . . . . . . . . . . . .
11.2 Hedge fund performance . . . . . . . . . . . .
11.2.1 Return distributions . . . . . . . . . . .
11.2.2 Sharpe ratio limits . . . . . . . . . . . .
11.2.3 Alternative performance measures . . .
11.2.4 Benchmarks for alternative investment .
11.2.5 Measure of the performance persistence
11.3 Optimal allocation in hedge funds . . . . . . .
11.4 Further reading . . . . . . . . . . . . . . . . .
351
351
351
352
354
354
355
362
368
369
370
371
.
.
.
.
.
.
.
.
.
.
.
.
.
.
.
.
.
.
.
.
.
.
.
.
.
.
.
.
.
.
.
.
.
.
.
.
.
.
.
.
.
.
.
.
.
.
.
.
.
.
.
.
.
.
.
.
.
.
.
.
.
.
.
.
.
.
.
.
.
.
.
.
.
.
.
.
.
.
.
.
.
.
.
.
.
.
.
.
A Appendix A: Arch Models
373
B Appendix B: Stochastic Processes
381
References
397
Symbol Description
431
Index
433
List of Tables
1.1
1.2
Kahnemann and Tversky example . . . . . . . . . . . . . . .
Equivalence of the two problems . . . . . . . . . . . . . . . .
25
25
3.1
Expectations, variances and covariances . . . . . . . . . . . .
80
4.1
MADD minimization and weighting differences . . . . . . . .
111
5.1
5.2
5.3
5.4
5.5
5.6
5.7
5.8
5.9
Asymptotic standard deviation of the Sharpe ratio estimator
Asset allocation (percentages) . . . . . . . . . . . . . . . . . .
Contribution to asset classes . . . . . . . . . . . . . . . . . . .
Asset selection effects . . . . . . . . . . . . . . . . . . . . . .
Portfolio characteristics . . . . . . . . . . . . . . . . . . . . .
Performance attribution . . . . . . . . . . . . . . . . . . . . .
Performance attribution of portfolio 1 . . . . . . . . . . . . .
Tracking-error volatilities . . . . . . . . . . . . . . . . . . . .
Information ratios . . . . . . . . . . . . . . . . . . . . . . . .
140
156
157
157
158
158
160
162
162
7.1
7.2
7.3
7.4
7.5
7.6
Optimal weights for logarithmic utility function . . . . . . . .
Optimal weights for CRRA utility function . . . . . . . . . .
Optimal weights for HARA utility function . . . . . . . . . .
Optimal weights for CARA utility function . . . . . . . . . .
Asset allocation sensitivities for CRRA utility . . . . . . . . .
Asset allocations for agressive, moderate and conservative investors (CRRA utility function) . . . . . . . . . . . . . . . . .
218
219
220
222
223
9.1
9.2
9.3
9.4
OBPI and Call-power moments . . . . . . . . . . . . . . .
Comparison of the first four moments and semi-volatility .
Probability P [∆OBP I > ∆CP P I ] for different m and σ . .
Probability P [∆OBP I > ∆CP P I ] for different m and µ . .
.
.
.
.
.
.
.
.
288
307
313
313
11.1
11.2
11.3
11.4
HFR and CSFB classifications . . . . . . . . .
Characteristics of the portfolio S − (S − K)+
Characteristics of the portfolio S + (H − S)+
The four hedge funds characteristics . . . . .
.
.
.
.
.
.
.
.
352
357
358
365
.
.
.
.
.
.
.
.
.
.
.
.
.
.
.
.
.
.
.
.
.
.
.
.
.
.
.
.
224
XIII
List of Figures
1.1
1.2
1.3
Risk aversion, certainty equivalence, and concavity . . . . . .
Stochastic dominance . . . . . . . . . . . . . . . . . . . . . .
Kahneman and Tversky functions . . . . . . . . . . . . . . . .
11
20
31
2.1
2.2
Pdf and cdf with VaR . . . . . . . . . . . . . . . . . . . . . .
Gaussian and Stable Paretian distributions with same VaR .
50
51
3.1
3.2
3.3
3.4
3.5
3.6
3.7
3.8
3.9
3.10
3.11
Diversification effect . . . . . . . . . . . . . . . . . . .
Mean-variance portfolios . . . . . . . . . . . . . . . . .
A
Efficient frontiers (Rf < C
) . . . . . . . . . . . . . . .
A
) . . . . . . . . . . . . . . .
Efficient frontiers (Rf > C
A
Efficient frontiers (Rf = C ) . . . . . . . . . . . . . . .
Efficient frontier with no shortselling . . . . . . . . . .
Efficient frontier with additional group constraints . .
Efficient frontier with maximum number of constraints
Roy’s portfolio . . . . . . . . . . . . . . . . . . . . . .
Telser’s portfolio . . . . . . . . . . . . . . . . . . . . .
Kataoka’s portfolio . . . . . . . . . . . . . . . . . . . .
.
.
.
.
.
.
.
.
.
.
.
.
.
.
.
.
.
.
.
.
.
.
.
.
.
.
.
.
.
.
.
.
.
.
.
.
.
.
.
.
.
.
.
.
68
74
77
77
78
81
81
81
94
96
97
4.1
4.2
4.3
4.4
4.5
4.6
4.7
4.8
MADD minimization with ten stocks . . .
MADD minimization: estimation and test
MADD minimization with constraints . .
Efficient and relative frontiers, RB > R0 .
Efficient and relative frontiers, RB < R0 . .
Efficient, relative and beta frontiers . . . .
Efficient, relative and Φ frontiers . . . . .
Frontiers and iso-tracking curves . . . . .
.
.
.
.
.
.
.
.
.
.
.
.
.
.
.
.
.
.
.
.
.
.
.
.
.
.
.
.
.
.
.
.
110
110
111
121
122
124
125
127
5.1
5.2
5.3
5.4
5.5
5.6
5.7
5.8
Security market line . . . . . . . . . . . . . . . . . . . . . . .
SML and portfolios A, B, A’, and B’ . . . . . . . . . . . . . .
Capital market line . . . . . . . . . . . . . . . . . . . . . . . .
Capital market line and leverage effect . . . . . . . . . . . . .
FAMA performance decomposition . . . . . . . . . . . . . . .
Linear regression of RP on RM without market timing . . . .
Linear regression of RP on RM with successful market timing
Efficient and relative frontiers . . . . . . . . . . . . . . . . . .
131
136
136
137
152
153
154
159
7.1
Optimal portfolio profiles . . . . . . . . . . . . . . . . . . . .
212
.
.
.
.
.
.
.
.
.
.
.
.
.
.
.
.
.
.
.
.
.
.
.
.
.
.
.
.
.
.
.
.
.
.
.
.
.
.
.
.
.
.
.
.
.
.
.
.
.
.
.
.
.
.
.
.
XV
XVI
Portfolio Optimization and Performance Analysis
7.2
7.3
Optimal portfolio profiles according to stock return . . . . . .
Inverse cumulative distribution of the return at maturity . . .
213
226
8.1
8.2
Solvency region . . . . . . . . . . . . . . . . . . . . . . . . . .
Optimal consumption as function of optimal wealth . . . . .
258
272
9.1
9.2
9.3
9.4
9.5
9.6
9.7
9.8
9.9
9.10
9.11
9.12
9.13
9.14
9.15
9.16
9.17
9.18
9.19
OBPI portfolio value as function of S . . . . . . . . .
Call-power option profiles . . . . . . . . . . . . . . . .
Call-power option paths . . . . . . . . . . . . . . . . .
Call-power option pdf . . . . . . . . . . . . . . . . . .
Call-power option cdf . . . . . . . . . . . . . . . . . .
Convex case with linear constraints . . . . . . . . . . .
Concave case with linear constraints . . . . . . . . . .
Portfolio value and cushion . . . . . . . . . . . . . . .
CPPI and OBPI payoffs as functions of S . . . . . . .
CPPI and OBPI payoffs and probability of S . . . . .
Cumulative distribution of OBPI/CPPI ratio . . . . .
Multiple OBPI as function of S . . . . . . . . . . . . .
OBPI multiple cumulative distribution . . . . . . . . .
CPPI and OBPI delta as functions of S . . . . . . . .
Cumulative distribution of OBPI/CPPI delta ratio . .
CPPI and OBPI delta as functions of current time . .
CPPI and OBPI gamma as functions of S for K = 100
CPPI and OBPI gamma as functions of S for K = 110
CPPI and OBPI vega as functions of S . . . . . . . .
.
.
.
.
.
.
.
.
.
.
.
.
.
.
.
.
.
.
.
.
.
.
.
.
.
.
.
.
.
.
.
.
.
.
.
.
.
.
.
.
.
.
.
.
.
.
.
.
.
.
.
.
.
.
.
.
.
.
.
.
.
.
.
.
.
.
.
.
.
.
.
.
.
.
.
.
286
287
288
289
289
292
292
294
305
308
308
311
311
312
314
314
315
316
317
10.1
10.2
10.3
10.4
10.5
10.6
10.7
10.8
Optimal portfolio profile (1) . . . . . . . . . . . . . . . .
Optimal portfolio profile (2) . . . . . . . . . . . . . . . .
Optimal portfolio profile (3) . . . . . . . . . . . . . . . .
Optimal portfolio profile (quadratic case) . . . . . . . .
Optimal portfolio weighting (quadratic case) . . . . . .
Dynamic Roy portfolio payoff . . . . . . . . . . . . . . .
Probability of success as function of the minimal return
Optimal portfolio value with VaR constraints . . . . . .
.
.
.
.
.
.
.
.
.
.
.
.
.
.
.
.
.
.
.
.
.
.
.
.
322
322
323
325
325
345
345
348
11.1
11.2
11.3
11.4
11.5
11.6
11.7
11.8
The hedge funds development . . . . . . . . .
Portfolio profile (S − (S − K)+ ) as a function
Portfolio profile (S + (H − S)+ ) . . . . . . .
Sharpe ratio as a function of the strike K . .
Portfolio profile maximizing the Sharpe ratio
The monthly returns of the four hedge funds
Omega ratio as function of the threshold . . .
Correlation of hedge funds/standard funds . .
.
S.
.
.
.
.
.
.
351
356
358
360
361
366
366
370
. . . . . . . .
of stock value
. . . . . . . .
. . . . . . . .
. . . . . . . .
. . . . . . . .
. . . . . . . .
. . . . . . . .
A.1 Random walk . . . . . . . . . . . . . . . . . . . . . . . . . . .
374
Part I
Utility and risk analysis
“[Under uncertainty] there is no scientific basis on which to form any calculable probability whatever. We simply do not know. Nevertheless, the
necessity for action and for decision compels us as practical men to do our
best to overlook this awkward fact and to behave exactly as we should if
we had behind us a good Benthamite calculation of a series of prospective
advantages and disadvantages, each multiplied by its appropriate probability
waiting to be summed.”
John Maynard Keynes, “General Theory of Employment,” Quarterly Journal
of Economics, (1937).
1
2
Portfolio Optimization and Performance Analysis
Nowadays, financial theory is one of the major economic fields where decisionmaking under uncertainty plays a crucial part. Actually, many sources of risk
(market, model, liquidity, operational, etc.) have to be taken into account and
carefully examined for most financial activities, such as pricing and hedging
derivatives, asset allocation, or credit portfolio management.
Assume that these risky events are identified with, for example, probability
distributions that may be objective or subjective. Nevertheless:
How can we model individual decisions under uncertainty?
Is it possible to rationalize traders or portfolio managers strategies? Can
we provide them with sufficiently operational and computational tools to try
to improve their decision process?
As it is well-known, a unified framework can be proposed to quantify uncertainty in financial modelling: the utility theory, and especially the expected
utility theory introduced by John von Neumann and Oskar Morgenstern in
[400] and recognized for its usefulness and applicability.
Utility functions are based on risk aversion modelling from which the notion
of risk premium can be defined. In Chapter 1, basic notions of the theory of
decision under uncertainty are recalled. The emphasis is put on the expected
utility theory and various risk aversion notions. One of the advantages of the
expected utility is that it provides an operational tool to determine explicit
portfolios under mild assumptions. In this framework, the risk-aversion allows
a calibration of the portfolio weights, as detailed in Part III.
Nevertheless, the increasing development of the so-called behavorial economics and finance, based on empirical evidence, justifies sections devoted
to alternative preference representation theories. Indeed, many experimental
studies have shown that individuals (in particular the investors) do not act
according to the expected utility theory. This can partly explain investment
anomalies such as insufficient diversification, financial bubbles, etc.
However a new stream has emerged based on bank activity regulation. It
focuses in particular on potential losses and downside risk.
In [373] and [374], Markowitz proposed to measure risk of portfolio returns
by means of their variances which involve judiciously the joint distribution
of returns of all assets. Despite its simplicity and tractability, the Markowitz
model has two pitfalls:
• First, the probability distribution of each asset return is characterized
only by its first two moments. In the case of nonGaussian distributions
Part I
3
(even symmetrical), the Markowitz model and utility theories are mainly
compatible for quadratic utility functions.
• Second, the dependence structure is only described by the linear correlation coefficients of each pair of asset returns. As shown, for example,
by Alexander [14], the linear correlation coefficient is not always applicable. It also may imply incorrect results when probability distributions
are not elliptic (see Joe [307]), as proved for instance by Embrechts et al.
([201] and [202]). In that case, severe losses can be observed if extreme
events are too underestimated.
What kind of risk measures can be introduced?
Unlike dispersion risk measures such as the standard deviation, other measures have been proposed, based rather on downside risks.
From the seminal paper by Artzner, Delbaen, Eber and Heath [31], specific
axioms have been introduced to model risk measures (coherent), and further
examined and generalized by Făollmer and Schied [236] (convex measures).
Chapter 2 is devoted to the definitions and main properties of such risk
measures. Note that, as for preference representation, the theory of risk measures is not yet achieved, in particular when they have to be defined in a
dynamic framework. Besides, both approaches are linked, as shown by recent
results. Among the possible operational risk measures, the value-at-risk and
its “coherent” extension, the expected shortfall, have emerged as important
tools to bank regulation and risk management.
This is the reason why in Chapter (2), some emphasis is put on these
measures, in particular on some results about their estimation and sensitivities computation. Under some additional and “rational” specific axioms, risk
measures can be defined from the expected shortfall (the so-called spectral
risk measures).
Portfolio management can also involve such measures to limit risk exposure,
as detailed for instance in Part IV, Chapter 10.