Flow Measurement
Bạn đang xem bản rút gọn của tài liệu. Xem và tải ngay bản đầy đủ của tài liệu tại đây (2.12 MB, 22 trang )
Flow Measurement
2
2.1
APPLICATION AND SELECTION
156
Getting Oriented 156
Special Requirements 157
Differential Pressure 157
Reynolds Number 160
Energy Costs 161
Example 161
Orifice Plates 164
Venturi Tubes and Nozzles 164
Sonic Venturi Meters 166
Pitot Tubes 166
Elbow Taps 166
Target (or Impact) Meters 167
Electromagnetic Meters 167
Turbine Meters 167
Vortex Meters 167
Variable-Area Meters 167
Positive-Displacement Meters 168
Ultrasonic Meters 168
Metering Pumps 168
Mass Flowmeters 168
Low-Flow Applications 169
Specifying the Key Requirements 169
Inaccuracy 169
Safety 170
Installation 171
Cost 171
References 171
Bibliography 172
2.2
ANEMOMETERS
173
Mechanical Anemometers 174
Thermal Anemometers 175
Doppler Anemometers 175
Conclusion 176
Bibliography 176
2.3
BTU FLOWMETERS FOR HEAT EXCHANGERS
177
Mechanical BTU Meters 178
Electronic BTU Meters 179
Reference 179
Bibliography 179
2.4
BTU FLOWMETERS FOR GASEOUS FUELS
Measuring Heat Flow by Wobble Index
The BTU Flowmeter Loop 181
Applications 181
Conclusion 182
Bibliography 182
2.5
CROSS-CORRELATION FLOW METERING
180
180
183
Nuclear Power Plant Applications 184
Determining the Transit Time 184
151
© 2003 by Béla Lipták
152
Flow Measurement
Reliability and Accuracy 185
Nuclear Power Applications 185
The TTFM System 186
References 188
Bibliography 188
2.6
ELBOW TAPS
DC Magnetic Flowmeters 213
Dual-Frequency Excitation 214
Other Types 215
Construction of Magnetic Flowmeters 215
Ceramic Liners 217
Probe-Type Units 217
Applications of Magnetic Flowmeters 218
Accuracy and Calibration 220
Errors in Magnetic Flowmeters 220
Effects of Electrical Conductivity of Fluid 221
Installation 222
Signal Considerations and Demodulation
Techniques 223
Bibliography 224
189
A Simple Flowmeter 189
Location and Size of Taps 189
Units 191
Other d/p-Producing Elements 192
References 192
Bibliography 192
2.7
FLOW SWITCHES
2.11
MASS FLOWMETERS, CORIOLIS
193
Design Variations 195
Solids Flow Switches 197
Bibliography 197
2.8
JET DEFLECTION FLOW DETECTORS
198
Operating Principle 198
Hot-Tapping 199
Conclusion 200
Bibliography 200
Other Sources 200
2.9
LAMINAR FLOWMETERS
201
Theory 201
Hagen–Poiseuille Law 202
Design Parameters 203
Design Calculations for Liquid Service
Error Sources 204
Range Extension Techniques 205
Commercially Available Units 206
Conclusion 206
References 206
Bibliography 206
2.10
MAGNETIC FLOWMETERS
208
Theory 210
Advantages 211
Limitations 211
Types of Magnetic Flowmeters 212
AC Magnetic Flowmeters 213
© 2003 by Béla Lipták
203
225
Measuring Principle and Theory 226
Principle 226
Theory 227
Design of CMF 228
Balancing Systems for CMF 229
Dual-Tube Meters 229
Single-Tube Meters 229
Tube Geometries 229
Sensors 230
Temperature Sensors 230
Security 231
Electronics 231
Signal Processing 231
Communication/Output 231
Technical Data 231
Measuring Accuracy/Range 231
Pressure Drop 231
Influences on the CMF Reading 232
Temperature 232
In-Line Pressure 232
Mounting 232
Vibration 232
Humidity 232
Fluid Velocity 233
Gas Measurements 233
Two-Component Flow 233
Corrosion, Erosion 233
Reynolds Number 233
Installation 233
Mechanical Installation 233
Zero-Point Adjustment
(Static/Dynamic) 234
Applications 234
Advantages of CMFS 235
Limitations of CMFs 235
References 235
Bibliography 235
Contents of Chapter 2
2.12
MASS FLOWMETERS—MISCELLANEOUS
237
Radiation-Type Mass Flowmeters 238
Angular Momentum-Type Mass Flowmeters 238
Impeller-Turbine Flowmeter 239
Constant Torque-Hysteresis Clutch 239
Twin-Turbine Flowmeter 239
Coriolis 240
Gyroscopic 240
Linear Mass Flowmeters 240
Indirect Mass Flowmeters 241
Calculating the Mass Flow of Steam 241
Steam Density and Accounting 241
Example 241
Conclusion 241
Reference 242
Bibliography 242
2.13
MASS FLOWMETERS—THERMAL
244
Heat Transfer Flowmeters 245
Bypass-Type Designs 247
Hot-Wire Probes 248
Calibrating Thermal Mass Flow Devices
Gas Flowmeter Calibrations 249
Liquid Calibrations 249
References 250
Bibliography 250
2.14
METERING PUMPS
249
251
Peristaltic Pumps 252
Piston Pumps 253
Diaphragm Pumps 254
Hydraulic-Actuated Metering Pumps 255
Solenoid-Driven Metering Pumps 256
Pulsator-Head Pumps 256
Proportioning Pumps 257
Controllers 257
Pulse-Input Type 257
Analog-Input Type 257
Start/Stop Type 257
Conclusions 257
Reference 258
Bibliography 258
2.15
ORIFICES
259
Head-Type Flowmeters 260
Theory of Head Meters 260
Head Meter Characteristics 261
The Square Root Relationship 261
Density of the Flowing Fluid 261
β (Beta) Ratio 261
© 2003 by Béla Lipták
Reynolds Number 262
Compressible Fluid Flow 262
Choice of Differential-Pressure Range 262
Pulsating Flow and Flow “Noise” 263
Pulsating Flow 263
Flow “Noise” 263
The Orifice Meter 263
Flow through the Orifice Plate 264
Location of Pressure Taps 264
Eccentric and Segmental Orifice Plates 265
Quadrant Edge and Conical Entrance
Orifice Plates 266
The Integral Orifice 267
Installation 268
Limitations 269
Orifice Bore Calculations 271
The Old Approach 271
Orifice Accuracy 275
References 275
Bibliography 276
2.16
PITOT TUBES AND AREA AVERAGING UNITS
Theory of Operation 278
Pressure Differential Produced 279
Static Pressure Measurement 279
Single-Ported Pitot Tube 280
Calibration of Pitot Tubes 282
Multiple-Opening Pitot Tubes 282
Area-Averaging Pitot Stations 283
Special Pitot Tubes For Pulsating Flow
References 286
Bibliography 286
277
285
2.17
POLYPHASE (OIL/WATER/GAS) FLOWMETERS
287
Wet-Gas Metering 288
Venturi Meters 288
Algorithms for Wet-Gas Measurement 288
Theory of Operation of Wet-Gas Metering 288
de Leeuw Wet-Gas Venturi Correlation 289
Liquid Mass Flow Rate Correction
Algorithm 289
Liquid Density Calculation Algorithm 290
Upstream Temperature Correction
and Pressure Recovery 290
Gas Mass Fraction Estimation Using Tracer
Techniques 290
Solartron-ISA Dualstream II™ Theory 290
Multiphase Flowmeters 291
References 293
Bibliography 293
153
154
Flow Measurement
2.18
POSITIVE-DISPLACEMENT GAS FLOWMETERS
The Diaphragm Meter 295
Rotary Meters 295
The Lobed Impeller 296
Sliding-Vane Meters 296
Rotating-Vane Meters 296
High-Precision Gas Flowmeter 296
Application Notes 296
Testing and Calibration 297
Advantages 297
Bibliography 297
2.19
POSITIVE-DISPLACEMENT LIQUID METERS
AND PROVERS 299
Overview 300
Rotating Lobe and Impeller (Type A) 300
Nutating Disk (Type B) 301
Oval-Gear Flowmeters (Type C) 301
Piston Designs (Type D) 302
Reciprocating Piston 302
Oscillating Piston 302
Rotating Vane (Type E) 303
Viscous Helix (Type F) 303
High-Precision and Specialized (Type G) 304
Provers (Type H) 304
Accessories and Intelligent Electronics 305
Bibliography 305
2.20
PURGE FLOW REGULATORS
Detection of Low Flows
Purge Rotameters 308
Bibliography 309
307
307
2.21
SEGMENTAL WEDGE FLOWMETER
310
References 312
Bibliography 312
2.22
SIGHT FLOW INDICATORS
2.24
TARGET METERS
2.23
SOLIDS FLOWMETERS AND FEEDERS
Solids Handling Equipment 319
Hoppers and Accessories 319
335
Drag-Body Design 336
Bibliography 336
313
Design Variations 313
Dual-Window and Full-View Designs
Conclusion 317
Bibliography 317
© 2003 by Béla Lipták
294
Material Characteristics 320
Taking Samples 320
Feeder Designs 321
Vertical-Gate 321
Rotary-Vane 321
Screw Feeders 321
Vibratory Feeders 322
Shaker Feeders 322
Roll Feeder 322
Revolving-Plate Feeders 323
Gravimetric Feeders 323
Early Belt Feeder Designs 323
Feed Rate Control 324
Belt Load Control of Constant-Speed
Belts 324
Belt Speeds and Blending 325
Belt Speed Selection Guidelines 325
Varying the Belt Speed 325
Limitations of Belt Speed Control 325
Precision of Weighing 326
Nuclear Belt Loading Detectors 326
Digital Control 326
Batch vs. Continuous Charging 327
Vertical Gravimetric Feeders 327
Loss-in-Weight Flowmeters 328
Continuous Operation 328
Equipment 328
System Sizing 329
Conclusion 329
Dual-Chamber Gravimetric Feeder 329
Dynamic Solids Flowmeters 330
Impulse-Type Solids Flowmeter 330
Accelerator-Type Flowmeter 330
Volumetric Flowmeters 331
Cross-Correlation Solids Flowmetering 331
Solids Flow Switches 332
Mass Flow Measurement of Pulverized Coal 332
Detecting Mass Concentration 332
Measuring the Coal Velocity 333
Bibliography 333
316
318
2.25
TURBINE AND OTHER ROTARY ELEMENT
FLOWMETERS 337
Liquid Turbine Meters 339
Electronic Display Units 340
Linearity and Repeatability 340
Viscosity and Density Effects 340
Meter Sizing 341
Contents of Chapter 2
Pelton Wheel Meters 342
Meter Characteristics and Features 343
Mechanical Installation 344
Electrical Installation 344
Gas Turbine Meters 345
Twin-Rotor Turbine Meters 346
History 346
Twin-Rotor Design 346
Applications and Features 347
Dual-Turbine Designs 348
Dual Turbines Rotating in the Same
Direction 348
Operation 348
Dual Turbine with Counter-Opposed
Rotation 348
Comparing the Three Two-Turbine Designs
Impeller and Shunt Flowmeters 350
Insertion-Type Flowmeters 350
Optical Flow Sensors 351
Paddlewheel Flowmeters 352
Bibliography 352
2.26
ULTRASONIC FLOWMETERS
353
Transit-Time Flowmeters 355
Frequency-Difference Type 355
Flowmeter Construction 355
Application and Performance 356
Doppler Flowmeters 357
Application and Performance 358
Displays, Receivers, and Intelligent Units 358
Advantages of Ultrasonic Flowmeters 359
Recent Developments 360
References 360
Bibliography 360
2.27
VARIABLE-AREA, GAP, AND VANE
FLOWMETERS 362
Rotameters 363
Sizing 365
Liquids 365
Gases or Vapors 365
Rotameter Characteristics 365
Rotameter Types 367
Bypass and Pitot Rotameters 367
Tapered Plug and Piston Meters 368
Gates and Vanes 369
Bibliography 370
© 2003 by Béla Lipták
2.28
V-CONE FLOWMETER
371
Theory of Operation 371
Operating Features 372
Bibliography 373
2.29
VENTURI TUBES, FLOW TUBES, AND FLOW
NOZZLES 374
350
The Classic Venturi 375
Short-Form Venturies 375
Installation 377
Flow Calculations 377
Flow Tubes 378
Flow Nozzles 379
Application Considerations 380
Critical-Velocity Venturi Nozzles 380
Accuracy 381
Differential Pressure Measurement 381
Conclusion 381
Reference 383
Bibliography 383
2.30
VORTEX AND FLUIDIC FLOWMETERS
384
The Vortex Shedding Phenomenon 385
The Detector 386
Features 388
Selection and Sizing 388
Installation Requirements 390
Vortex-Precession (Swirl) Meters 392
Fluidic (Coanda Effect) Meters 393
Characteristics 393
Conclusion 393
Bibliography 394
2.31
WEIRS AND FLUMES
395
Weirs 396
The Parshall Flume 397
The Palmer Bowlus Flume 398
The Kennison Nozzle, Parabolic Flume,
and Leopold Lagco Flume 399
Detectors for Open-Channel Sensors 399
References 400
Bibliography 400
155
2.1
Application and Selection
D. J. LOMAS
(1982)
B. G. LIPTÁK
(1995, 2003)
No industrial measurement is more important than the accurate detection of the flow rates of gases, liquids, and solids.
In this section, an overview is given of the availability and
characteristics of some of the most widely used flow sensors.
In addition, emphasis is given to the latest developments,
such as the polyphase (oil/water/gas) and the wide-rangeability dual-rotor turbine flowmeters. General guidelines are provided about selecting the best flow sensor for a particular
application.
GETTING ORIENTED
Table 2.1a provides information on conversion factors among
flow measurement units, whereas Table 2.1b summarizes the
features and capabilities of more than 20 flow sensor families.
The variety of choices that an application engineer faces is even
greater, because nearly every flowmeter category can be further subdivided into a variety of distinctly different subcategories. For example, the positive-displacement type of flow
sensors include rotary piston, oval gear, sliding vane, and reciprocating piston designs. If these subvariants are also counted,
the number of flow sensors available for consideration is even
higher.
The selection process should consist of at least two steps.
First, identify the meters that are technically capable of performing the required measurement and are available in the
required size and materials of construction. Once such a list
has been developed, proceed to consider cost, delivery, performance, and other factors to arrive at the best selection.
When considering a particular application, we might use
a yellow marker on a copy of Table 2.1b to highlight the
nature of the process fluid, the purpose of the measurement,
and the displays or transmission signals required. By this
process, we are likely to eliminate from consideration about
half of the flow sensors listed in the table.
After this first pass, concentrate on the performance
requirements, such as the maximum error that can be tolerated (defined either as a percentage of actual reading or full
scale) and the required metering range. Based on the error
limits and range requirements, we can next determine the
rangeability required for the particular application (the ratio
of maximum and minimum flow limits within which the
156
© 2003 by Béla Lipták
TABLE 2.1a
Conversion of Volume or Flow Units
To Convert
Into
Multiply by
cubic feet
bushels (dry)
0.8036
cubic feet
cu. cm
28,320.0
cubic feet
cu. in.
1,728.0
cubic feet
cu. meters
0.02832
cubic feet
cu. yards
0.03704
cubic feet
gallons (U.S. liq.)
7.48052
cubic feet
liters
28.32
cubic feet
pints (U.S. liq.)
59.84
cubic feet
quarts (U.S. liq.)
29.92
cubic feet/min
cu. cm/sec
472.0
cubic feet/min
gallons/sec
0.1247
cubic feet/min
liters/sec
0.4720
cubic feet/min
pounds of water/min
62.43
cubic feet/sec
million gals/day
0.646317
cubic feet/sec
gallons/min
448.831
cubic meters
cu. Ft
35.31
cubic meters
cu. in.
61,023.0
cubic meters
cu. yards
1.308
cubic meters
gallons (U.S. liq.)
264.2
cubic meters
liters
1,000.0
cubic meters
pints (U.S. liq.)
2,113.0
cubic meters
quarts (U.S. liq.)
1,057.0
gallons
cu. cm
3,785.0
gallons
cu. ft
0.1337
gallons
cu. in.
231.0
gallons
cu. meters
3.785 × 10
−3
gallons
cu. yards
4.951 × 10
−3
gallons
liters
3.785
gallons (liq. Br. Imp.)
gallons (U.S. liq.)
1.20095
gallons (U.S.)
gallons (Imp.)
0.83267
gallons of water
pounds of water
8.3453
gallons/min
cu. ft/sec
2.228 × 10
gallons/min
liters/sec
0.06308
−3
2.1 Application and Selection
157
2
TABLE 2.1a Continued
Conversion of Volume or Flow Units
To Convert
Into
Multiply by
gallons/min
cu. ft/hr
8.0208
kilograms
dynes
980,665.0
kilograms
grams
1,000.0
kilograms
poundals
70.93
kilograms
pounds
2.205
kilograms
tons (long)
9.842 × 10
−4
kilograms
tons (short)
1.102 × 10
−3
pounds
drams
256.0
pounds
dynes
44.4823 × 10
pounds
grains
7,000.0
pounds
grams
453.5924
pounds
kilograms
0.4536
pounds
ounces
16.0
pounds
ounces (troy)
14.5833
pounds
poundals
32.17
pounds
pounds (troy)
1.21528
pounds
tons (short)
0.0005
4
specified error limit must not be exceeded) and identify the
flow sensor categories that can provide such rangeability.
After considering such key criteria as rangeability, it is
appropriate to prepare a list of other requirements that might
relate to installation, operation, or maintenance and, by referring to Tables 2.1b through 2.1e, check their availability.
Usually, by the end of this process, the choice will have been
narrowed to two or three designs.
Having narrowed the choices, the application engineer is
advised to turn the pages of this handbook to the sections in
which the selected flowmeter designs are discussed. At the
beginning of each of these sections, a “feature summary” is
provided, containing data on the limits on operating pressure
and temperature, sizes, construction materials, costs, and
other factors. The final selection is usually made by choosing
the least expensive flow sensor that possesses all the features
and characteristics needed for the application.
Special Requirements
To consider such special features as reverse flow, pulsating
flow, response time, and so on, it is necessary to study the
individual meter specifications in detail. Sometimes it is
also necessary to obtain unpublished test data from the
manufacturers.
Although the steps we have described will eliminate the
technically unsuitable meters, it does not necessarily follow
that a meter will always be found that is perfectly suited for
a given application. For example, electromagnetic flowmeters
are available for operating at pressures as high as 1500 PSIG
© 2003 by Béla Lipták
(10.3 × 10⁶ N/m ). They are also available for flow rates as
3
high as 500,000 GPM (31.5 m /sec), but they are not available
to detect a flow rate of 500,000 GPM at 1500 PSIG.
The list of technically suitable meters will get shorter as
the complexity of the application increases. For an application
in which the flow of a highly corrosive and nonconductive
sludge is to be measured, the list of acceptable sensors might
consist of a single meter design (the cross-correlation type
discussed later in this section). In contrast, on a straightforward
clean-water application, the list will consist of most of the flow
detectors listed in the orientation table (Table 2.1b).
In such cases, the engineer should narrow the choice by
concentrating on the reasons for measuring the flow. We
should ask if high accuracy is the most important or if the
emphasis should be on long-term repeatability, low installed
cost, or ease of maintenance. It should also be realized that
certain flow detectors, such as those for the measurement of
two-phase flow, are still in the developmental stage and are
1–4
not readily available.
In the following paragraphs, the features, characteristics,
and limitations of some of the more widely used flow sensor
categories will be briefly discussed. After that discussion, the
important considerations of cost, accuracy, Reynolds number,
safety, and installation requirements will be covered.
DIFFERENTIAL PRESSURE
The detection of pressure drop across a restriction is undoubtedly the most widely used method of industrial flow measurement. The pressure decrease that results from a flowing
stream passing through a restriction is proportional to the
flow rate and to fluid density. Therefore, if the density is constant (or if it is measured and we correct for its variations),
the pressure drop can be interpreted into a reading of flow.
This relationship is described by the following formula:
Q(flow) = K (constant )
h(differential head)
d (fluid density)
2.1(1)
Differential-pressure (d/p) meters have the advantage of
being the most familiar meter type. They are widely used to
measure the flow of both gases and liquids, including viscous
and corrosive fluids. Their advantages include the lack of moving parts and a suitability for practically all flow rates in a
wide variety of pipes and tubes.
All differential-pressure meters exhibit a square-law relationship between the generated head and flow rate, which
severely limits their rangeability (typically 3:1, with 4:1
being the maximum). Another disadvantage of d/p type flowmeters is that, in addition to the sensor element, several other
components are needed to make a measurement. These
include not only the readout or transmitter but also a threevalve manifold and fittings to attach the readout or transmitter
158
Flow Measurement
TABLE 2.1b
Orientation Table for Selecting the Right Flow Sensors
Elbow Taps
L
SR
L
Jet Deflection
Magnetic Flowmeters
L
Positive Displacement
Gas Meters
© 2003 by Béla Lipták
SD
SD
SD
SD
SD
Metering Pumps
Pitot Tubes
SD
L
L
SR
L
SR
SD
0.05 03
5–10*
25:1
N
20/5
2*
H
15/5
1
/ 2 –5*
H
5/3
1
/ 2 **–2*
100:1
20:1
A
H
N
N
1
20:1
–
N
1
/ 10 –1*
20/5
1
/ 2 **–2*
M
30/5
0.5–5*
M
N
1
3:1
10:1
to 200:1
H
2.8
10 – 6 10 –5
25/10
3:1
1.0
1.0
10 2
10
102
10
10 3
10 3
/ 2**
0.15–1/ 2**
/ 2 –1***
10 – 6
10 –5
10 – 4
10 –3
10 –3
10 –2
10 5
10 6
Ibm/hr
28.3
10 – 4
10 4 kgm/hr
10 4
cc/min
Accuracy
* ± % Full Scale
** ± % Rate
*** ± % Registration
Pressure Loss Thru Sensor
0.1
N
10:1
Mass Flowmeters, Misc.
Coriolis
0.1
3:1
10:1
Laminar Flowmeters
Orifice (Plate or Integral
Cell)
Rangeability
Linear Output
Transmitter Available
Direct Indicator
Inherent Totalizer
Flow Rate Sensor
Volumetric Flow Detector
Direct Mass–Flow Sensor
Solids
Gas
Slurry
Viscous Liquids
Clean Liquids
Type of Design
Approx. Straight Pipe-Run requirement
Upstream Diam./Downstream Diam.)
FLOW RANGE
Applicable to Detect
the Flow of
10 –2 0.1
0.1
1.0
1.0
10
Sm3/hr or Am3/hr
10
10 2 10 3 10 4
10 2
10 3
10 4
Solids
Flow
Units
Gas
Flow
Units
10 5
SCFM or ACFM
cc/min
.004 0.04 0.4 3.8
38 379
10 – 6 10 –5 10 – 4 10 –3 10 –2 0.1
10 – 6 10 –5 10 – 4 10 –3 10 –2 0.1
1.0
1.0
10
10
10 2
10 2
10 3
10 3
10 4 m 3/hr
10 4
10 5
10 6
gpm
Liquid
Flow
Units
gpm—m3/hr
SCFM—Sm3/hr
SCFM—Sm3/hr
gpm—m3/hr
SCFM—Sm3/hr
gpm—m3/hr
lbm/hr–kgm/hr
SCFM—Sm3/hr
gpm—m3/hr
gpm—m3/hr
SCFM—Sm3/hr
gpm—m3/hr
SCFM—Sm3/hr
SCFM—Sm3/hr
SD
Positive Displacement
Liquid Meters
SR
Segmental Wedge
Solids Flowmeters
SD
Target Meters
SD
SD
L
Thermal Meters
(Mass Flow)
L
Turbine Flowmeters
(Dual Turbine)
L
V-Cone Flowmeter
L
Ultrasonic Flowmeters
Transit
Doppler
L
L
SD
SD
SD
L
Variable–Area
Flowmeters
(Dual float)
L
L
Venturi Tubes
Flow Nozzles
L
L
L
L
L
3:1
M
15/5
3**
20:1
—
5/3
1
lbm/hr–kgm/hr
0.5*–5*
L
20:1
A
5/3
1–2*
10:1
(>100:1)
H
15/5
3:1
M
2/5
20:1
10:1
N
N
5:1
(to 20:1)
A
3:1
3:1
M
H
10:1
20:1
10:1
H
H
H
20/5
20/5
20/5
0.5–1.5**
1–2**
0–5*
100:1
M
See Text
2–5*
SR
SR
SD
15/5
15/5
N
15/5
20/5
gpm—m3/hr
gpm—m3/hr
SCFM—Sm3/hr
20/5
L
gpm—m3/hr
/2**–4*
H
Vortex Shedding
Fluidic
Oscillating
Weirs, Flumes
0.1–2**
4:1
SR
L
N
SR
SD
L
H
10:1
1
/4**
1
/2–2**
1**–2*
2–3*
gpm—m3/hr
SCFM—Sm3/hr
gpm—m3/hr
SCFM—Sm3/hr
gpm—m3/hr
ACFM—Sm3/hr
gpm—m3/hr
SCFM—Sm3/hr
1
/2*–10**
1
/2**–1*
1**–2*
gpm—m3/hr
SCFM—Sm3/hr
gpm—m3/hr
SCFM—Sm3/hr
gpm—m3/hr
ACFM—Sm3/hr
gpm—m3/hr
2.1 Application and Selection
----- = Non-standard Range
L = Limited
SD = Some Designs
H = High
A = Average
M = Minimal
N = None
SR = Square Root
= The data in this column is for general guidance only.
= Inherent rangeability of primary device is substantially greater than shown. Value used reflects limitation of differential pressure sensing device, when 1% of actual flow of accuracy is desired. With multiple-range intelligent transmitters the
rangeability can reach 10:1.
= Pipe size establishes the upper limit.
= Practically unlimited with the probe type design.
= Must be conductive.
= Can be re-ranged over 100:1.
= Varies with upstream disturbance.
= Can be more at high Re. No. services.
= Up to 100:1 with high-precision design.
= Commercially available gas flow elements can be 1% of rate.
= More for gas turbine meters.
159
© 2003 by Béla Lipták
160
Flow Measurement
?
*
?
X
SD
X
?
X
?
High
Viscosity
Very
Corrosive
?
?
*
?
*
X
*
?
?
X
?
X
X
?
?
X
?
?
X
X
X
SD
?
?
X
X
?
?
X
X
X
?
?
X
X
X
X
?
?
?
X
?
?
X
?
X
X
X
X
?
X
X
X
X
X
X
X
X
X
X
X
High
Pressure
X
X
X
X
X
X
X
X
Steam
X
X
X
Reverse
Flow
X
Pulsating
Flow
?
X
?
?
X
X
X
X
X
X
?
X
X
?
X
X
Low
Pressure
X
?
X
?
?
Fluidic Oscillation
X
Venturi
X
V.A.
X
*
Vortex Precession
X
X
X
Vortex Shedding
Slurries
Low
Viscosity
X
?
X
Transit U-Sonic
?
Doppler U-Sonic
Solids Flowmeter
X
Gas Turbine
Liquid Displacement
X
Liquid Turbine
Gas Displacement
?
X
*
Thermal
Pitot
?
Target
Orifice
Metering Pumps
Electro-Magnetic
?
*
Dirty
Corrosive
Gas
Laminar
X
Elbow Taps
Clean
Liquid
Fluid Details
Correlation
Meter Type
Angular Momentum
TABLE 2.1c
Flowmeter Selection for Metering a Variety of Fluids
X
X
X
X
X
X
X
X
X
X
X
SD
SD
X
X
X
X
SD
X
X
X
X
X
X
SD
SD
X
X
X
X
X
X
X
?
X
X
X
X
X
X
X
X
?
?
X
X
X
* = Must be electrically conductive
= Generally suitable
? = Worth consideration
X = Not suitable
SD = Some design
to the sensor. As a result, the installation is time consuming
and, as a result of the many tube or pipe joints, it requires
relatively high maintenance to eliminate leakage.
head-type flow elements. The Reynolds number can be calculated by the following equation:
Re =
Reynolds Number
If the Reynolds number (Re) and flow rate are both constant,
the output signal of a head-type flowmeter will also be constant. However, if the Re changes, that will also change the
meter reading, even at constant flow. Therefore, it is recommended to calculate the Reynolds numbers at both maximum
and minimum flows and check whether the corresponding
change in flow coefficients is within the acceptable error. If
it is not, a different type of sensor must be selected, such as
the quadrant-edged orifice for low-Reynolds-number applications or a flowmeter type that is insensitive to Reynolds
variations, such as the magnetic meter.
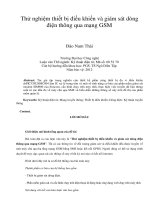
Figure 2.1f depicts the relationship between the pipeline
Reynolds number and the discharge coefficients of various
© 2003 by Béla Lipták
where
Gf =
Qf =
D=
µ=
3.160G f Q f
Dµ
2.1(2)
process fluid specific gravity (at 60°F, or 15.5°C)
liquid flow in GPM
pipe inside diameter (in inches)
viscosity of the process fluid (in centipoise)
As shown by Figure 2.1f, the orifice plate discharge coefficient is constant within ±0.5% over a Reynolds number
4
6
range of 2 × 10 to 10 . The discharge coefficient being constant guarantees that no measurement errors will be caused
by Reynolds number variations within this range. On the other
hand, if, at minimum flow, the Reynolds number would drop
below 20,000, that would cause a substantial increase in the
discharge coefficient of the meter and a corresponding error
2.1 Application and Selection
161
TABLE 2.1d
Flowmeter Selection Table*
Clean
Liquids
Differential Pressure
Orifice
Dirty
Liquids
Corrosive
Liquids
Viscous
Liquids
Abrasive
Slurries
Fibrous
Slurries
Low
Velocity
Flows
Hi
Temp.
Service
Cryogenic
Service
SemiFilled
Pipes
X
??
X
??
??
??
X
??
X
Vapor or
Gas
NonOpen
Newtonians Channel
??
?
?
X
X
Venturi
?
??
??
??
??
Flow Nozzles and Tubes
??
??
??
??
??
??
??
??
X
??
X
Pitot Tubes
??
?
??
X
X
??
??
??
X
X
X
Elbow
?
?
??
?
??
X
Magnetic
Mass
Coriolis
Thermal
??
??
X
??
X
?
X
??
X
??
?
??
?
?
??
??
??
X
??
X
X
??
X
??
??
X
X
X
??
??
X
X
X
??
X
X
X
X
??
??
X
X
X
?
?
??
Oscillatory
Vortex Shedding
??
??
??
??
??
?
?
?
??
X
X
X
Fluidic
??
?
??
X
X
X
??
X
Vortex Precession
X
??
Positive Displacement
X
??
Target
?
?
Turbine
??
??
Ultrasonic
Transit Time
Doppler
??
X
X
X
X
X
X
X
?
??
X
??
??
??
X
??
X
?
X
X
??
??
??
X
X
?
??
??
X
X
??
??
X
??
X
X
?
??
??
??
??
??
X
X
X
X
??
X
?
X
X
X
X
X
X
Variable Area
?
?
?
X
X
??
Weirs and Flumes
?
??
X
??
??
?
X
X
Designed for this service
?? Applicable for the service under certain conditions, consult manufacturer
? Normally applicable for this service
X Not applicable for this service
*Courtesy of Fischer & Porter, which today is new ABB Process Automation.
in the measurement. Therefore, it is advisable to limit the use
of orifice plates to applications where the Reynolds number
stays above 20,000 throughout the flow range.
One can calculate the yearly operating cost of any flow
measurement installation by using the following formula:
$/yr = C($/KWH)(OT)(dP)(F)(SpG)/(%)
Energy Costs
In larger pipes or ducts, the yearly energy operating cost of
d/p-type flowmeters can exceed the purchase price of the
meter. The permanent pressure loss through a flowmeter is
usually expressed in units of velocity heads. The velocity
2
head is calculated as v /2g, where v is the flowing velocity
2
and g is the gravitational acceleration (9.819 m/sec or 32.215
2
ft/sec at 60° latitude).
Therefore, the velocity head at, say, a flowing velocity
2
of 10 ft/sec is calculated (in the English units) as 10 /64.4 =
1.55 ft of the flowing fluid. If the flowing velocity is 3 m/sec,
the velocity head is calculated (in the metric units) as
32/19.64 = 0.46 m of the flowing fluid. The velocity head is
converted into pressure drop by multiplying it with the specific gravity of the flowing fluid. As shown in Table 2.1g, the
different flowmeter designs require different pressure drops
for their operation.
© 2003 by Béla Lipták
2.1(3)
where
C = a correction factor for the units used (C = 1.65
if the flow is in GPM and the pressure loss is
in feet)
$/KWH = unit cost of electricity in the area
OT = operating time of the meter (1.0 if operated
continuously)
dP = pressure loss in velocity heads in the particular
meter (units are feet or meters)
3
F = flow rate (units are in GPM or m /sec)
SpG = specific gravity of the flowing fluid (water =
1.0)
% = efficiency of the pump (or compressor)
expressed as a fraction (70% = 0.7)
Example
Let us calculate the yearly cost of operation if
an orifice sized for 100-in. H2O pressure drop (dP = 8.333 ft =
162
Flow Measurement
TABLE 2.1e
Flowmeter Selection Table*
Gases
(vapors)
Liquids
Abrasive
Fibrous
Corrosive
Dirty
Viscous
Clean
Pipe size, in (mm)
Dirty
Flowmeter
Clean
Slurries
Temperature, °F (°C)
Pressure, PSIG (kPa)
Accuracy, uncalibrated
(including transmitter)
Reynolds number†
or Viscosity
±1–2% URV
RD > 2000
±1% URV
RD > 1000
±2–5% URV
RD > 100
±2% URV
RD > 200
±2% URV
RD > 10,000
±2% URV
RD > 10,000
±2% URV
RD > 10,000
±1.5–5% URV
RD > 100
±1–±2% URV
RD > 75,000
>1.5 (40)
X
X
Honed meter run
0.5–1.5 (12–40)
X
?
Integral
<0.5(12)
X
Quadrant/conic edge
>1.5(40)
X
Eccentric
>2(50)
?
?
X
Segmental
>4(100)
?
?
Annular
>4(100)
?
?
?
?
X
X
X
?
X
X
X
?
X
X
?
?
X
X
?
X
X
X
?
X
X
X
?
X
X
X
Target
0.5−4 (12–100)
Venturi
>2(50)
Flow nozzle
>2(50)
?
Low loss
>3(75)
X
Pitot
>3(75)
X
?
X
Annubar
>1(25)
X
X
X
Elbow
>2(50)
?
X
?
© 2003 by Béla Lipták
?
?
X
X
?
?
?
?
?
?
?
X
X
?
X
X
X
X
?
X
X
?
X
X
?
?
?
To 4000 PSIG (41,000 kPa)
Orifice
Square-edged
Process temperature to 1000°F (540°C); transmitter
limited to −30–250°F(−30–120°C)
SQUARE ROOT SCALE. MAXIMUM SINGLE RANGE 4:1
±1–±2% URV
RD > 10,000
±1.25% URV
RD > 12,800
±5% URV
No limit
±1.25% URV
RD > 10,000†
±4.25% URV
RD > 10,000†
LINEAR SCALE TYPICAL RANGE 10:1
Magnetic
0.1–72 (2.5–1800)
360 (180)
≤1500 (10,800)
±0.5% of rate to ±1% URV
No limit
Positive-displacement
<12 (300)
X
X
X
?
X
X
Gases: 250 (120)
Liquids: 600 (315)
≤1400 (10,000)
Gases: ±1% URV
Liquids: ±0.5% of rate
≤8000 cS
Turbine
(Dual turbine)
0.25–24 (6–600)
X
X
X
?
X
X
−450–500 ( −268–260)
≤3000 (21,000)
Gases: ±0.5% of rate
Liquids ±1% of rate
(±0.1% of rate over
100:1 range)
≤2–15 cS
Ultrasonic
Time-of-flight
>0.5 (12)
X
X
?
X
X
X
−300–500 (−180–260)
Pipe rating
±1% of rate to ±5% URV
No limit
>0.5 (12)
X
X
−300–250 (−180–120)
Pipe rating
±5% URV
No limit
Doppler
X
X
Variable-area
(Dual float)
≤3 (75)
X
Vortex
1.5–16 (40–400)
?
X
?
X
X
?
X
X
Glass: ≤400 (200)
Metal: ≤1000 (540)
Glass: 350 (2400)
Metal: 720 (5000)
±0.5% of rate to ±1%
URV (up to 20:1 range)
<100 cS
?
?
X
X
≤400 (200)
≤1500 (10,500)
±0.75–1.5% of rate
RD >10,000
cS = centiStokes
URV = Upper range value
= Designed for this application
?
= Normally applicable
X
= Not applicable
*This material is reproduced by permission of McGraw-Hill, Inc., from R. W. Miller’s Flow Measurement Handbook, 2nd edition, 1989.
†According to other sources, the minimum Reynolds number should be much higher.
2.1 Application and Selection
163
© 2003 by Béla Lipták
164
Flow Measurement
Orifice Plates
Coefficient of Discharge
Concentric
Square-Edged
Orifice
Magnetic
Flowmeter
Eccentric
Orifice
= 2%
Integral
Orifice
Venturi Tube
Target Meter
(Best Case)
Flow
Nozzle
Target Meter
(Worst Case)
102
10
103
104
Quadrant-Edged Pipeline
Orifice
Reynolds
Number
5
10
106
FIG. 2.1f
Discharge coefficients as a function of sensor type and Reynolds
number. (Courtesy of The Foxboro Co.)
TABLE 2.1g
Velocity Head Requirements of the Different Flowmeter Designs
Permanent Pressure Loss
(in Velocity Heads)
Flowmeter Type
Orifice plates
Over 4
Vortex shedding
Approximately 2
Positive displacement
1 to 1.5
Turbine flowmeter
0.5 to 1.5
Flow tubes
Under 0.5
3.6 PSID) in a 16-in. schedule 40 steel pipe is measuring the
flow of 5000 GPM of water flow. The meter is operating
continuously (OT = 1.0), the cost of electricity is $0.1/kWh,
and the pump efficiency is 60% (% = 0.6).
$/yr = 1.65(0.1) (1.0) (8.333) (5000) (1.0)/0.6
= $11,457 per year
2.1(4)
If the cost of electricity is $0.1/kWh and the pumping
efficiency is 60%, the operating cost of any continuous pressure drop in any water pumping system can be calculated as
$/yr = 0.635 (GPM) (PSID)
2.1(5)
Therefore, when selecting a flowmeter, we should consider
not only the purchase and installation costs but also the
operating cost during the life of the flowmeter. As was shown
above, a major component of the operating cost of flowmeters
is their pumping (or compressor operating) energy costs.
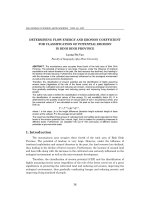
In the following paragraphs, the main advantages and
disadvantages of the large family of d/p measurement-based
flow sensors (Figure 2.1h), this most widely used flowmeter
category will be discussed. The discussion here will be limited to the highlights of sensor features. For an in-depth
discussion of their features and characteristics, the reader
should turn to the appropriate section in this chapter that is
devoted to the particular design.
© 2003 by Béla Lipták
Orifice plates are the simplest and least expensive flow element within the d/p-type sensors. The total installed cost is
relatively independent of pipe diameter, because the cost of
the piping manifold and the differential-pressure readout or
transmitter are unaffected by pipe size and are relatively
constant. Consequently, the orifice-type installations are relatively expensive in smaller pipe sizes and rather economical
in pipe sizes over 6 in. (150 mm).
Orifices can be used in a wide range of applications,
because these plates are available in a variety of materials
and in many designs, such as concentric, segmental, or eccentric. Another advantage is that the orifice plate can be badly
worn or damaged, yet it will still provide a reasonably repeatable output, albeit significantly inaccurate. Another very convenient feature of the orifice-type installation is the ability to
service or replace the readout or transmitter without the need
to remove the orifice or to interrupt the process flow.
5
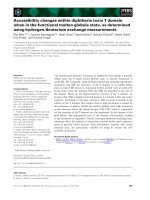
The main disadvantages are the low accuracy (Figure 2.1i)
and low rangeability of standard orifices, although substantial
improvements been reported (error under 1% of actual flow
over a 10:1 range) when intelligent and multirange d/p cells
are used. Other disadvantages of orifice-type installations
include the high irrecoverable pressure loss (40 to 80% of
the generated head) and the deterioration in both measurement accuracy and in long-term repeatability as the edge
wears or as deposits build up. High maintenance is another
disadvantage in installations where manifold leakage or pressure tap plugging are likely.
Orifice-type flow measurement has been modified, and
new, special-purpose devices have been introduced to meet
particular process requirements. One such unique design is
the annular orifice used to measure the hot and dirty gases
in the steel industry. Here, the process flow passes through
an annular opening between the pipe and a disk-shaped,
concentrically located plate, and the pressure difference is
detected between the upstream and downstream faces of that
disk. This design is shown in the section on target meters.
For paper pulp or slurry flow detection, the segmental
and eccentric orifices (Section 2.15), venturi cones (Section
2.28) and the segmental wedge elements (Section 2.21) have
been developed. The venturi cone is shaped as a restriction
in the center of the flow path, forcing the flowing stream into
an annular space between the cone and the pipe. The segmental wedge element restricts the flow passage, because the
top of the pipe is indented. These sensors are all used on
dirty fluids or fluids at higher temperatures.
Venturi Tubes and Nozzles
The shapes of these tubes and nozzles have been obtained with
the goal of minimizing the pressure drop across them. These
tubes are often installed to reduce the size of (and therefore
capital expenditures on) pumping equipment and to save on
pumping energy costs. In contrast with the sharp-edged
2.1 Application and Selection
Eccentric
Segmental
R
Flow
Area
Wedge
a) Sharp-edged, eccentric, segmental orifice and wedge designs
Target
Flow
D
d
d
t
Flow
b) Annular, target and V-cone designs
Flow
D
d
c) Venturi tube, flow nozzle and elbow tap designs
Static
Opening
Flow
Impact
Opening
d) Conventional and area-averaging pitot tube designs
FIG. 2.1h
Pressure difference producing flowmeter designs.
© 2003 by Béla Lipták
165
166
Flow Measurement
+6
Total
Error
Accuracy: Percent of Actual
+4
+2
+1
0
Transmitter
Error
Orifice
Plate
± 1%
AF
Typical
−1
−2
−4
−6
20
30
50
70
Flow Range: Percent of Maximum
100
FIG. 2.1i
Total error of an orifice type flow measurement, using a ±1/2% fullscale d/p cell, is shown as a function of actual flow.
orifice, these tubes and nozzles are resistant to abrasion and
can also be used to measure the flow of dirty fluids and
slurries. They are, however, considerably larger, heavier, and
more expensive than the orifice plate. Their installation is
also more difficult.
Flow nozzles represent a transition between orifices and
flow tubes. They are less expensive, but they produce more
head loss than do the flow tubes.
Sonic Venturi Meters
A flowmeter with very high rangeability can be obtained
when the venturi tubes are inserted into a multiport digital
control valve (illustrated in Figure 2.1j) in which the area of
each port is twice the size of the next smaller one. The on/off
ports are opened through binary manipulation and, therefore,
the meter rangeability is a function of the number of ports
used. With 8 ports, the rangeability is 255:1; with 10, it is
1023:1; with 12 it is 4095:1; and so on. The digital control
valve is converted into a flowmeter by inserting a sonic velocity
venturi into each of the ports. A sonic velocity venturi element
passes a known and constant flow rate when the flow velocity
at its throat reaches sonic velocity. Therefore, this flowmeter
requires that the meter pressure drop continuously exceed
40% of the absolute upstream pressure to guarantee the continuous presence of sonic velocity of the throat of the venturi
tubes. Because of the inherent requirement for this high pressure drop, this meter is ideal for applications in which it is
desirable to lower pressure as well as to measure the flow.
The accuracy of the sonic venturi is 1/2 to 1% of actual
flow throughout the meter range. With the addition of inlet
gas pressure, temperature, and/or density sensors, it can be
converted for mass flow measurement. The sonic venturi can
also meter the flow of liquids. This flowmeter is available in
sizes from 1 to 8 in. (25 to 200 mm). Units have been built
© 2003 by Béla Lipták
FIG. 2.1j
Sonic venturi digital flowmeter featuring extremely wide rangeability.
for up to 10,000 PSIG (69 MPa) pressure services and for
temperatures from cryogenic to 1200°F (650°C).
Pitot Tubes
A pitot tube is a small, open-ended tube, that is inserted into
the process pipe with its open end facing into the flow. The
differential between the total pressure on this open impact
port and the static pipeline pressure is measured as an indication of flow. For the measurement of large flows, the pitottube-type sensors provide a very low-cost measuring system
with negligible pressure loss. They are also convenient for
temporary measurements and for traversing pipes and ducts
to obtain their velocity profiles. Their principal limitation is
that they measure the flowing velocity at only one point and
therefore, even after calibration, they will be in error every
time the velocity profile changes. Therefore, they are used
only when low-accuracy volumetric readings are acceptable,
such as in HVAC applications. They are also subject to plugging and therefore require substantial maintenance.
To reduce the effect of velocity profile changes and thereby
improve the measurement accuracy, multiple-opening pitot
tubes and area-averaging pitot traverse stations have also been
developed.
Elbow Taps
Elbow taps measure the flow rate by detecting the differential
pressure between taps located on the inner and outer radii of
an elbow. In larger pipes, this results in a very low-cost
installation, because pipe size does not affect cost. This is a
crude, inaccurate measurement, requiring high flow velocities
and long upstream, straight pipe lengths.
2.1 Application and Selection
Target (or Impact) Meters
In a target flowmeter, a target or impact plate is inserted into
the flowing stream, and the resulting impact force is detected
electronically or pneumatically as an indication of flow. The
target meter installations are more expensive than orifices but
because (in case of the target design) there are no pressure taps
to plug, they are better suited for applications in which the
process fluid is “sticky” or contains suspended solids. The
other advantage is that they have no moving parts. Their accuracy and rangeability (3:1) are low, but they can be reranged.
ELECTROMAGNETIC METERS
Magnetic flowmeters operate in accordance with Faraday’s
law, because these meters measure the velocity of electrically
conductive liquids as they cut the magnetic fields that are maintained across these metering tubes. The main advantages of
magnetic flowmeters include their completely unobstructed
bore and their lack of moving parts. Because of these features,
they introduce no pressure loss and experience no wear and
tear on their components. Other advantages include their
chemical compatibility with virtually all liquids; indifference
to viscosity, pressure, temperature, and density variations;
ability to provide linear analog outputs and to measure bidirectional flows; availability in a wide range of sizes; and ease
and speed of reranging on site.
Their major limitation is that they can be used only on
electrically conducive fluids. (This requirement eliminates
their use on all gases and on most hydrocarbon fluids.)
Another disadvantage is their high purchase price and the
cost of maintaining the magnetic field. To locate the flow
tube in an explosion-proof area, the converter and power
supply must be remotely located, and intrinsic safety barriers
must be installed between them and the tube.
Electromagnetic flowmeters are often recommended for
applications involving corrosive aqueous liquids and slurries.
In their more recent designs, the magnetic flowmeter probes
are provided with electrode cleaners, and the magnetic field
is cycled so as to conserve electric energy and to allow automatic rezeroing, which guarantees better accuracy. The use of
ceramic flowtubes has reduced their costs while eliminating
electrode leakage, because the sintered electrodes cannot leak.
The addition of intelligence through digital chips has allowed
double-range operation, increased turndown, guaranteed the
detection of empty pipes, and reduced the measurement error
to within 0.5% of actual flow over a 10:1 range.
167
meter is one of the most accurate meters available for low- to
medium-viscosity products. Rangeability of single turbine
meters is around 10:1, for dual-turbine meters, it exceeds 100:1.
Turbine meters can be used under practically any pressure and
for applications involving extremely high and low temperatures. They are easy to install and, relative to the pipe diameter,
are also small in size and weight. The meter provides a very
fast response speed and is suitable for hygienic applications.
Their principal limitations include high cost, incompatibility
with viscous or dirty liquids, and the potential for being damaged
by over-speeding if slugs of gas or vapor are sent through the
liquid meter. The installation of upstream filters is often recommended, in spite of the fact that it increases both the pressure
drop and the maintenance requirement of the installation.
Turbine meters are widely used when high-accuracy measurements are required in applications involving product sales.
They are also used when high accuracy is required in blending,
on test rig duty, and in general measurement. Variations on the
basic turbine flowmeter design include nonelectric (fiber optic)
detectors; turbine probes; bearingless “hover-flow” designs;
and various paddlewheel, impeller, and shunt-flow designs.
The impeller and paddle-flow designs cost less but also provide
less accuracy than traditional turbine flowmeters.
VORTEX METERS
While fishing in Transylvania, Theodore von Kármán noticed
that, downstream of the rocks, the distance between the shed
vortices was constant, regardless of flow velocity. From that
observation evolved the three types of vortex meters: the
vortex shedding, the vortex precession, and the fluidic oscillation versions. All three types detect fluid oscillation. They
have no moving components and can measure the flow of
gas, steam, or liquid. Their advantages include good accuracy
and repeatability, high rangeability, low maintenance, and the
ability to provide either frequency or linear analog outputs.
Vortex flowmeters cannot be used to measure the flow of
viscous or dirty process fluids. These flowmeters are also
limited to sizes under 12 in. (300 mm), because the frequency
of fluid oscillation drops off as the line size increases. The
other limitation is that vortices do not form at Reynolds
numbers below 10,000; therefore, this meter cannot be used
in low-Reynolds-number applications.
Vortex shedding meters can be general-purpose, economically competitive alternatives to the orifice plate, and they
are also used in many more demanding applications because
of their superior accuracy and rangeability.
TURBINE METERS
VARIABLE-AREA METERS
In turbine meters, a digital output is generated, which is linear
with the process flow, as the speed of rotation of the turbine is
measured. Turbine meters can be used in both liquids and gases,
and they are suitable for the measurement of both very low and
very high flow rates, as insertion designs. The liquid turbine
Variable-area meters are widely used for applications in
which small flow rates are to be measured or where local
indication is required. They are also common in purge meter
installations, test rigs, and general industry. Variable-area
meters are available in both glass and metal tube construction.
© 2003 by Béla Lipták
168
Flow Measurement
In the glass tube design, the position of the float can be
visually observed as an indication of flow rate.
The main advantage of the glass tube design is its selfcontained nature, which eliminates the need for power supplies. Other advantages include their low cost, low pressure
loss, direct flow indication, and the ability to detect very low
flow rates of both gases or liquids, including viscous fluids.
The limitations of all variable-area meters include the
need for vertical mounting and that they are available only
in smaller sizes. The disadvantages of the glass tube design
also include its low accuracy, the limited availability of transmitters, and the design’s relatively low pressure ratings.
The metallic tube units are readily available as transmitters and can be obtained in larger sizes, with higher pressure
ratings. They provide good rangeability (5:1) and a linear
output, but they, too, are limited to use with clean fluids and
must be mounted vertically.
A wide variety of the types of designs exist in which
gravity has been replaced by spring loading. In these units,
an increase in flow results in a compression or deflection of
a spring, and this motion is used to operate the display. These
units can be mounted in any position, including horizontally,
as flow-through pipeline devices.
air or dirt. The Doppler meter is frequently used in a “clampon” design, which can be attached to the outside of existing
pipelines. It detects the flowing velocity only in a small area
where the sonic beam enters the flowing stream. Therefore,
if that velocity is not representative of the full cross section
of the pipe, the measurement accuracy will be poor. Its main
advantage is its low cost, which does not increase with pipe
size. Its main limitation is that it is not suitable for the
measurement of clean fluids or clean gases.
The transit-time type ultrasonic flowmeters are often
found in water treatment and chemical plant applications.
Here, single or multiple ultrasonic beams are sent at an acute
angle across the flowing stream, first in the same direction
as the flow and then in the opposite direction. Flow rate is
detected as the difference in transit times. This type of ultrasonic meter is considerably more expensive than the Doppler
version, but it offers better accuracy. Unlike the Doppler
meter, it is usable only on relatively clean fluid applications.
Its advantages include that it introduces no restriction or
obstruction to flow, so its pressure drop is low. One limitation
is that its performance is a function of the piping configuration, and it requires fairly substantial upstream, straight runs
(about 15 pipe diameters).
POSITIVE-DISPLACEMENT METERS
METERING PUMPS
Positive-displacement (PD) meters are often used when accurate
quantities need to be delivered, either for reasons of recipe
formulation in batch processes or for accounting purposes during sales. The PD meters trap a fixed volume of fluid and transfer
it from the inlet to the outlet side of the meter. The number of
such calibrated “packages” of fluid is counted as a measure of
volumetric flow. Design variations include the rotary piston, oval
gear, sliding vane, and reciprocating piston types.
Liquid PD meters offer good accuracy and rangeability
(>10:1) and are particularly suited to measure the flow of
high-viscosity fluids. These meters provide local readouts and
do not require a power supply. When operated as a transmitter, the PD meter’s output signal is linear with flow.
The PD meter applications are limited to clean fluids,
because their operation depends on close meshing surfaces.
Another disadvantage of PD meters is that they require regular recalibration and maintenance, particularly when used
to measure the flow of nonlubricating liquids. Another disadvantage is that they are bulky and heavy. Their installed
cost is high because, in addition to block and bypass valves,
they also require filters and air releases for proper operation.
Metering pumps serve the purposes of both pumping and
metering. They usually are used to accurately charge relatively
small quantities of clean fluids. Their two basic design variations are the plunger and diaphragm versions. The plunger
pump provides better accuracy, whereas the diaphragm type
is preferred for dangerous or contaminated fluid services. Their
advantages include that they are self-contained, easy to install,
and generally provide good accuracy. Metering pump performance is a function of both the process fluid (which must be
clean and contain no bubbles) and the process conditions
(which must be constant in pressure and viscosity to keep the
leakage flow constant). Other disadvantages include their high
cost, the need for periodic recalibration, and the requirement
for such accessory equipment as filters and air-releases.
ULTRASONIC METERS
Ultrasonic meters are ideally suited to measure the flow of very
corrosive liquids. They are available in two forms: Doppler
and transit-time version.
In case of the Doppler meters, an ultrasonic pulse is
beamed into the pipe and is reflected by inclusions such as
© 2003 by Béla Lipták
MASS FLOWMETERS
The measurement of mass flow can be obtained as the product
of volumetric flow and density or as a direct measurement
of the mass flow of the flowing process gas, liquid, or solids.
The mass flow of homogeneous gases is most frequently
measured by thermal flowmeters. The main advantage of these
detectors is their good accuracy and very high rangeability.
The main disadvantage is their sensitivity to specific heat variations in the process fluid due to composition or temperature
changes. If not compensated for, these changes will register as
changes in mass flow. Thermal devices, such as the hot wire
anemometers and thermal flow switches, can also detect volumetric flow rates and the flow velocities of process streams.
2.1 Application and Selection
The mass flow of liquids and gases can be directly
detected by angular-momentum devices or indirectly through
the measurement of volumetric flow and density. These traditional methods have, in recent years, been overshadowed
by the Coriolis mass flowmeter. These units detect the twisting of an oscillating, usually stainless steel, flow tube. This
twist is a function of the mass flow through the tube. Coriolis
meters can operate at process flow velocities from 0.2 to 20
ft/sec (0.061 to 6.1 m/sec) and therefore can provide a rangeability of 100:1. Their accuracy is also high (0.2% of actual
flow), their pressure and temperature ratings are acceptable,
and, in addition to the mass flow output signal, they can be
provided with additional outputs for signaling alarm conditions or detecting the process fluid’s density.
Some limitations include their relatively small sizes (up
to 6 in. [150 mm]), their vibration sensitivity, and the inability
to handle high-temperature process fluids (over 400°F
[205°C]). The Coriolis-based mass flowmeters are very
popular in the measurement of fuel flows and reactor feed
flows, and in other measurements where the mass rather than
the volume of the process flow is of interest.
At low flow rates, the Wheatstone-type mass flowmeter
can measure flow within an error of ±0.5% of actual flow
over a 100:1 range.
The mass flow of solids in gravity flow installations can
be detected by impact flowmeters, which are relatively lowaccuracy devices. Better accuracy and rangeability are provided by belt-type gravimetric feeders, which measure both
the speed and loading of the moving belt. In addition, the
loss in weight-type systems can also measure the mass flow
of liquids or solids by differentiating the load cell signal from
tank weighing systems. The rate at which the total weight is
dropping is the mass flow out of the tank. These systems do
not provide high precision and are recommended for the
measurement of hard-to-handle process flows, because they
do not make physical contact with the process stream.
Cross-correlation flowmeters are available for the measurement of mass flow of solids in pneumatic conveying
systems or for volumetric flow measurements. The crosscorrelation flowmeter uses statistical means to average the
time it takes for particles in a fluid to travel a known distance.
The meter can be noninvasive and is suitable for the measurement of the flow of solids and two-phase flows, including
heavy slurries and very corrosive and difficult liquid-flow
measurement applications. Their disadvantages include high
cost, a fairly high minimum requirement on the operating
Reynolds number, and poor accuracy.
LOW-FLOW APPLICATIONS
The measurement and control of low flow rates is a requirement in such applications as purging, in bioreactors, in leak
testing, and in controlling the reference gas flow in chromatographs or in plasma emission spectrometers.
© 2003 by Béla Lipták
169
The most traditional and least expensive low-flow sensor is
the variable area flowmeter, which is frequently made out of a
transparent acrylic material. It has a high rangeability (10:1) and
requires little pressure drop. Due to its relatively low accuracy,
it is most often used in purge and leak-detection applications.
A much more accurate low flow detector and controller
in gas metering applications is the sonic flow nozzle. This
nozzle accurately maintains constant flow as long as sonic
velocity is maintained, which is guaranteed by keeping the
inlet pressure at about 50% over the outlet pressure. The
disadvantages of the sonic nozzle include its high cost and
high pressure drop. Another disadvantage is the difficulty in
modulating the flow rate.
In laminar flow elements, the pressure drop and flow are
in a linear relationship. The laminar flow element can be used
in combination with either a differential-pressure or a thermal
type of flow detector. These flowmeters provide better rangeability at about the same cost as sonic nozzles. They have a
100:1 rangeability, and control capability is readily available.
Another advantage of thermal flowmeters over sonic nozzles
is their inherent capability to detect mass flow. Thermal flowmeters also can directly detect low-mass flows without any
laminar elements. In that case, they are installed directly into
the pipeline as either thermal flowmeters or anemometers.
SPECIFYING THE KEY REQUIREMENTS
Inaccuracy
The accuracy of a flow detector is one of its most important
features. One should not specify accuracy in such vague
terms as “best possible” or “better than one-quarter percent”
because (1) these statements are not explicit and (2) if taken
at face value, they could severely limit the meter choice and
result in unnecessarily high costs. Therefore, the metering
accuracy should be specified precisely and at a realistic value.
In some instances—for example, in case of repetitive
batch dispensing—absolute accuracy is of no critical consequence, provided that the long-term reading of the meter is
stable and repeatable. In such applications, absolute accuracy
is less important than long-term repeatability. In other applications, where absolute accuracy is important, one should
clearly specify the flow range over which the specified error
limit applies. If the error limit is given as a percentage, it
should be clearly stated whether it is based on full scale
(%FS) or on actual reading (%AR). It is also important to
distinguish the accuracy requirements for the meter from the
expected installed performance, which can be affected by
variations in the properties of the flowing stream, piping
configurations, and other factors.
The comments made about accuracy in Section 1.5
(Chapter 1) are also applicable to flow sensors. As stated there,
one should always define the flow range over which the accuracy statement applies. As illustrated in Figure 2.1k, in case of
%FS sensors, the absolute error increases as the flow rate drops.
170
Flow Measurement
% AF Error (Accuracy)
+4
1% AF
+2
0
Repeatability
+ 0.5%
25 CTP
25 CTP
0
0.3 CTP
− 0.5%
PD Meter
Turbine Meter
− 1.0%
XXX
Error: Percent of Actual Flow
+6
0
20%
40%
−2
100%
FIG. 2.1l
Differing effects of viscosity variation on a turbine meter and a
positive displacement meter (CTP = centiPoises).
1% F.S.
−4
60%
80%
Flow Range
0.3 CTP
−6
10
20
30 40
50 60 70 80
Flow Rate: Percent of Maximum
90
100
FIG. 2.1k
Comparison of 1% F.S. inaccuracy with 1% of flow inaccuracy.
Therefore, in a properly prepared specification, the accuracy
requirement should state both the required flow range and the
allowable error. Such a specification might read “1% AF from
10 to 100% flow” or “0.5% FS from 5% to 100% flow.”
If a flow detector is nonlinear, that nonlinearity must be
corrected for; otherwise, it will degrade the measurement
accuracy. Linearity is the extent to which the relationship
between the flow and the meter output approaches a straightline relationship. The linearity of a flow sensor is often different during factory calibration as compared with under the
installed conditions in the field.
The vendor’s published data on meter performance is
generally based on ideal installation and operating conditions.
Therefore, although the meter is capable of achieving that
performance level, there is no guarantee that it will realize it
under actual operating conditions. For example, insufficient
upstream straight piping can result in substantial swirling,
which will cause a deterioration in the linearity of the meter
and will therefore shift the calibration constant of the meter.
Consequently, the manufacturer’s installation recommendations should be followed carefully, or, if this is not possible,
the likely deterioration in performance should be evaluated and
determined to be acceptable before making the installation.
Changes in fluid characteristics can also alter the meter’s
performance. Figure 2.1l for example, illustrates the effects
of viscosity variations between 0.3 and 25 CTP on the performance of two of the most accurate flow detector types,
the turbine meter and the positive-displacement meter. In case
of the turbine meter, an increase in viscosity lowers the measurement accuracy; in case of the PD meter, it improves the
performance, and it is the reduction in viscosity that causes
a deterioration in the performance. For any application, the
acceptability of the consequences of the expected operating
conditions should be verified in advance.
Wear, drift, and expected shifts in calibration should also
be investigated, and the corresponding maintenance costs
© 2003 by Béla Lipták
Upstream or
Stand-by
Start Proving Run
Position
Position Sensor
Pickoff Sensor
End of Run
Position Sensor
Recycle Position
Sensor
Poppet Valve
Shaft
Calibration
Piston
Actuator
Piston
Inlet
Manifold
Outlet
Inlet
FIG. 2.1m
Inline ballistic flow prover. (Courtesy of Brooks Instrument Div. of
Emerson Electric.)
evaluated, when considering alternative meter options. In
critical applications, one might consider the installation of
automatic on-stream recalibration equipment. Figure 2.1m
illustrates an in-line ballistic prover that can recalibrate a flow
detector without requiring an interruption of the process flow.
Safety
Safely is one of the most important considerations in the
selection of any industrial equipment. In case of flow detection, all meter components must be certified as suitable for
the applicable electrical area classification for the location at
which they will operate. Meeting such requirements may be
achieved by installing purely mechanical or pneumatic
devices or, more commonly, by selecting intrinsically safe,
flameproof, or explosion-proof devices.
Other safety aspects (often overlooked) are the safety of
the selected materials of construction and the possible safety
consequences of leakage. Fluids such as oxygen or liquid
2.1 Application and Selection
chlorine can cause explosions, because they react with certain
materials. If the heat of such reactions cannot be removed, and
especially if the resulting pressure is confined, violent explosions can result. Therefore, various organic and inorganic substances, including ordinary lubricants such as oil, grease, and
wax, can cause explosions in the presence of oxygen or chlorine. It is therefore essential that any flowmeter operating in
such services be thoroughly cleaned and degreased.
The choice of the materials of construction is also critical
for applications involving high concentrations of oxygen. The
use of steels, for example, presents an explosion hazard,
which increases with a rise in the velocity and pressure of
the flowing oxygen. The maximum allowable velocity and
pressure in such applications depends on the cleanliness and
surface finish of the working components. Therefore, clean
steel with high surface finish can be used at higher pressures
and flow rates than can regular steel. Yet, the best protection
is to select such alternative materials as phosphor bronze,
gun metal, brass, beryllium, copper, and so forth.
To protect the operators, it is essential that leakage of
noxious or dangerous fluids be eliminated or kept to an absolute minimum. The addition of every joint increases the probability of leakage. Therefore, the presence of manifolds, pressure taps, and fragile components all add to the probability
of leakage. Therefore, when metering dangerous or noxious
materials, nonpenetrating flowmeter designs are preferred.
Installation
Installation requirements vary dramatically among the various meter types and can be the deciding factors in meter
selection. The most demanding applications are ones in which
the process flow cannot be stopped and the measurement
point cannot be bypassed. In such applications, the selection
choice is limited to clamp-on meters, such as the ultrasonic
Doppler or the cross-correlation design, and to the hot-tap
insertion meters, such as the various probe designs.
Even if block and bypass valves can be installed around
the meter, the installation requirements still affect both cost
and plant acceptability. One critical consideration is the availability of the requisite straight upstream and downstream pipe
lengths. If they are not available, it is necessary to derate the
performance of the meter or to consider an alternative design
such as an electromagnetic sensor, which requires only the
equivalent of 5 pipe diameters in straight upstream piping.
Specific application requirements affect different meters
in different ways. For example, if an electric power supply is
not available at the measurement point, this eliminates the
electromagnetic flowmeter from consideration. If a vertical
pipe section cannot be provided, one cannot consider the
variable area meter. A positive-displacement meter requires a
strainer, often an air release, and so on. Even if the meter
installation requirements can be met, their effect on the overall
system cost must still be considered and quantified, because
the selection should consider the total cost, which should
include installation, operation, and maintenance expenses.
© 2003 by Béla Lipták
171
Cost
Cost is a critical factor in the selection of any equipment. To
arrive at a “reasoned” decision, one should not evaluate the
purchase price only. Other factors, such as operating costs,
maintenance, spare parts inventory, the effect of downtime,
and many others, should all be considered if a reasoned
decision is to be reached. Hardware costs, in general, should
always be balanced against the potential benefits of increased
plant efficiency or product quality. These benefits are usually
by-products of increased sensor accuracy, repeatability, and
rangeability, which all tend to increase metering costs.
When evaluating the various flowmeter choices, the cost
comparison should be based on the total system cost and not
merely the flowmeter price. Not only should such costs as the
expenses for providing separate converters or transmitters be
included, we should also consider the cost of ancillary items
such as straight upstream and downstream piping, flow conditioning and filtering equipment, electric power supplies, and
so on. The cost of installation also varies with local labor rates
and can be a significant factor in the meter selection process.
Operating costs are also an important consideration.
Operating costs are affected by the amount of routine service
required and by the level of maintenance personnel needed.
These costs also increase if special tools such as flow simulator equipment are required and are not already available.
In addition to the preceding, we should consider the versatility of the selected meter. We should determine whether
the secondary units required for the particular device can also
be used on other meters. We should check whether the meter
can be used in other applications and determine the ease with
which it can be reranged. Spare parts requirements should
also be reviewed to establish both the value of the required
inventory and whether the spares will be interchangeable with
other meter sizes and models. And we should also consider
the estimated total life of the meter (which tends to be shorter
if there are moving components) and review the coverage of
the guarantee provided for the meter.
The pressure loss through the meter is also part of its
total operating cost. If we are comparing an orifice plate and
a low-loss flow tube, the initial cost of the orifice plate is
much lower; however, because of the head loss, its total cost
can be higher. As was discussed earlier, pumping cost is a
function of flow rate, electricity costs, pumping efficiency,
and pressure loss. Consequently, the higher the pressure drop
across the flow sensor, the higher will be the pumping costs
throughout the life of the installation.
References
1.
2.
Linn, J. K. and Sample, D. G., Mass Flow Measurement of Solids/Gas
Stream Using Radiometric Techniques, Report SAND-82–0228C, U.S.
Dept. of Energy, Washington, DC, 1982.
Pursley, W. C. and Humphreys, J. S., Two-phase flow measurement at
NEL, in Proc. NEL Fluid Mechanics Silver Jubilee Conference,
National Engineering Lab, East Kilbride, UK, 1979.
172
3.
4.
5.
Flow Measurement
Hewitt, G. F. and Whalley, P. B., Flow measurement in two-phase (gasliquid) systems, in Proc. Interflow ’80, Institution of Chemical Engineers, Rugby, UK, 1980.
John, H. and Riemann, J., Test Facility for Tests and Calibration of
Different Methods of Two-Phase Mass Flow Measurements, Institute
Fuer Reaktorbauelements, Karlsruhe, Germany, 1979.
Lipták, B. G., Flow measurement trends, Control, June 2000.
Bibliography
Batur, C., Measuring flow with machine vision, InTech, May 1989.
Baker, R. C., Flow Measurement Handbook, Cambridge University Press,
UK, 2000.
Corser, G. A. and Hammond, G. C., A combined effects meter, InTech, April
1993.
Cushing, M., The future of flow measurement, Flow Control, January 2000.
De Boom, R. J., Flow Meter Evaluation, ISA Conference Paper #91–0509,
1991.
Defeo, J. W., Turbine Flowmeters for Measuring Cryogenic Liquids, ISA
Conference, Houston, October 1992.
Desmeules, M., Fundamentals of Gas Measurement, Canadian Meter Company, Milton, Ontario, Canada, June 1999.
Eren, H., Flowmeters, Survey of Instrumentation and Measurement, S.A.
Dyer, Ed., John Wiley & Sons, New York, 2001.
The Flowmeter Industry, 1985–1990, 2nd ed., Venture Development Corp.,
Natick, MA, 1986.
Furness, R. A., Developments in pipeline instrumentation, Pipe Line Rules
of Thumb Handbook, 4th ed., Gulf Publishing, Houston, TX, 1998.
Ginesi, D., Application and Installation Guidelines for Flowmeters, ISA/93
Conference, Chicago, IL, September 1993.
Ginesi, D. and Annarummo, C., User tips for mass, volume flowmeters,
InTech, April 1994.
Grant, K., Mass Flow Measurement Applications, ISA/93 Conference,
Chicago, September 1993.
Husain, Z. D., Flowmeter Calibration and Performance Evaluation, ISA
Conference, Paper #91–0508, 1991.
Ifft, S. A., Custody Transfer Flow Measurement with New Technologies,
Saudi Aramco, Saudi Arabia, 1999.
© 2003 by Béla Lipták
Krigman, A., Flow measurement: some recent progress, InTech, April 1983.
Lipták, B. G., On-Line Instrumentation, Chemical Eng., March 31, 1986.
Lipták, B. G., Flow measurement trends, Control, June 2000.
Lipták, B. G., Flow meter selection, Control, 2002.
Magness, M., Ultrasonic flowmeters pick up speed, Control, April 1996.
Mersh, F., Speed and Flow Measurement by an Intelligent Correlation System, Paper #90–0632, 1990 ISA Conference, New Orleans.
Miller, R. W., Flow Measurement Engineering Handbook, McGraw-Hill,
New York, 1993.
Miller, R. W., Flow Measurement Handbook, 3rd ed., McGraw-Hill, New
York, 1996.
O’Brien, C., Fueling flowmeter accuracy, reliability, InTech, April 1989.
O’Brien, C., Flowmeter terms, types and successful selection, InTech,
December 1989.
Renda, L., Flowmeter calibration, Meas. Control, February 1993.
Ribolini, E., Intelligent and mass vortex flowmeters, InTech, February 1996.
Robinson, C., Obstructionless flowmeters: smooth sailing for some, rough
passage for others, InTech, 33(12), 33–36, 1986.
Rose, C. and Vass, G. E., Magmeter measures flow in partially filled pipes,
InTech, April 1995.
Rusnak, J., The fundamentals of flowmeter selection, InTech, April 1989.
Scrapa, T. J., Magmeter spotlights new technology, InTech, April 1994.
Spitzer, D. W., What affects flowmeter performance, InTech, February 1993.
Spitzer, D. W., Flow Measurement, 2nd ed., ISA, Research Triangle Park,
NC, 2001.
Stobie, G. J., Wet gas metering in the real world, Wet Gas Metering Seminar,
Paris, 2001.
Waring, T., Fundamentals of Rotary Meter Measurement, Dresser Canada,
June 1999.
Watson, G. A., Flowmeter types and their usage, Chartered Mech. Eng. J.,
1978.
Welch, J. V., Trends in low gas flow metering, InTech, February 1991.
Young, A. M., Volumetric Flowrate Measurement with Coriolis Flowmeter,
1990 ISA Conference, Paper #90–0631.
Yoder, J., Flowmeter shootout, part I and II: new technologies, Control,
February and March 2001.
Zapolin, R. E., New Ways to Meet User Needs for SCADA Mass Flow
Monitoring, 1990 ISA Conference, Paper #90–0633, New Orleans, 1990.