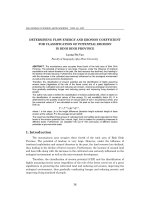
Tài liệu Báo cáo " DETERMINING FLOW ENERGY AND EROSION COEFFICIENT FOR CLASSIFICATION OF POTENTIAL EROSION IN BINH DINH PROVINCE " ppt
Bạn đang xem bản rút gọn của tài liệu. Xem và tải ngay bản đầy đủ của tài liệu tại đây (267.45 KB, 8 trang )
VNU JOURNAL OF SCIENCE, Earth sciences, T.xxIII, N
0
1, 2007
38
DETERMINING FLOW ENERGY AND EROSION COEFFICIENT
FOR CLASSIFICATION OF POTENTIAL EROSION
IN BINH DINH PROVINCE
Luong Thi Van
Faculty of Geography, Quy Nhon University
ABSTRACT. The mountainous area occupies three fourth of the total area of Binh Dinh
Province. The potential of landuse is very large. However, under the influence of irrational
exploitation and natural disasters in the past, the land resource has declined, thus leading to
the decline of forest resource. Furthermore, the increase of unused land and bare hills along
with the decrease in the cultivated area seriously influenced on the ecological environment
as well as the socio-economic development.
Therefore, the classification of erosion potential and the identification of highly assuming
erosive areas (regardless of the role of the forest cover) are of a great significance in
protecting the cultivated land and reducing soil erosion, improving ecological environment,
thus gradually eradicating hunger and reducing poverty and improving living standard of
people.
The author has used a method for classification of erosion potential (M), which is based on
the identification of numerical values of flow energy (Y) and erodability factor (K). K is
determined by the quantity of grain force of various types of soil in mountainous areas, and
the numerical values of Y are calculated on each 1ha pixel on four main rive basins in Binh
Dinh as:
Y = I
0.75
×
∆
h
0.5
×P
1.5
,
where: I is the slope; ∆h is the height difference (absolute height subtracts height of base
erosion at the valleys); P is the average annual rainfall.
The result has identified three groups of cultivated land (convertible land) equivalent to three
levels of the erosion potential (low, normal, high), that is needed for protecting measures at
different levels. Furthermore, we classified 100 out of 155 communes of different erosion
potentials at province-wide scale.
1. Introduction
The mountainous area occupies three fourth of the total area of Binh Dinh
Province. The potential of landuse is very large. However, under the influence of
irrational exploitation and natural disasters in the past, the land resource has declined,
thus leading to the decline of forest resource. Furthermore, the increase of unused land
and bare hills along with the decrease in the cultivated area seriously influenced on the
ecological environment as well as the socio-economic development.
Therefore, the classification of erosion potential (CEP) and the identification of
highly assuming erosive areas (regardless of the role of the forest cover) are of a great
significance in protecting the cultivated land and reducing soil erosion, improving the
ecological environment, thus gradually eradicating hunger and reducing poverty and
improving living standard of people.
Determining flow energy and erosion coefficient
VNU. Journal of Science, Earth Sciences, T.XXIII, N
0
1, 2007
39
2. The method of erosion potential classification in Binh
Dinh Province
The classification of erosion potential M in Binh Dinh Province is based on the
numerical value of the flow energy Y and the erodability factor K in the following
formula:
M = K×Y , (1)
The erodability factor K is determined by the quantity of grain force M* defined
by the following expression:
M*= n
2
(100 - n
3
) (2)
If n
1
> 70% then K = M*; (3)
If n
1
< 70% then K = M*
1.14
; (4)
with: n
1
:
The percentage of coarse sand (%);
n
2
: The percentage of grain force from 0.1mm to 0.002mm (sand + limon);
n
3
: The percentage of clay (%);
The numerical value Y of the flow energy (FE) is calculated on each pixel of size
100×100m (1 hectare in the field) on four main river basins in Binh Dinh by the
following formula:
Y = I
0.75
×
∆
h
0.5
×P
1.5
,
(5)
where: I is the slope;
∆
h is the height difference (absolute height subtracts height of
base erosion at the valleys); P is the average annual rainfall.
The above model is a modified model for calculation of losing soil proposed by
Ivanovski and Kornev (Nguyen Thi Kim Chuong, 1990; CSIC, 1998).
3. The results of erosion potential classification
- Based on Binh Dinh profile’s file (Vietnam Association of Soil Sciences, 1997),
values of K for 117 hill soil profiles throughout the province has been calculated. It is
found that there is a very clear split of the erodability factor among different soil types.
Consequently, to have a general remark on the soil erosive characteristics and to take
advantage in the future research, we grouped the profiles of each soil types, and then
put soil types into groups, and finally arranged these groups according to their erosive
characteristics (soil types had nearly equal K values). The results are shown in Table 1.
- The results of calculating average values of the factors participated in flow
energy analysis and average values of Y for river basins are shown in tables 2 and 3.
Luong Thi Van
VNU. Journal of Science, Earth Sciences, T.XXIII, N
0
1, 2007
40
- The coefficients depending on the erosive characteristics 1, 2, 3, 4 of the
correspondent soil group are populated to the soil map. This map is then overlaid with
FE map of the province. And finally, the product of them is the value of erosion
potential for all pixels of the four basins.
Table 1.
K
values of main soil groups and classification by erosive characteristics
No
Type of mountain soil Symbology
Number
of
profiles
K
Average
K
Classification by
erosive
characteristics
(
K
)
Erodability
factor
Acid aluvial soil Pc-h 3 0.116
Speck aluvial soil Pc-fe 3 0.156
1
Acid gley soil GLC-h 7 0.151
0.145 High 4
Symbolic gray soil Xh-a 29 0.106
Gley -gray soil Xg-g 14 0.114
Rockiness gray soil Xd-d 5 0.112
Feralit gray soil Xf-h 35 0.102
2
Mountain humus gray soil Xh-u 4 0.102
0.103 Rather high 3
Red cinanmonic soil Fd-h 4 0.100
Yellow cinamonic soil Fx-h 2 0.090
3
Shallow soil Ec-h 5 0.097
0.096 Normal 2
Curdle gray soil Xfe-h 4 0.044
4
Spotted gray soil Xl-a 2 0.028
0.038 Low 1
Table 2. Distribution of flow energy (
Y
) at river basins in Binh Dinh Province (unit: %)
Y level
Total in
province
At Lai River
Basin
At Kon River
Basin
At La Tinh River
Basin
At Ha Thanh
River Basin
<100 44.7 35.5 42.1 65.6 45.4
100- 400 32.5 33.2 32.9 26.1 37.4
> 400 22.8 31.3 25.0 8.3 17.2
Total 100.0 100.0 100.0 100.0 100.0
Table 3. Average values (AV) of factors and average values of flow energy at river basins in Binh Dinh Province
Slope (degree)
Height (m) Height difference
Rainfall (mm) Flow energy (Y) AV
Basins
I PS H PS
∆
h
PS P PS Y PS
Lai Giang 15.21
7.46
334.5
215.81
276.04
209.84
2001.7
327.96
409.03
292.26
Kon River 12.89
7.66
457.1
284.05
345.82
235.41
2049.0
381.20
354.48
263.43
La Tinh 10.99
6.66
203.6
168.72
170.0
168.11
1873.4
55.23
202.17
175.67
Ha Thanh 15.77
7.09
387.1
215.94
258.62
191.49
1896.1
61.43
302.48
179.19
Determining flow energy and erosion coefficient
VNU. Journal of Science, Earth Sciences, T.XXIII, N
0
1, 2007
41
Because of the values M of erosion potential (EP) was computed throughout the
province, we can reclassify them into 59 groups at range of 100: group 1 has M<100,
group 2: from 200 to 300, group 59: from 5800 to 5900). The reclassification was
carried out for upstream protection land (UPL), production forest land (PFL),
convertible land (CL), cultivated land and plain as shown in Table 4.
The results show that high erosion potential mainly distributes on the
convertible land, the upstream protection land, and the production forest land.
However, we have only researched and categorized the erosion potential in Binh Dinh
Province with the purpose of protecting the cultivated land on the slope area.
Consequently, we have not categorized the erosion potential of the upstream protection
land and the production forest land, but we have only considered these levels to
categorize the erosion potential of the convertible land area in Binh Dinh (in reality,
the upstream protection land and the production forest land had been planned for
growing forests, so there is no need to take into consideration the means of cultivated
slope soil).
The total area of the convertible land in Binh Dinh is rather high (90.685
hectares, about 14.7% in total area of natural land and 22.2% in area of the hill land).
This area is capable of developing agriculture or silviculture or their combination, that
has been principally distributed in the first seven groups with the erosion potential
M<700. The first three groups take a large area and they are distributed quite equally,
the rest four own unremarkable area, the total of which is much less than that of groups
1, 2 and 3. We also find that if total area of the last four groups is added into group 3
then we will have an equivalent area to group 2. Therefore, we have arranged three
groups of the convertible land equivalent to three levels of the erosion potential in Binh
Dinh Province as bellows:
+ Group 1 of the convertible land is equivalent to the level 1 of the erosion
potential: consists of soil with erosion potential M <100 and has total area of 39.307
hectares (43.4% in the convertible land). This group has low centralization level of
convertible land and low erosion potential level.
+ Group 2 of the convertible land is equivalent to the level 2 of the erosion
potential: consists of soil with erosion potential from 100-200 and has area of 25.690
hectares (28.3% of the convertible land). This group has average centralization level of
convertible land and average erosion potential level.
+ Group 3 of the convertible land is equivalent to the level 3 of the erosion
potential: consists of soil with erosion potential from 200-700 and has area of 25,669
hectares (28.3% of the convertible land). This group has high centralization level of the
convertible land and high erosion potential level.
Luong Thi Van
VNU. Journal of Science, Earth Sciences, T.XXIII, N
0
1, 2007
42
Table 4. Statistics of the potentially erosive area according to the General plan of Binh Dinh Province
No
Erosion potential
levels (M)
Total Plain land
Convertible
land
Production
forest land
Low
critical
High
critical
Total
602555
200148
90387
91563
41365
178573
1 <100 244664.75 205248.75 39306.75 55.50 6.75 47.00
2 100-200 27364.25 378.00 25689.75 1296.50 0.00 0.00
3 200-300 29438.25 149.00 22225.75 7012.50 51.00 0.00
4 300-400 32406.75 74.50 3024.50 29165.50 62.00 80.25
5 400-500 34900.75 49.75 338.50 34449.00 0.00 63.50
6 500-600 35586.50 37.75 78.25 18804.00 16637.00 29.00
7 600-700 34220.00 18.75 21.25 295.25 24255.25 9629.50
8 700-800 31031.00 25.25 0.00 241.25 13.25 30751.25
9 800-900 26768.50 19.00 0.00 84.00 129.00 26536.50
10 900-1000 22124.00 18.75 0.00 17.75 159.25 21928.25
11 1000-1100 17743.75 17.25 0.00 4.00 30.50 17692.00
12 1100-1200 13924.25 15.75 0.00 0.00 10.25 13898.25
13 1200-1300 10912.25 10.75 0.00 0.00 10.00 10891.50
14 1300-1400 8533.25 6.00 0.00 0.00 0.75 8526.50
15 1400-1500 6922.75 4.00 0.00 0.00 0.00 6918.75
16 1500-1600 5712.25 4.50 0.00 0.00 0.00 5707.75
17 1600-1700 4713.75 2.75 0.00 0.00 0.00 4711.00
18 1700-1800 3978.50 1.50 0.00 0.00 0.00 3977.00
19 1800-1900 3257.75 1.75 0.00 0.00 0.00 3256.00
20 1900-2000 2749.00 1.50 0.00 0.00 0.00 2747.50
21 2000-2100 2232.25 0.00 0.00 0.00 0.00 2232.25
22 2100-2200 1831.50 2.50 0.00 0.00 0.00 1829.00
23 2200-2300 1479.75 0.75 0.00 0.00 0.00 1479.00
24 2300-2400 1202.00 0.00 0.00 0.00 0.00 1202.00
25 2400-2500 1003.25 0.50 0.00 0.00 0.00 1002.75
26 2500-2600 778.75 0.00 0.00 0.00 0.00 778.75
27 2600-2700 621.00 0.00 0.00 0.00 0.00 621.00
28 2700-2800 463.00 0.00 0.00 0.00 0.00 463.00
29 2800-2900 372.00 0.00 0.00 0.00 0.00 372.00
30 2900-3000 294.25 0.00 0.00 0.00 0.00 294.25
31 3000-3100 252.75 0.00 0.00 0.00 0.00 252.75
32 3100-3200 193.25 0.00 0.00 0.00 0.00 193.25
33 3200-3300 155.25 0.00 0.00 0.00 0.00 155.25
34 3300-3400 127.00 0.00 0.00 0.00 0.00 127.00
35 3400-3500 94.25 0.00 0.00 0.00 0.00 94.25
36 3500-3600 77.50 0.00 0.00 0.00 0.00 77.50
37 3600-3700 63.75 0.00 0.00 0.00 0.00 63.75
38 3700-3800 54.50 0.00 0.00 0.00 0.00 54.50
39 3800-3900 47.25 0.00 0.00 0.00 0.00 47.25
40 3900-4000 34.25 0.00 0.00 0.00 0.00 34.25
41 4000-4100 28.50 0.00 0.00 0.00 0.00 28.50
42 4100-4200 21.50 0.00 0.00 0.00 0.00 21.50
43 4200-4300 22.25 0.00 0.00 0.00 0.00 22.25
44 4300-4400 17.00 0.00 0.00 0.00 0.00 17.00
45 4400-4500 14.25 0.00 0.00 0.00 0.00 14.25
46 4500-4600 9.00 0.00 0.00 0.00 0.00 9.00
47 4600-4700 11.75 0.00 0.00 0.00 0.00 11.75
48 4700-4800 9.00 0.00 0.00 0.00 0.00 9.00
49 4800-4900 7.00 0.00 0.00 0.00 0.00 7.00
50 4900-5000 6.00 0.00 0.00 0.00 0.00 6.00
51 5000-5100 3.50 0.00 0.00 0.00 0.00 3.50
52 5100-5200 4.75 0.00 0.00 0.00 0.00 4.75
53 5200-5300 4.00 0.00 0.00 0.00 0.00 4.00
54 5300-5400 2.00 0.00 0.00 0.00 0.00 2.00
55 5400-5500 3.25 0.00 0.00 0.00 0.00 3.25
56 5500-5600 1.25 0.00 0.00 0.00 0.00 1.25
57 5600-5700 0.50 0.00 0.00 0.00 0.00 0.50
58 5700-5800 0.50 0.00 0.00 0.00 0.00 0.50
59 5900-5900 0.50 0.00 0.00 0.00 0.00 0.50
Determining flow energy and erosion coefficient
VNU. Journal of Science, Earth Sciences, T.XXIII, N
0
1, 2007
43
Three levels of the erosion potential have been showed by a categorized map of
the erosion potential.
To propose plans, as well as to carry out concentrated and effective investment to
protect soil for the general fund of the cultivated land, we need to categorize the
erosion potential for administrative units at commune level. This categorization is
based on the erosion potential levels, especially the high erosion potential level (the
potential erosive level 2 and level 3). As for the villages whose area of the erosion
potential belongs to level 1 (the low erosion potential level), though that area is bigger
than the total area of the basin it is not as attentive as others with the low erosion
potential level. Even some communes with small area (about 200ha) but belong to the
high erosion potential level should be paid a special attention on the rational
cultivation methods on slope soil in order to protect soil, prevent erosion, and ensure
the capacity and rate of production.
Based on the magnitude of the high erosion potential level and its ratio to the
total area of the communes, we have had a two dimension statistical table (Table 4),
and taken the result of categorizing communes depending on the erosion potential
levels as shown in Table 5.
Table 5. The specific collection of disposing convertible land (EP
2
and EP
3
) in Binh Dinh Province at commune level
(%)
(hectare)
0-10
10-20
20-30
30-40
40-50
50-60
60-
70
70-80
80-90
90-100
Total of
village
<200 3 5 7 4 3 5 1 3 2 4 37
200- 400 1 2 3 1 3 3 4 3 20
400 - 600 1 1 1 1 4 1 9
600 - 800 1 6 3 1 11
800 - 1000 3 1 2 3 9
1000 - 1500 2 2 1 2 7
1500 - 2000 1 1 1 3
>2000 2 1 1 4
Total of communes
3 7 10 9 8 7 14 15 16 11 100/155
+ Group 1: <200ha, including 37 communes, which has the requirement of
cultivated land protection at level 1, get the total area of 3,260ha; taking 35.6% in the
total convertible land, and 6.5% in the EP
2
and EP
3
fund.
+ Group 2: >200ha and <60%, including 17 communes, which has the requirement
of cultivated land protection at level 2, get the total area of 10,317ha; taking 11.5% in
the total convertible land, and 19.7% in the EP
2
and EP
3
fund.
Luong Thi Van
VNU. Journal of Science, Earth Sciences, T.XXIII, N
0
1, 2007
44
+ Group 3: >200ha and >60%, including 46 communes, which has the requirement
of cultivated land protection at level 3, get the total area of 36,432ha; taking 41.6% in
the total, and 73.4% in the EP
2
and EP
3
fund).
References
[1] Center for Silviculture Information and Consultation - CSIC (1998), Report on
silviculture area for evaluation precaution requirement at the river upstreams in
Vietnam, Institute of Forest Research and Planning, Ministry of Agriculture and Rural
Development, 62 pp.
[2] Luong Thi Van, Application of systematic approach for evaluating precaution
requirement, soil protection, stream regulation at the upstream in Binh Dinh's
mountainous areas. The Scientific Bulletin of Quy Nhon Pedagogical University, No
12/20, pp. 114-119.
[3] Luong Thi Van (2001), Classifying erosion potential in Binh Dinh Province, The
Scientific Journal of Hue University, No 6/2001, pp. 125-131.
[4] Nguyen Thi Kim Chuong (1990), Introduction of some mathematical exercises employed
in researching the synthetic natural Geography. The Scientific Bulletin of Hanoi
Teacher Training University, No 1/1990, pp. 7-12.
[5] Nguyen Thi Kim Chuong, Luong Thi Van (2000), Precaution classification at river
upstreams in Binh Dinh Province. The Scientific Bulletin of Hanoi Teacher Training
University, No 4/2000, pp. 140-147.
[6] Nguyen Quang My (1992), Soil erosion and soil environment in Vietnam, Proceedings of
Scientific Seminar on Using Soil Resources Sensible for Developing and Protecting
Environment, Vietnam Association of Soil Sciences.
[7] Vietnam Association of Soil Sciences (1997), Soil profile's file of Binh Dinh Province, 528 pp.
VNU JOURNAL OF SCIENCE, Earth sciences, T.xxIII, N
0
1, 2007
38

