Poster luận văn thạc sĩ CHLB Đức
Bạn đang xem bản rút gọn của tài liệu. Xem và tải ngay bản đầy đủ của tài liệu tại đây (1.07 MB, 1 trang )
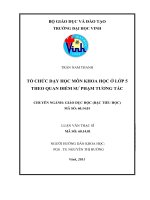
Nguyen Duc Viet, Water Resources Management , Vietnam
IMPROVEMENT OF WATER SUPPLY FOR AGRICULTURAL PRODUCTION THROUGH OPERATION AND MANAGEMENT BY CONSIDERING SALINITY INTRUSION ADAPTATION
CASE STUDY: TU CAU IRRIGATION SYSTEM, VU GIA_ THU BON RIVER BASIN, VIETNAM
Master Thesis (MSc)
Problem Statement & Goals
Currently, climate change is affecting more and more to human life. Viet Nam is one of the five countries forecasted to be affected seriously
by climate change, specifically the phenomenon of sea level rise and salinity intrusion.
The main objective is to enhance the water supply efficiency and to propose feasible measures to adapt climate change impacts for Tu Cau
irrigation system, Vu Gia - Thu Bon river basin through operation and management.
Methods
Statistics of rice cultivation area of years 2008, 2009, 2010 and 2011
1. Tu Cau irrigation system (pump units, intake, canals, etc)
6. Propose O&M models to adapt salinity intrusion
450
The Operation and Management (O&M)
400
424.330
Winter - spring crop area
391.200
Summer - Autumn crop area
350
measures are based on existing conditions
2. Assess the status of Tu Cau irrigation system under salinity
5. Concentrate on measures for Operation & Management
intrusion.
such as local reservoirs and tidal regime.
308.000
300.000
300
295.000
290.000
250
200
169.000
150
4. Identify causes of water shortage corresponding to salinity
3. Water balance calculations for agricultural production
175.000
intrusion.
100
50
Unit: ha
Oriented research
0
2008
2009
2010
2011
Application
Main causes
Water Balance Calculation
Some main causes of water supply shortage for Tu Cau irrigation system,
Soil cultivation
Discussions
Stage of rice
1. “Utilization of regulating reservoirs”
Meteorology
including:
Set up operating procedure to take water from Sen and Cung reservoirs to increase
CROPWAT 8.0
•Operation of Tu Cau pumping station is affected by salinity intrusion upon Vinh
water supply capacity Total water volume permitted to be pumped into the
η ST
Dien river;
‰
Irrigation area
Discharge pump
Coefficient of rice (q)
(ω)
(QP)
Days of salinity
λ
Discharge of water demand for rice
Discharge of water supply by Tu Cau Irr system
(QWD)
(QWSL)
Concentration of salt on July 2011 - 7.00AM
regulating reservoir:
Initial concentration
1‰
2‰
3.4‰
4.8‰
5.5‰
8.1‰
7
Concentration of salt
6
5
2
1.1
4
00.1
6 8
2.1
1.2
0.50.4
0.1
0 0
0 2
3.9
e
1
Low water discharge of Tu Cau Irr system
Days of rice stage
105,000
96,500
48,250
32,167
32,167
19,300
2. Operating the pumping station based on tide amplitude (Vtide)
(QWS)
5.2 4.8
Dat
2.4
2.3
3
Vrl (m )
4.6
3.2
3.4
2.1
6
5.2
4.3
3
•
5.2
5
4
1
6.3
2.3
2.5
3.2
2.5
Total volume of water shortage of Tu Cau Irr (V WS)
2.3
η ST
•
1.2
0.8‰
: Efficiency of canal system at Tu Cau irrigation systems;
•λ
Changing in O&M relating tide amplitude:
If salt concentration ≥ 0.8‰: “not pump and measure continuously salt
≥≥ 0.8‰
0.8‰
Measuring
Measuring of
of salt
salt
concentration”.
: The time percentage of Tu Cau pump station can operate under impact of
Salt
Salt concentration
concentration
concentration
concentration
If salt concentration < 0.8‰: running WXTide_32 version 4.7 software
1 hour
10 12 14 16 18 20 22 24 26 28 30 32
3
Actual discharge of one pump is about 66% (600m /h in comparison with original
developed by Dave Flater at Da Nang estuary:
salinity intrusion corresponding to each stage of rice.
3
design is 900m /h);
1 hour
1 hour
<< 0.8‰
0.8‰
If the tide is up, “stop pumping and measure continuously”;
If the tide is down, pump immediately, during pumping, measure
Last point
<< 0.8‰
0.8‰
continuously salt concentration 30 minutes/ time. If >0.8‰, immediately
•Tu Cau pumping station is only operational when salt concentration below 0.8‰.
stop pumping.
2700
2,400.00
2400
2,400.00
2,400.00
2100
1,762.36
1800
1,762.36
1,762.36
QWD
Qwsl
1,650.00
1,733.28
Pump
Pump
Results
Test water sample
30 minutes
Test water sample
30 minutes
1,600.08
1500
240000
1200
900
≥ 0.8‰
600
505.60
534.49
505.60
534.49
Salt concentration
concentration
≥ 0.8‰
1 hour
1 hour
211,700
200000
300
Measuring of salt
220,200
220000
Total water storage volume after changing O&M
Total
Total
volume of water shortage in the Summer – Autumn crop, 2011
Vlw
218.16
0
180000
167,022
163,450
1 hour
Case 1
< 0.8‰
•The total volume of water shortage at Tu Cau irrigation system as below:
Case 2
VWS = 22 * 24 * 316.33 = 167,022.24 m
Test water sample
< 0.8‰
3
160000
147,367
147,367
134,500
140000
120000
Pump
Test water sample
Test water sample
1 hour
1 hour
www.termavn-master.info
Supervisors
Pro. Dr. Sabine Schlüter
Dr. Phong Nguyen Tung
Project Partners
Supported by