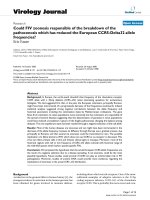
Duncan the new depression; the breakdown of the paper money economy (2012)
Bạn đang xem bản rút gọn của tài liệu. Xem và tải ngay bản đầy đủ của tài liệu tại đây (2.32 MB, 180 trang )
The New Depression
ffirs.indd i
09/02/12 2:06 PM
The New Depression
The Breakdown of the Paper
Money Economy
RICHARD DUNCAN
John Wiley & Sons Singapore Pte. Ltd.
ffirs.indd iii
09/02/12 2:06 PM
Copyright © 2012 Richard Duncan.
Published in 2012 by John Wiley & Sons Singapore Pte. Ltd. 1 Fusionopolis Walk,
#07–01, Solaris South Tower, Singapore 138628
All rights reserved.
No part of this publication may be reproduced, stored in a retrieval system, or transmitted
in any form or by any means, electronic, mechanical, photocopying, recording, scanning,
or otherwise, except as expressly permitted by law, without either the prior written permission of the Publisher, or authorization through payment of the appropriate photocopy
fee to the Copyright Clearance Center. Requests for permission should be addressed to
the Publisher, John Wiley & Sons Singapore Pte. Ltd., 1 Fusionopolis Walk, #07–01, Solaris
South Tower, Singapore 138628, tel: 65–6643–8000, fax: 65–6643–8008, e-mail: enquiry@
wiley.com.
This publication is designed to provide accurate and authoritative information in regard
to the subject matter covered. It is sold with the understanding that the Publisher is not
engaged in rendering professional services. If professional advice or other expert assistance is required, the services of a competent professional person should be sought.
Neither the author nor the Publisher is liable for any actions prompted or caused by the
information presented in this book. Any views expressed herein are those of the author
and do not represent the views of the organizations he works for.
Oth er Wiley Editorial Offi ces
John Wiley & Sons, 111 River Street, Hoboken, NJ 07030, USA
John Wiley & Sons, The Atrium, Southern Gate, Chichester, West Sussex, P019 8SQ,
United Kingdom
John Wiley & Sons (Canada) Ltd., 5353 Dundas Street West, Suite 400, Toronto, Ontario,
M9B 6HB, Canada
John Wiley & Sons Australia Ltd., 42 McDougall Street, Milton, Queensland 4064,
Australia
Wiley-VCH, Boschstrasse 12, D-69469 Weinheim, Germany
ISBN
ISBN
ISBN
ISBN
978–1–118–15779–4
978–1–118–15780–0
978–1–118–15781–7
978–1–118–15782–4
(Hardback)
(ePDF)
(Mobi)
(ePub)
Typeset in 10/12pt, ITC Garamond by MPS Limited, Chennai, India
Printed in Singapore by Markono Print Media
10 9 8 7 6 5 4 3 2 1
ffirs.indd iv
09/02/12 2:06 PM
Contents
Preface
CHAPTER 1
CHAPTER 2
ix
How Credit Slipped Its Leash
1
Opening Pandora’s Box
Constraints on the Fed and on Paper Money Creation
Fractional Reserve Banking Run Amok
Fractional Reserve Banking
Commercial Banks
The Broader Credit Market: Too Many Lenders,
Not Enough Reserves
Credit without Reserves
The Flow of Funds
The Rest of the World
Notes
1
3
5
5
7
10
12
13
15
15
The Global Money Glut
17
The Financial Account
How It Works
What Percentage of Total Foreign Exchange
Reserves Are Dollars?
What to Do with So Many Dollars?
What about the Remaining $2.8 Trillion?
Debunking the Global Savings Glut Theory
Will China Dump Its Dollars?
Notes
18
20
23
24
26
28
31
32
v
ftoc.indd v
10/02/12 12:15 PM
vi
CHAPTER 3
CHAPTER 4
CHAPTER 5
CHAPTER 6
ftoc.indd vi
Contents
Creditopia
33
Who Borrowed the Money?
Impact on the Economy
Net Worth
Profits
Tax Revenue
Different, Not Just More
Impact on Capital
Conclusion
Note
33
38
39
41
41
41
45
49
49
The Quantity Theory of Credit
51
The Quantity Theory of Money
The Rise and Fall of Monetarism
The Quantity Theory of Credit
Credit and Inflation
Conclusion
Notes
52
55
57
59
60
61
The Policy Response: Perpetuating the Boom
63
The Credit Cycle
How Have They Done so Far?
Monetary Omnipotence and the Limits Thereof
The Balance Sheet of the Federal Reserve
Quantitative Easing: Round One
What Did QE1 Accomplish?
Quantitative Easing: Round Two
Monetizing the Debt
The Role of the Trade Deficit
Diminishing Returns
The Other Money Makers
Notes
64
65
66
67
69
71
72
73
75
76
78
83
Where Are We Now?
85
How Bad so Far?
Credit Growth Drove Economic Growth
85
86
10/02/12 12:15 PM
vii
Contents
CHAPTER 7
CHAPTER 8
CHAPTER 9
ftoc.indd vii
So, Where Does that Leave Us?
Why Can’t TCMD Grow?
The Banking Industry: Why Still Too
Big to Fail?
Global Imbalances: Still Unresolved
Vision and Leadership Are Still Lacking
Notes
88
89
96
101
104
105
How It Plays Out
107
The Business Cycle
Debt: Public and Private
2011: The Starting Point
2012: Expect QE3
Impact on Asset Prices
2013–2014: Three Scenarios
Impact on Asset Prices
Conclusion
Notes
107
109
111
112
114
114
118
119
120
Disaster Scenarios
121
The Last Great Depression
And This Time?
Banking Crisis
Protectionism
Geopolitical Consequences
Conclusion
Note
121
126
126
127
128
132
132
The Policy Options
133
Capitalism and the Laissez-Faire Method
The State of Government Finances
The Government’s Options
American Solar
Conclusion
Notes
134
140
142
143
146
147
10/02/12 12:15 PM
viii
CHAPTER 10
ftoc.indd viii
Contents
Fire and Ice, Inflation and Deflation
149
Fire
Ice
Fisher’s Theory of Debt-Deflation
Winners and Losers
Ice Storm
Fire Storm
Wealth Preservation through Diversification
Other Observations Concerning Asset Prices in the
Age of Paper Money
Protectionism and Inflation
Consequences of Regulating Derivatives
Conclusion
Notes
150
151
152
155
157
157
158
160
165
166
166
167
Conclusion
169
About the Author
171
Index
173
10/02/12 12:15 PM
Preface
W
hen the United States removed the gold backing from the dollar
in 1968, the nature of money changed. The result was a proliferation of credit that not only transformed the size and structure of the U.S.
economy but also brought about a transformation of the economic system
itself. The production process ceased to be driven by saving and investment
as it had been since before the Industrial Revolution. Instead, borrowing and
consumption began to drive the economic dynamic. Credit creation replaced
capital accumulation as the vital force in the economic system.
Credit expanded 50 times between 1964 and 2007. So long as it
expanded, prosperity increased. Asset prices rose. Jobs were created. Profits
soared. Then, in 2008, credit began to contract, and the economic system
that was founded on and sustained by credit was hurled into crisis. It was
then that the New Depression began.
There is a grave danger that the credit-based economic paradigm that
has shaped the global economy for more than a generation will now
collapse. The inability of the private sector to bear any additional debt
strongly suggests that this paradigm has reached and exceeded its capacity
to generate growth through further credit expansion. If credit contracts
significantly and debt deflation takes hold, this economic system will break
down in a scenario resembling the 1930s, a decade that began in economic
disaster and ended in geopolitical catastrophe.
This book sets out to provide a comprehensive explanation of this
crisis. It begins by explaining the developments that allowed credit in the
United States to expand 50 times in less than 50 years. Chapter 1, How
Credit Slipped Its Leash, looks at the domestic causes. Chapter 2, The
Global Money Glut, describes the foreign causes, debunking Fed Chairman
Bernanke’s global savings glut theory along the way. Chapter 3, Creditopia,
discusses how $50 trillion of credit transformed the U.S. economy.
Chapter 4, The Quantity Theory of Credit is introduced. This theory
explains the relationship between credit and economic output. Therefore,
it is an indispensible tool for understanding every aspect of this creditinduced calamity: its causes, the government’s response to the crisis, and
its probable evolution over the years ahead.
ix
fpref.indd ix
15/06/12 12:09 PM
x
Preface
Chapter 5, Perpetuating the Boom, explains the government’s policy
response to the crisis. When seen through the framework of the quantity
theory of credit, the rationale for the stimulus packages, the bank bailouts,
and the multiple rounds of quantitative easing becomes obvious: the
government is desperate to prevent credit from contracting.
Chapter 6, Where Are We Now?, takes stock of the current state of the
economy. It looks at each sector of the U.S. economy to determine which
ones, if any, can expand their debt further. Economic growth has come
to depend on credit expansion. Therefore, if none of the major sectors is
capable of taking on more debt, the economy cannot grow. This chapter
also considers whether any of the imbalances and mistakes that led to this
systemic crisis has yet been eliminated.
Chapter 7, How It Plays Out, presents scenarios of how events are
most likely to evolve between the end of 2011 and the end of 2014, along
with a discussion of how asset prices would be impacted under each
scenario. Chapter 8, Disaster Scenarios, describes how bad things could
become if the United States’ credit-based economic system breaks down
altogether. Its purpose is to make clear just how high the stakes really are,
in the belief—the hope—that nothing focuses the mind like the hangman’s
noose.
Chapter 9, The Policy Options, discusses the novel and unappreciated
possibilities inherent in an economic system built on credit and dependent on credit expansion for its survival. This crisis came about because
the credit that has been extended was primarily wasted on consumption.
Disaster may be averted if the United States now borrows to invest.
The final chapter, Fire and Ice, explains that the U.S. economy could
experience high rates of inflation, severe deflation, or both as this crisis
unfolds during the years ahead; and it discusses how stocks, bonds,
commodities, and currencies would be affected under each scenario. In this
post-capitalist age of paper money, government policy will determine the
direction in which asset prices move.
The New Depression has not yet become the New Great Depression.
Tragically, the odds are increasing that it will. Fiat money has a long and
ignoble history of generating economic calamities. The price the United
States ultimately pays for abandoning sound money may be devastatingly
high, both economically and politically.
fpref.indd x
15/06/12 12:09 PM
The New Depression: The Breakdown of the Paper Money Economy
By Richard Duncan
Copyright © 2012 Richard Duncan
CHAPTER
1
How Credit Slipped Its Leash
Irredeemable paper money has almost invariably proved a curse to the
country employing it.
—Irving Fisher1
C
redit-induced boom and bust cycles are not new. What makes this one
so extraordinary is the magnitude of the credit expansion that fed it.
Throughout most of the twentieth century, two important constraints limited
how much credit could be created in the United States. The legal requirement that the Federal Reserve hold gold to back the paper currency it issued
was the first. The legal requirement that commercial banks hold liquidity
reserves to back their deposits was the second. This chapter describes how
those constraints were removed, allowing credit to expand to an extent that
economists of earlier generations would have found inconceivable.
Opening Pandora’s Box
In February 1968, President Lyndon Johnson asked Congress to end the
requirement that dollars be backed by gold. He said:
The gold reserve requirement against Federal Reserve notes is not
needed to tell us what prudent monetary policy should be—that myth
was destroyed long ago.
It is not needed to give value to the dollar—that value derives from
our productive economy.2
The following month Congress complied.
1
c01.indd 1
10/02/12 8:30 AM
2
The New Depression
EXHIBIT 1.1 Money, Credit, and GDP
60,000
Credit: Up 50 Times in 43 Years
50,000
$ billions
40,000
30,000
20,000
10,000
1959
1961
1963
1965
1967
1969
1971
1973
1975
1977
1979
1981
1983
1985
1987
1989
1991
1993
1995
1997
1999
2001
2003
2005
2007
2009
0
Monetary Gold
GDP
M2 Money Supply
Total Credit
Source: Federal Reserve
That decision fundamentally altered the nature of money in the United
States and permitted an unprecedented proliferation of credit. Exhibit 1.1
dramatically illustrates what has occurred.
The monetary gold line at the bottom of the chart represents the gold
held within the banking system. It peaked at $19 billion in 1959 and afterward contracted to $10 billion by 1971. M2 represents the money supply
as defined as currency held by the public, bank liquidity reserves, and
deposits at commercial banks. The top line represents total credit in the
country.
It is immediately apparent that credit expanded dramatically both
in absolute terms and relative to gold in the banking system and to
the money supply. In 1968, the ratio of credit to gold was 128 times
and the ratio of credit to the money supply was 2.4 times. By 2007,
those ratios had expanded to more than 4,000 times and 6.6 times,
respectively. Notice, also, the extraordinary expansion of the ratio of
credit to GDP. In 1968, credit exceeded GDP by 1.5 times. In 2007,
the amount of credit in the economy had grown to 3.4 times total economic output.
Total credit in the United States surpassed $1 trillion for the first time
in 1964. Over the following 43 years, it increased 50 times to $50 trillion in
2007. That explosion of credit changed the world.
c01.indd 2
10/02/12 8:30 AM
How Credit Slipped Its Leash
3
Constraints on the Fed and on Paper Money Creation
The Federal Reserve Act of 1913 created the Federal Reserve System and
gave it the power to issue Federal Reserve Notes (i.e., paper currency).
However, that Act required the Fed to hold “reserves in gold of not less than
forty per centum against its Federal Reserve notes in actual circulation.”3
In other words, the central bank was required to hold 40 cents worth of gold
for each paper dollar it issued. In 1945, Congress reduced that ratio from
40 percent to 25 percent.
So much gold had flowed into U.S. banks during the second half of
the 1930s as the result of political instability in Europe that the Federal
Reserve had no difficulty meeting the required ratio of gold to currency
for decades. In fact, in 1949, it held nearly enough gold to fully back every
Federal Reserve note in circulation.
During the 1950s and 1960s, however, the amount of gold held by the
Fed declined. From a peak of $24.4 billion in 1949, the Fed’s gold holdings fell to $19.4 billion in 1959 and to only $10.3 billion in 1968. Moreover,
not only was the gold stock contracting, the currency in circulating was
increasing at a significantly faster pace. During the 1950s, currency in circulation grew at an average rate of 1.5 percent a year, but by an average of
4.7 percent a year during the 1960s.
In 1968, the ratio of the Fed’s gold to currency in circulation declined to
25 percent (as shown in Exhibit 1.2), the level it was required to maintain
by law. At that point, Congress, at the urging of President Johnson, removed
that binding constraint entirely with the passage of the Gold Reserve
Requirement Elimination Act of 1968. Afterward, the Fed was no longer
required to hold any gold to back its Federal Reserve notes. Had the law
not changed, either the Fed would have had to stop issuing new paper
currency or else it would have had to acquire more gold.
Once dollars were no longer backed by gold, the nature of money
changed. The worth of the currency in circulation was no longer derived
from a real asset with intrinsic value. In other words, it was no longer
commodity money. It had become fiat money—that is, it was money only
because the government said it was money. There was no constraint on
how much money of this kind the government could create. And, in the
years that followed, the fiat money supply exploded.
Between 1968 and 2010, the Fed increased the number of these paper
dollars in circulation by 20 times by printing $886 billion worth of new
Federal Reserve notes. (See Exhibit 1.3.) (Its gold holdings now amount to
the equivalent of 1 percent of the Federal Reserves notes in circulation.)
Although this new paper money was no longer backed by gold (or by
anything at all), it still served as the foundation upon which new credit could
be created by the banking system. Fifty trillion dollars worth of credit could not
have been erected on the 1968 base of 44 billion gold-backed dollars.
c01.indd 3
10/02/12 8:30 AM
4
The New Depression
EXHIBIT 1.2 The Ratio of the Fed’s Gold Holdings to Currency Outside Banks
120%
100%
In 1968, the ratio of the Fed's gold to currency outside banks
declined to 25% the legal minimun it was required to maintain.
Congress changed the law.
80%
60%
40%
20%
1945
1947
1949
1951
1953
1955
1957
1959
1961
1963
1965
1967
1969
1971
1973
1975
1977
1979
1981
1983
1985
1987
1989
1991
1993
1995
1997
1999
2001
2003
2005
2007
2009
0%
Source: Federal Reserve, Flow of Funds
EXHIBIT 1.3 Currency Outside Banks
Between 1968 and June 2010, the Fed issued an additional $886 billion in currency,
20 times the amount that had been in issue in 1968.
1,000
900
800
$ billions
700
600
500
400
300
200
100
1945
1947
1949
1951
1953
1955
1957
1959
1961
1963
1965
1967
1969
1971
1973
1975
1977
1979
1981
1983
1985
1987
1989
1991
1993
1995
1997
1999
2001
2003
2005
2007
2009
0
Source: Federal Reserve, Flow of Funds
c01.indd 4
10/02/12 8:30 AM
How Credit Slipped Its Leash
5
Fractional Reserve Banking Run Amok
The other constraint on credit creation at the time the Federal Reserve
was established was the requirement that banks hold reserves to ensure
they would have sufficient liquidity to repay their customers’ deposits on
demand. The Federal Reserve Act specified that banks must hold such
reserves either in their own vaults or else as deposits at the Federal Reserve.
The global economic crisis came about because, over time, regulators
lowered the amount of reserves the financial system was required to hold
until they were so small that they provided next to no constraint on the
amount of credit the system could create. The money multiplier expanded
toward infinity. A proliferation of credit created an economic boom that
transformed not only the size and composition of the U.S. economy but
also the size and composition of the global economy. The collapse came
when the borrowers became too heavily indebted to repay what they had
borrowed.
By 2007, the reserves ratio of the financial system as a whole had
become so small that the amount of credit that the system created was far
beyond anything the world had experienced before. By the turn of the
century, the reserve requirement played practically no role whatsoever in
constraining credit creation. This came about due to two changes in the
regulation of the financial industry. The first was a reduction of the amount
of reserves that banks were required to hold. The second was regulatory
approval that allowed new types of creditors to enter the industry with little
to no mandatory reserve requirements whatsoever. The following pages
describe this evolution of the U.S. financial industry.
In order to understand how reserve requirements limited credit creation,
it is first necessary to understand how credit is created through Fractional
Reserve Banking.
Fractional Reserve Banking
Most banks around the world accept deposits, set aside a part of those
deposits as reserves, and lend out the rest. Banks hold reserves to ensure
they have sufficient funds available to repay their customers’ deposits
upon demand. To fail to do so could result in a bank run and possibly the
failure of the bank. In some countries, banks are legally bound to hold
such reserves, while in others they are not. A banking system in which
banks do not maintain 100 percent reserves for their deposits is known
as a system of fractional reserve banking. In such a system, by lending
a multiple of the reserves they keep on hand, banks are said to create
deposits.
c01.indd 5
10/02/12 8:30 AM
6
The New Depression
The following example illustrates how the process of deposit creation
occurs. In this example, it is assumed that the country in which the banking
system operates is on a gold standard, and that banks in that country are
required to hold a level of gold reserves equivalent to 20 percent of their
deposits.
The process begins when Bank A accepts a deposit of $100 worth of
gold. To meet the 20 percent reserve requirement, it sets aside $20 in gold
as reserves. It then lends out the remaining $80. The recipient of the loan
deposits the $80 into his bank, Bank B. Bank B sets aside 20 percent of the
$80, or $16 worth of gold, as reserves. It lends out $64, which ends up in
Bank C. This process occurs again and again (see Exhibit 1.4). Therefore, an
initial deposit of $100 worth of gold, through the magic of fractional reserve
banking, eventually leaves the banking system with $500 of deposits and
$400 of credit, while an amount equivalent to the initial deposit is set aside
as $100 worth of reserves. The balance sheet of the banking sector would
show assets of $500, made up of $400 in loans plus $100 in reserves; and it
would show liabilities of $500 made up entirely of deposits.
EXHIBIT 1.4 “Money Creation” through Fractional Reserve Banking
Assuming:
An initial deposit of $100 of gold
A Reserve Ratio of 20%
Round
Round
Round
Round
Round
Round
Round
Round
Round
Round
Round
Round
Round
Round
Total
c01.indd 6
1
2
3
4
5
6
7
8
9
10
11
12
30
31
Deposits
Reserves
Loans
100
80
64
51
41
33
26
21
17
13
11
9
0.2
0.1
20
16
13
10
8
7
5
4
3
3
2
2
0.0
0.0
80
64
51
41
33
26
21
17
13
11
9
7
0.1
0.1
500
100
400
10/02/12 8:30 AM
How Credit Slipped Its Leash
7
In the real world, there are a number of other factors that would have
to be taken into consideration. Nevertheless, this simplified example is
sufficient to demonstrate the process of deposit creation.
There are two important points to grasp here. First, fractional reserve
banking creates credit as well deposits. In the previous example, $400
worth of credit was created by the banking system. Second, the reserve
ratio is the factor that determines the maximum amount of deposits (and
credit) that can be created. In this example, at the end of the process, there
are $500 of deposits, or five times the amount of gold initially deposited,
and $400 of credit that did not exist before. The inverse of the reserve
requirement is known as the money multiplier. Here, the money multiplier
is 1/20 percent or 5 times. If the reserve requirement had been 10 percent,
the banking system would have ended up with $1,000 of deposits, or 10
times the amount of gold initially deposited, and $900 of new credit. In that
case the money multiplier would be 10.
Now consider the reduction of the reserve requirements of the
commercial banks.
Commercial Banks
Commercial banking was a straightforward business after the passage of
the Glass–Steagall Act separated commercial banking from investment
banking in 1933. Banks took deposits and used them to make loans; and
the banks were required to hold reserves with the central bank to ensure
they would have sufficient liquidity to repay deposits to their customers
upon demand. In 1945, deposits supplied 98 percent of the banks’ funding. The legal reserve requirement was 20 percent for demand deposits (which accounted for 76 percent of funding) and 6 percent for time
deposits (22 percent of funding). Those reserve requirements could be
met by a combination of cash held in the banks’ vaults and reserves
deposited with the central bank.4 (Note: The Reserve requirement on
demand deposits for country banks was lower, 14 percent.)
Over time, banks began to rely more heavily on time deposits, which
required fewer reserves. By 2007, demand deposits amounted to only
6 percent of commercial banks’ funding. Time deposits had increased
to 57 percent of funding. This alone significantly reduced the amount
of money that banks had to keep as reserves. In addition to accepting
deposits, the banks had begun to raise funds by selling commercial paper
and bonds, as well as by borrowing in the repo market. In 2007, 12 percent
of the banks’ funding came from issuing credit market instruments,
8 percent from the repo market, and 17 percent from miscellaneous
c01.indd 7
10/02/12 8:30 AM
8
The New Depression
liabilities. They were not required to set aside any reserves against those
types of liabilities.
Furthermore, over the decades, the Fed had also repeatedly lowered the
amount of reserves that banks were required to hold against both demand
and time deposits. Currently, reserve requirements are set out as follows:
■
■
■
For net transactions accounts of less than $10.7 million, 0 percent
For those between $10.7 and $58.8 million, 3 percent
For those greater than $58.8 million, 10 percent
No reserves are required for nonpersonal time deposits.5 Combined, these
developments left the banks with a level of reserves so small as to be
practically meaningless when the crisis of 2008 occurred.
In 1945, commercial banks had held reserves and vault cash of $17.8
billion, the equivalent of 12 percent of their total assets, at a time when
64 percent of their assets were (very low risk) U.S. government bonds. By
2007, the banks’ reserves and vault cash had tripled to $73.2 billion, but
their assets had increased by 82 times to $11.9 trillion. That put the liquidity
ratio at 0.6 percent.
The amount of reserves the banks held at the Fed was only $2 billion
larger in 2007 than it had been in 1945; and almost all the increase in vault
cash resulted from the cash held in the “vaults” of the banks’ automatic
teller machines. (See Exhibit 1.5.)
EXHIBIT 1.5 Commercial Bank’s Reserves at the Federal Reserve, 1945 to 2007
50
45
40
$ billions
35
30
25
20
15
10
5
1945
1947
1949
1951
1953
1955
1957
1959
1961
1963
1965
1967
1969
1971
1973
1975
1977
1979
1981
1983
1985
1987
1989
1991
1993
1995
1997
1999
2001
2003
2005
2007
0
Source: Federal Reserve, Flow of Funds
c01.indd 8
10/02/12 8:30 AM
How Credit Slipped Its Leash
9
Beginning in 1988, banks were required to maintain a capital adequacy ratio (CAR) of 8 percent. The “capital” supplying the banks’ capital
adequacy was not a pool of liquid assets, however. It was essentially just a
bookkeeping entry representing the difference between the banks’ assets
and liabilities. The capital was put to work by the banks, either being
extended as loans or else invested in credit instruments. Since the capital
could be used to make loans, it did not constrain credit creation the way
liquidity reserves (held as physical cash or separated and held on deposit
at the central bank) had done. Moreover, as described next, although the
quantity of the industry’s capital increased over time, the quality of that
capital deteriorated sharply.
The Fed justified reducing the banks’ reserves requirements on the
grounds that they were no longer necessary because the Fed itself would
always be able to provide liquidity support to any bank that required
short-term funding. Clearly, the Fed did not understand the consequences
of its actions. By reducing the banks’ reserve requirements, the Fed
enabled the commercial banks to create much more credit than otherwise would have been possible. The ratio of commercial bank assets to
reserves and vault cash exploded from 8 times in 1945 to 162 times in
2007. Conversely, the ratio of their reserves and vault cash to liabilities
plummeted. (See Exhibit 1.6.) In the end, when the crisis came, the Fed
did provide the banks with the liquidity they required. But to do so, it had
to create $1.7 trillion of new fiat money, an amount equivalent to 12 percent
of the U.S. GDP. That rescue operation became known as quantitative easing,
round one (QE1). It will be described in greater detail in Chapter 5.
EXHIBIT 1.6 Commercial Banks’ Vault Cash and Reserves to Total Liabilities, 1945 to 2007
20%
18%
16%
14%
12%
10%
8%
6%
4%
2%
1945
1947
1949
1951
1953
1955
1957
1959
1961
1963
1965
1967
1969
1971
1973
1975
1977
1979
1981
1983
1985
1987
1989
1991
1993
1995
1997
1999
2001
2003
2005
2007
0%
Source: Federal Reserve, Flow of Funds
c01.indd 9
10/02/12 8:30 AM
10
The New Depression
The Broader Credit Market: Too Many Lenders,
Not Enough Reserves
As the reserve requirements of the commercial banks fell and the money
multiplier expanded, credit creation through fractional reserve banking
exploded. But that is only part of the story. Starting in the 1970s, the structure of the financial system in the United States changed radically. Many
new types of credit providers emerged, and, in most cases, the new lending institutions were not subject to any reserve requirements whatsoever.
Exhibit 1.7 provides a snapshot of the country’s credit structure in
1945 and in 2007.
At the end of World War II, the credit structure of the United States
was simple and straightforward. It became vastly more complicated and
leveraged, however, as time went by and new kinds of financial entities
were permitted to extend credit.
In 1945, the household sector supplied 26 percent of the country’s credit.
Households had invested heavily in government bonds during the war.
The financial sector supplied 64 percent of all credit. At that time, commercial banks dominated the financial industry, providing 33 percent of all
the credit in the country. Life insurance companies supplied 12 percent of
total credit, and other savings institutions, such as thrifts and savings & loan
companies, accounted for a further 7 percent. These three sets of financial
EXHIBIT 1.7 Total Credit Market Debt Held by the Creditors
1945
To tal $ billio n s
$355
2007
$50,043
Ho useh o ld Secto r
26%
8%
Fin an cial Secto r
including:
Commercial banks
Life insurance companies
Savings institutions
GSEs & GSE-backed mortgages
Issuers of asset-backed securities
Money market funds
Mutual funds
Others financial sector
64%
73%
33%
12%
7%
1%
0%
0%
0%
11%
18%
6%
3%
15%
9%
4%
4%
14%
1%
15%
9%
100%
4%
100%
Rest o f th e Wo rld
Miscellaneous
Source: Federal Reserve, Flow of Funds
c01.indd 10
10/02/12 8:30 AM
11
How Credit Slipped Its Leash
institutions were all tightly regulated by the government in a way that ensured
their risks were limited and their liquidity was ample.
By 2007, the relative importance of each of those three groups had been
roughly cut in half. Of all the credit supplied in the country, commercial
banks provided 18 percent, life insurance companies provided 6 percent,
and the savings institutions provided 3 percent. New financial institutions
had emerged as important creditors, and they had eroded the market share
of the traditional lenders.
Fannie Mae, Freddie Mac, and other government-sponsored enterprises (GSEs) began growing aggressively during the 1980s. Their mission
was to make housing more affordable. To accomplish that mission, those
government-backed entities issued debt and used the proceeds to buy
mortgage loans from banks and other mortgage originators, who then had
the resources to extend more mortgages.
By 1985, the GSEs overtook life insurance companies as the third largest
credit provider within the financial sector. Five years later, they moved
into second place, overtaking the savings institutions. In 2002, they came
very close to overtaking commercial banks as well. In other words, they
came very close to being the largest suppliers of credit in the United
States. (See Exhibit 1.8.)
Issuers of asset-backed securities (ABSs) also became major credit
providers. ABS issuers acquired funding by selling bonds. They used the
EXHIBIT 1.8 The Suppliers of Credit from the Financial Sector
10,000
9,000
8,000
$ billions
7,000
6,000
5,000
4,000
3,000
2,000
1,000
1945
1947
1949
1951
1953
1955
1957
1959
1961
1963
1965
1967
1969
1971
1973
1975
1977
1979
1981
1983
1985
1987
1989
1991
1993
1995
1997
1999
2001
2003
2005
2007
0
Commercial banks
Issuers of ABS
Mutual funds
Savings institutions
GSEs plus mortgage pools backed by GSEs
Life insurance companies
Money market mutual funds
Source: Federal Reserve, Flow of Funds
c01.indd 11
10/02/12 8:30 AM
12
The New Depression
proceeds to buy mortgage loans, credit card loans, student loans, and
some other credit instruments, which they then bundled together in a variety
of ways and sold to investors as investment vehicles with different degrees of
credit risk. They were not significant players in the credit markets until
the second half of the 1980s. By 2007, however, ABS issuers supplied
12 percent of the credit provided by the financial sector or 9 percent of all
credit outstanding.
Mutual funds and money market funds had also come of age during
the 1980s, and by 2007, they provided 6 percent and 5 percent, respectively,
of all credit supplied by the financial sector.
Credit without Reserves
By 2007, the GSEs and the issuers of ABSs provided 24 percent of all the
credit in the country. Their rise made the financial system much more leveraged and complex than when it had been dominated by the commercial
banks. First of all, the GSEs and ABS issuers faced much lower capital
adequacy requirements than the traditional lenders. Banks and savings
institutions were required to maintain capital equivalent to 8 percent
of their assets—in other words, a CAR of 8 percent. Life insurance companies were also tightly regulated and made to keep large capital reserves.
Fannie and Freddie, however, were required to hold only 2.5 percent
capital against the mortgage loans held on their books and only 0.45
percent for the mortgages they had guaranteed. Fannie, for example, in
2007 had assets (mortgages and guarantees) valued at $2.9 trillion, but
shareholders’ funds (capital) of only $44 billion. Therefore, Fannie’s CAR
(equity to assets) was only 1.5 percent. Freddie’s was even less, 1.3 percent that year.
The case of the ABS issuers was similar. Generally, the issuers of
ABSs were special purpose vehicles (SPVs) that had been created for
the purpose of packaging and selling loans that had been originated by
commercial banks, investments banks, or corporations such as General
Electric and Chrysler. Moving assets into the SPVs reduced the amount
of capital the loan originators were required to hold, even though
quite often the originators remained the beneficial owners of the
SPVs. For example, holding mortgage-backed securities with AAA or AA
ratings required only 1.6 percent capital backing. And, generally, the
credit rating agencies were happy to provide such a rating—for a fee.
Therefore, ABS issuers held much lower CARs than the banks did.
More importantly, the GSEs and ABS issuers faced no liquidity reserve
requirements at all. They raised funding by issuing debt and, in the process
of issuing debt, they created credit. Fannie Mae and Freddie Mac alone
c01.indd 12
10/02/12 8:30 AM
How Credit Slipped Its Leash
13
owned nearly $5 trillion in mortgage assets at the end of 2007. They had
funded the purchases of those mortgages by issuing roughly $5 trillion in
Fannie and Freddie bonds, an amount equivalent in size to 10 percent of
the entire credit market.
Just as commercial banks created credit by making loans (through
the system of fractional reserves banking), the GSEs and ABS issuers also
created credit by extending credit—but with even less constraint because
they were not required to hold any liquidity reserves. Rather than remaining
a system of fractional reserve banking, the financial system of the United
States had evolved into one entirely unconstrained by reserve requirements.
Consequently, there was no limit as to how much credit that system could
create.
The events of 2008 brutally revealed the gross inadequacy of the
financial system’s capital and liquidity.
The Flow of Funds
The Fed’s Flow of Funds Accounts provides a near-comprehensive set
of information about the stock and flow of credit in the United States.
Because credit growth now drives economic growth, the flow of funds is
the key to understanding developments in the U.S. economy.
The Flow of Funds Accounts of the United States is published by the
Federal Reserves on its website each quarter at www.federalreserve.gov/
releases/z1/Current/z1.pdf.
Credit and debt are two sides of the same coin. One person’s debt is
another person’s asset. As of June 30, 2011, the total size of the U.S. credit
market was $52.6 trillion. Throughout this book, this figure is referred to
as total credit market debt, or TCMD.
Table L.1 of the Flow of Funds report, titled Credit Market Debt
Outstanding, is the summary table of TCMD. It provides a breakdown by
sector of (1) who owes the debt, “Total credit market debt owed by” and (2)
to whom the debt is owed, “Total credit market assets held by.”
The top half of Table L.1, the breakdown of who owes the debt, has
been provided as Exhibit 1.9. There are three major categories:
1. The domestic nonfinancial sectors
2. The rest of the world
3. The financial sectors
Note: Detailed information on each of these categories, as well as
details concerning who owns the debt, can be found in the other 144
tables spread across the Flow of Funds Accounts of the United States. All
c01.indd 13
10/02/12 8:30 AM
14
The New Depression
EXHIBIT 1.9 Credit Market Debt Outstanding
L.1 Credit Market Debt Outstanding
Billions of dollars
2006
2007
2008
2009
2010
1
To tal Credit Market
Debt Owed by :
45,354
50,043
52,433
52,266 52,399
2
29,180
31,699
33,602
34,634 36,113
12,943
5,943
13,806
6,703
13,844
6,951
13,611 13,386
6,964 7,176
3,196
3,650
3,972
3,672
3,475
204
2,008
219
2,199
223
2,251
221
2,360
225
2,465
8
Do m estic n o n fi n an cial
secto rs
Household sector
Nonfarm corporate
business
Nonfarm noncorporate
business
Farm business
State and local
governments
Federal government
4,885
5,122
6,362
7,805
9,386
9
Rest o f th e wo rld
1,883
2,126
1,709
2,014
2,115
14,291
1,002
498
16,217
1,263
630
17,123
1,425
709
0
1
0
0
0
503
319
19
14
2,628
633
423
32
29
2,910
717
356
41
55
3,182
1,090
152
27
48
2,707
1,047
127
26
45
6,435
3,841
4,464
4,961
5,377
1,139
4,199
1,144
411
69
645
4,544
1,280
421
65
786
4,135
1,200
373
143
1,253
3,350
1,044
339
93
817
2,353
962
350
130
751
3
4
5
6
7
10
11
12
13
14
15
16
17
18
19
20
21
22
23
24
Fin an cial secto rs
Commercial banking
U.S.-chartered
commercial banks
Foreign banking offices
in the U.S.
Bank holding companies
Savings institutions
Credit unions
Life insurance companies
Government-sponsored
enterprises
Agency- and GSE-backed
mortgage pools
ABS issuers
Finance companies
REITs
Brokers and dealers
Funding corporations
15,618 14,171
1,666 1,852
576
805
Source: Federal Reserve Flow of Funds
c01.indd 14
10/02/12 8:30 AM
How Credit Slipped Its Leash
15
the data series can be easily downloaded from 1945. Much of the analysis
in this book is built on the data supplied in the Flow of Funds report.
The Rest of the World
The third development responsible for the credit conflagration in the United
States originated outside the country. As can be seen in Exhibit 1.7, lenders
from “the rest of the world” supplied 15 percent of all credit within the United
States by 2007, a figure that came to roughly $7 trillion that year.
It is crucial to understand that this money, which was lent to the
United States, originated on the printing presses of Asian central banks.
It was newly created fiat money and a requisite part of Asia’s export-led
growth model. More than any other single factor, it was responsible for
creating the global imbalances that destabilized the world.
Chapter 2 details how the creation of the equivalent of nearly $7 trillion
in fiat money outside the United States between 1971 and 2007 exacerbated
the extraordinary credit dynamic already underway inside the United States.
Notes
1. Irving Fisher, The Purchasing Power of Money: Its Determination and Relation to
Credit, Interest and Crises (New York: The Macmillan Company, 1912), p. 131.
2. Council of Economic Advisers, 1968 Economic Report of the President, p. 16,
/>ERP_1968.pdf.
3. The Federal Reserve Act of 1913, p. 17, />Reserve_Act.
4. Joshua N. Feinman, “Reserve Requirements: History, Current Practice, and
Potential Reform,” Federal Reserve Bulletin, June 1993.
5. The Fed’s website: Reserve Requirements, />monetarypolicy/reservereq.htm.
c01.indd 15
10/02/12 8:30 AM
The New Depression: The Breakdown of the Paper Money Economy
By Richard Duncan
Copyright © 2012 Richard Duncan
CHAPTER
2
The Global Money Glut
The balance of payments commands, the balance of trade obeys, and
not the other way round.
—Eugen von Boehm-Bawerk1
W
hen the Bretton Woods international monetary system broke down
in 1971, something extraordinary began to happen. The central
banks of some countries began printing fiat money and using it to buy the
currencies of other countries. Before 1971, currencies were pegged either
directly or indirectly to gold. Therefore, there was nothing to be gained by
creating fiat money in order to buy any other country’s currency. When
the fixed exchange rate system ended with the collapse of the Bretton
Woods system, however, that changed. Gradually, it became apparent that
a country could gain an export advantage if its central bank created fiat
money and used it to buy the currencies of its trading partners. Such intervention served to push up the value of the other currencies and depress
the value of the currency being created, making the products of the
currency-manipulating country more price competitive in the international
marketplace.
Central banks accumulated approximately $6.7 trillion worth of foreign
exchange between 1971 and 2007, when the global economic crisis began
to take hold. (See Exhibit 2.1.) To do so, they created the equivalent of
$6.7 trillion worth of their own fiat money. Approximately 75 percent of
that money, roughly $5 trillion, went into the United States and, by 2007,
supplied 10 percent of total credit market debt (TCMD) there. That flood of
foreign capital threw fuel on the credit boom that was already underway
there thanks to the elimination of the requirement that dollars be backed
by gold and the near elimination of the requirement for the financial system
to hold liquidity reserves. Thus, the creation of foreign fiat money and
its investment into the United States was the third “financial innovation”
17
c02.indd 17
10/02/12 2:36 PM