18 tran tien khai technology change in rice production and rice farmer income in vietnam mekong delta lowland
Bạn đang xem bản rút gọn của tài liệu. Xem và tải ngay bản đầy đủ của tài liệu tại đây (134.03 KB, 15 trang )
TECHNOLOGY CHANGE IN RICE
PRODUCTION AND RICE FARMER INCOME
IN VIETNAM MEKONG DELTA LOWLAND
Nguyen Tri Khiem1
Tran Tien Khai2
1
2
Faculty of Economics, An Giang Univresity
Faculty of Development Economics, University of Economics of HCM City
ABSTRACT
Trends of productivity of the rice-based production systems in the Vietnam Mekong River Delta were
analyzed using aggregate and on-farm panel data. The panel data set was generated from continuous
farm data collection of 30 rice crops in the 10-year period 1995-2004 in 4 villages under intensive
triple rice cropping of the riverine flood plain of Mekong Delta.
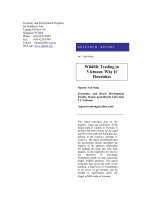
Aggregate data analysis show the impacts on the livelihoods of its rural population, with particular
reference to the process and impacts of intensification and diversification of the rice-based farming
systems, changes in the non-farm economy and the linkages between agricultural intensification and
the non-farm economy. Despite the man-land ratio in the Mekong Delta has declined from a level of
0.6 ha/worker in the mid-1980s to the present value of about 0.45 ha/worker. Agricultural worker
productivity grew at 4% per year during the last 25 years.
Average paddy yield growth rates of the period 1995-2004 observed at sample farms were 1.2%;
0.9% and 1.4% for the summer-autumn, autumn-winter winter-spring crops respectively. Farm
overuse of urea and unbalanced fertilizer application in rice production is widespread in the intensive
rice farming system. Overuse of urea often leads to a higher possibility of pest and disease incidence
and as a result, farmers tend to apply more pesticides to maintain the average yield. Nevertheless,
since the late half of the 1990s, the process of changing from input intensification to knowledge
intensive agriculture has been forming. There have been the signals of change in fertilizer use of
farmers towards a stable and balanced application. The technical measures emphasize the trends of
reducing nitrogen rates and increasing potassium and phosphate application. The adjustment helped
to reverse the declining trend of nitrogen fertilizer productivity observed in the late 1980s and early
1990s.
The last part of the paper provides implication and recommendations for policies to sustain the
productivity of the rice production system.
------------------------------------------------------------------------------------------------------------Nguyen Tri Khiem and Tran Tien Khai. (2008). Technology change in rice production and rice farmer income in
Vietnam Mekong Delta lowland. Proceeding of The Forum on "Rice Policy Research: Key Issues from National
Perspectives" Workshop. International Rice Research Institute. 18-19 Feb 2008. Los Banos, the Philippines.
INTRODUCTION
The Mekong River Delta of Vietnam covers an area of 4 million ha with a population in 2006 of 17
million people. Eighty percent of the population in the Delta depends on agriculture. The Mekong
River Delta is both the rice bowl and the most important aquaculture region of Vietnam, 30% of its
the area is fertile alluvial soil with abundant water resources. Rice is the dominant crop of the Mekong
Delta, planted on 2.1 million ha, contributing more than 50% of the rice production and 80% of rice
export of the country.
The major factors which contribute to the fast growth of rice production in the Mekong Delta during
the 1980s and 1990s are: better farmers’ incentives provided by reform policy, investment in irrigation
systems and land reclamation, expanded area under high yield varieties and improved farmers’
knowledge of intensive farming, and the increase in supply of farm inputs under a deregulated
system. The introduction of policy reforms in agriculture gives the farmers production incentives and
more freedom to respond to market signals. On the other hand, over time, farm households are
becoming more dependent on markets for selling their products and purchasing inputs.
The rice-based farming systems in the Mekong Delta underwent a rapid process of intensification and
commercialization. As the price of rice started to decline in the later part of the 1990s, income from
rice farming became stagnant or even declined, while better income could be obtained from fishery
products, fruit and vegetables, and animal products. The commercialization of the farming systems
has, on the other hand, led to higher risks, especially market risks. Farmers require adequate capital
investment to reap the benefits of farming. Inequities have increased the income gaps between small
and large farmers and landless farmers.
This paper first describes the transition of the production systems in the Vietnam Mekong Delta and
the impacts on the livelihoods of its rural population, with particular reference to the process and
impacts of intensification and diversification of the rice-based farming systems, changes in the nonfarm economy and the linkages between agricultural intensification and the non-farm economy.
The analysis of regional aggregate data is followed by on-farm data analysis using a panel data set
generated from continuous farm data collection of 30 crop seasons in ten year period 1995-2004 in 4
villages under intensive triple cropping rice cultivation of the riverine flood plain of Mekong Delta. The
three rice crops were designated as summer-autumn (SA), autumn-winter (AW) and winter-spring
(WS) seasons. Long-term on-farm data analysis examines the trends of input use, productivity and
rice farmer income in the intensive triple rice cropping in the Mekong delta.
The last part of the paper provides implication and recommendations for policies to sustain the
productivity of the rice production system.
Trends of Population and Land Use
With a natural surface area of about 4 million ha, the Mekong Delta has 2.9 million ha of agricultural
land, of which 2.1 million ha of rice land, 0.4 million ha to perennial crops and the 0,4 million ha to
other annual crops. Around 0.23 million ha is suitable for aquaculture.
Seventy-six percent of the total population of the Mekong Delta in 2002 worked in rural areas.
Agriculture is the main source of income of the 72% of the 2.2 million households. The cultivated area
per farm household averages around 1.30 ha. Vietnam has one of the lowest ratios of land per
agricultural worker in the world, approximately 0.27 ha/worker. This man-land ratio in the Mekong
Delta has declined from a level of 0.6 ha/worker in the mid-1980s to the present value of about 0.45
ha/worker (Figure 1).
0.58
0.56
ha/agric. worker
0.54
0.52
0.5
0.48
0.46
0.44
0.42
2001
2000
1999
1998
1997
1996
1995
1994
1993
1992
1991
1990
1989
1988
1987
1986
1985
0.4
Figure 1. Agricultural land per Agricultural Worker in the Mekong Delta, 1985-2001.
Land use and cropping patterns of the Delta are strongly influenced by the natural resource conditions
of soil and water. The three major soil groups in the Delta are alluvial soils in the central part, saline
soils along the coast and acid sulphate soils. Twenty eight percent of the total of four million ha is
affected by acid sulphate soils, 21% by saline water and about 17% by both saline and acid soils.
Seasonal flooding affects 1,6 million ha. The combination of the water regimes and soil types enables
the region to have the most diversified farming pattern in Vietnam. The Delta can be broadly
distinguished into three ecological regions; the central region of the fresh water irrigated rice system,
the flood affected North West region and the coastal region in the south east. The sample farms of
this analysis were taken from villages in the rice intensive production systems in the flood affected
and the central regions.
Table 1
Growth in Rice Production, Vietnam, 1976-2006.
Period
Cultivated
area (%)
Yield (%)
Production
Per capita
(%)
Cultivated Area
(%)
1976-80
1.0
-0.6
0.5
-1.0
1981-87
-0.1
3.2
3.1
-2.3
1988-96
2.4
2.8
5.1
0.5
1997-06
2.2
3.1
5.8
0.7
Source: Agricultural statistics, GSO. Hanoi. Various years.
Intensification
The growth of the rice area of Vietnam is contributed mostly by the Mekong Delta. Table 1 shows the
changes in the development of the rice area cropped in Vietnam since 1975. Since 1980, two-thirds of
the increase in rice production has come from the Mekong Delta which occupies 44% of Vietnam’s rice
land but accommodates only 24% of the population. This progress was made possible partly through
massive investments in the development and maintenance of canals and embankments for flood
control, drainage, and irrigation by provincial and district governments as well as by farmers.
The investments in water control in the Mekong Delta allowed farmers to change from the traditional
single cropping rice to two or three irrigated lowland rice crops. The conversion of the deepwater
ecosystem to irrigated lowlands has been instrumental in the spectacular growth in rice production
during the 1980s, because farmers were producing nearly 10/t/ha/yr of paddy from the two irrigated
rice crops compared with 2.0-2.5/t/ha they used to produce from deepwater rice. However, policy
reforms through land re-allocation to individual farmers and liberalization of the input and output
markets were behind the boost in rice productivity in the early 1990s (Khiem and Pingali 1995).
Figure 2 shows the trends in rice cropping of the last twenty years. From the end of the 1970s the
production of rice more than doubled while the area of rice did not show the same significant growth.
New policy to allow diversification of rice land into other crops initiated in 2001 had strong effect on
rice area particularly in the coastal regions where large area had been converted to aquaculture
production. More than 200 thousand ha formerly planted to rice were shifted to aquaculture. In fact,
rice cultivated area of the whole country ceased to grow since 2001. Only yield improvement had
contributed to rice production growth since then.
1976 = 100
450
400
Rice area
350
Rice yield
300
Rice production
250
200
150
100
50
2006
2004
2002
2000
1998
1996
1994
1992
1990
1988
1986
1984
1982
1980
1978
1976
0
Figure 2. Trends of Rice Cropping Area, Yield and Production in the Mekong Delta 1976-2006.
The ten-year on-farm observation similarly shows a steady increasing trend of paddy yield in the main
ecological regions of the Mekong Delta (Figure 3). Average rice yield of the winter-spring crop (dry
season) can reach up to 6.5 t/ha, meanwhile those of the summer-autumn (rainy season) and the
autumn-winter crops remain less than 5 t/ha. The yearly average growth rates of paddy yield of the
period 1995-2004 observed at sample farms were 1.2%; 0.9% and 1.4% for the summer-autumn
(SA), the autumn-winter (AW) and the winter-spring (WS) crops respectively (Khai 2004). While the
third rice crop (AW crop) is not encouraged by the government, the rice supply elasticity comes from
the third crop. Farmers tend to plant a third rice crop in location where the environment condition
possible and market price is favorable.
7000
Kg paddy / ha
6500
6000
5500
Summer-Autumn
5000
Autum-Winter
Winter-Spring
4500
4000
3500
3000
1995
1996
1997
1998
1999
2000
2001
2002
2003
2004
Figure 3. Trends of rice yield at farm level in the riverine flood plain of Mekong Delta 1995-2004.
Diversification of the rural economy in the delta
The recent changes in land use and farming systems since 1990 have been influenced by market
forces. The area planted to fruit trees expanded rapidly in response to price and demand for fresh
fruits in the domestic and export markets. Most rapid conversion of rice area into other uses has been
observed in the coastal region. A large shift from rice to shrimp was seen in the saline and brackish
water environment in Ca Mau peninsula. Farmers were attracted by the lucrative shrimp price and
were facilitated by a policy shift allowing them to grow shrimp on rice land. Within two years from,
2000-2001, nearly 200 thousand ha of rice land were converted to either mono-shrimp or rice-shrimp
cropping.
Table 2
Structural Change of the Rural Economy of the Mekong Delta, 1991-2000.
Farming (%)
Industries (%)
Services (%)
1990
80
10
10
1996
72
15
14
2000
70
16
14
-10
6
4
Average change
Table 3
Composition of Rural Production Value of the Mekong Delta 1995-2001.
Crops (%)
Animal (%)
Services (%)
1995
85
10
5
2000
81
12
7
2001
78
14
8
Source: GSO. Various years.
In terms of product value, the crop sector accounts for more than 75% of the gross value of
agricultural production excluding the fishery sector. Within the rural economy, the value of
agricultural production accounted for 80% of GDP, rural industries 9% and services 10% in 1990. Ten
years later in 2000 these ratios were 70%, 16% and 14% respectively (Table 2). The value of crop
production declined from 85% of total agricultural production in 1995, to 78% in 2001 (Table 3). Over
the same period the value of animal production increased from about 10% to 14% and agricultural
services from 5% to 8%. Lower rice prices after 1990s accounted for the decrease in the proportion of
value attributable to the crop sector. Production values of agriculture (crop and livestock) and fishery
(in 1994 constant price) are shown in Table 4. The value of crop and livestock production grew at 6%
per annum during the last 25 years. The value of fishery production grew at 9% per year. Table 5.4
shows the overall structural changes of the rural economy in the Mekong Delta. The percentage of
farming has declined 10% in the last ten years, but the total production has been increasing for the
period 1993-2002 with 6%. The shares of industries and services in the rural economy have risen, 6%
and 4% respectively.
Table 4
Production Value 1 of Agriculture and Fishery of the Mekong Delta.
Agriculture
(VND 2 million)
Fishery
(VND million)
Aquaculture
(VND million)
Capture Fishery
(VND million)
1986
18,4
3,4
1,2
2,4
1990
22,1
4,8
2,0
2,8
1995
31,2
7,9
3,1
4,9
2000
40,6
13,1
5,6
7,5
2001
43,6
15,8
7,8
8,0
Source: GSO. Various years.
Productivity of Inputs in Rice Production
The productivity of two major inputs, viz, labour and urea fertilizer, are examined in this section. The
production value added per agricultural worker (in 1994 constant prices) since 1985 is shown in Table
5. Agricultural worker productivity grew at 4% per year during the last 25 years. Rough estimates of
agricultural worker productivity were based on the total value of agricultural production and the total
number of people working in agriculture.
Table 5
Value added per agricultural worker, Mekong Delta, 1985-2001 (million VND/person).
1985
1988
1990
1993
3.6
3.7
4,0
4,3
Source: GSO. Various years
1996 1997 2000 2001
5,4
5,6
6,5
6,9
However, this process of structural change has not seen a parallel decline in the labour force engaged
in agriculture. During the same period, the agricultural labour force was declining from 74% in 1991
to 62% in 2000. That implies that productivity is growing more slowly in the agricultural sector than in
the rest of the economy. By considering the ratio of the agricultural share of GDP and the agricultural
labour share, we obtain a value of 0.54 in 1991, declining to 0.37 in 2000. This implies that in 2000,
the productivity of the labour force in agriculture was only 37% of the value in the rest of the
economy. The lower productivity of agriculture is reflected through rural incomes that are substantially
lower than urban incomes and suggests that many Vietnamese farm households continue to exist at a
subsistence level. Figure 4 shows the percentage growth of agricultural productivity up to 2001, with
the base year 1985. The agricultural productivity is estimated as a ratio of the net agricultural
production and economically active labour population working in agriculture.
1
The period average market price in 1986: 22.74; 1990: 6482.8; 1995: 11038.25; 2000: 14167.75; 2001:
14725.17.
2
1994 constant prices
200
1985 = 100
180
160
140
120
100
20
01
19
99
19
97
19
95
19
93
19
91
19
89
19
87
19
85
80
Figure 4. Agricultural Labour Productivity of the Mekong Delta 1985-2001.
Intensification of agricultural production of the Mekong Delta happened mostly in the rice sector. The
rice cropping index has almost doubled within the last 30 years. Inorganic fertilizer is a major
imported input. The application of urea in rice production has increased from a level of 40 kg/ha of
urea in 1976 to 150 kg/ha of urea in 1994 (Figure 5). Fertilizer productivity in rice production shows a
steadily declining trend. The average amount of paddy produced per kilogram of fertilizer declined
from 50 kg in 1976-81 to 22 kg in 1991-92.
160
140
120
kg
100
Urea (kg/ha)
80
Rice (kg/kg urea)
60
40
20
19
92
19
90
19
88
19
86
19
84
19
82
19
80
19
78
19
76
0
Figure 5. Fertilizer Use per ha and Productivity of Fertilizer in Rice Production.
The phenomenon of overuse of urea and unbalanced fertilizer application in rice production is
widespread in the intensive rice farming system (Xuan 2003). Not only in the Mekong Delta, but also
in other rice producing regions. Overuse of urea often leads to a higher possibility of pest and disease
incidence and as a result, farmers tend to apply more pesticides to maintain the average yield.
Nevertheless, since the late half of the decade 1990, the process of changing from input
intensification to knowledge intensive agriculture has been forming. There have been the signals of
change in fertilizer use of farmers towards a stable and balanced application. The technical measures
emphasize the trends of reducing nitrogen rates and increasing potassium and phosphate application.
In average, nitrogen use per area unit decreased by 0.4 - 1.4% per year while phosphate use
increased by 0.4 – 0.7% and potassium use increased by 8.0 – 11.6% per year in the period 19952004. The adjustment helped to stabilize fertilizer costs, increased productivity of fertilizer and
fertilizer use efficiency as well (Figures 6 & 7). Technically, the change of nutrient structure helped to
improve grain quality and stabilize paddy yield.
Kg paddy / kg urea
70
Summer-Autumn
60
Autum-Winter
Winter-Spring
50
40
30
20
10
1995
1996
1997
1998
1999
2000
2001
2002
2003
2004
Kg N / ha
Figure 6. Evolution of productivity of fertilizer
130
125
Summer-Autumn
120
Autum-Winter
Winter-Spring
115
110
105
100
95
90
85
80
1995
1996
1997
1998
1999
2000
2001
2002
2003
2004
Figure 7. Evolution of nitrogen use efficiency
Adoption and change in use of pesticides
The changes in pesticides use was characterized by the application of selective types in replacing for
wide-spectrum ones thanks to extension activities and availability of the products on domestic
pesticide market. In particular, selective herbicides were increasingly adopted for weed control in
different ecosystems. Fixed spraying regime has become common for herbicides and fungicides.
Pesticide application appeared to be influenced by different factors. The most important factors
probably are farmer knowledge, farmer perception about efficiency of pesticides, farm economic
situation, marketing activities of companies and dealers, local extension services and farmer
awareness and application level of integrated pest management. Therefore, the efficiency in use of
pesticides broadly varied among farms. High variation of pesticides costs, especially for insecticides
illustrated that problem.
The increase of pesticide application and their prices lead to the costs significantly increase of
pesticides costs in the period 1995-2004 at the average rate of about 12.0% per year. Particularly, the
proportion of herbicide expenses tended to become the most important due to labor saving
requirement and the wide application of direct-seeded method.
980
x1000 VND / ha
880
Summer-Autumn
780
Autum-Winter
680
Winter-Spring
580
480
380
280
180
1995
1996
1997
1998
1999
2000
2001
2002
2003
2004
Figure 8. Pesticides cost trend in the period 1995-2004
Trends of labor use and mechanization
A very important characteristic of rice farmers in the Mekong region is the combination of manual
labor and mechanization in response to the economic and technical conditions. Although family labor
is abundant, the market supply of labor and equipment is very common in rural regions. Dependence
on external labor and equipment services are common particularly during peak periods. The supply of
mechanization services have helped to reduce the individual investment and created an agricultural
labor market in rural region. As a result, the mechanization of rice production in Mekong Delta has
two specific attributes: the low-equipped condition of individual rice farmers but fair-equipped at
community level and the popularity of marketed mechanized services.
To keep pace with the increasing cost of hired labor and to meet demand of intensive cropping
systems, rice farmers have broadly applied the labor-saving techniques to reduce manual labor
investment (Figure 9a, 9b and 9c). The most common measure is the selection of mechanization in
accordance with labor availability in rural regions. The mechanization of rice production in the study
period concentrated only on some main works as land preparation, water pumping and threshing and
recently more on mechanized harvester. Increasingly use of other measures such as direct seeding
method and application of herbicides are common.
The combination use of mechanization and manual labor helped rice farms toeconomize rice
production costs. However, cost of hiring labor and machine has been increasing sharply since 2002
due to the increase of labor wages and petrol cost in local market (Figure 9a, 9b and 9c). About one
half of labor need in rice farming operation is provided by hired labor and the trends are similar for all
three crop seasons. During the last ten years, the labor input per ha had reduced from 90 person days
to 70 person days. The cost of hired labor and machine service increased rapidly particularly in the
past few years (Figure 10).
90
Persondays / ha
90
Total labor use
80
Persondays / ha
Total labor use
Family labor
80
Family labor
70
70
60
60
50
50
40
40
30
30
20
20
1995
1996
1997
1998
1999
2000
2001
2002
2003
1995
2004
Figure 9a. Trend of manual labor use, SA crop
crop
1996
1997
1998
1999
2000
2001
2002
2003
2004
Figure 9b. Trend of manual labor use, AW
90 Persondays / ha
Total labor use
80
Family labor
70
60
50
40
30
20
1995
1996
1997
1998
1999
2000
2001
2002
2003
2004
Figure 9c. Trend of manual labor use, WS crop
1600
1000 VND / ha
1500
Summer-Autumn
1400
Autum-Winter
1300
Winter-Spring
1200
1100
1000
900
800
1995 1996 1997 1998 1999 2000 2001 2002 2003 2004
Figure 10. Trend of external labor & machine costs
Change in production costs, unit cost and farm income
Trend analysis of rice production costs using farm level data in the riverine flood plain of Mekong
Delta in the period 1995-2004 showed that farmers were able to stabilize the investment into rice
production despite the profound structural changes. The rice production cost increase was not
remarkable in this period. On the average, total production costs in VND increase at the rate of 2.0 –
2.4% per year in period 1995-2004. However, in comparison to the local prices at the end of 2007,
average prices of principal fertilizers increased by 10.7 – 19.5% per year due to sharp rise in petrol
prices, and local labor wage increaseed by 6.9% in the same period. Meanwhile, paddy price at farm
gate increased 9.4% per year. In the same period, the devaluation of the domestic currency had
positive effects on strengthening the competitiveness of Vietnamese rice. Figure 11a and Figure 11b
show the trends production costs by season in the period 1995-2004. The paddy unit costs and
farmgate paddy prices both in VND and in $US are shown in Figures 12a and 12b.
Due to reasonable change in production technology, rice farmers in Mekong Delta are able to manage
paddy unit cost. On the average, the unit costs decreased by 4.5 – 5.4% per year during the last 10
years. The devaluation of the domestic currency to $US helped to further lower the unit cost more, by
8.1 – 8.9 % per year (Figure 12a and 12b). However, the much higher rates of input prices in recent
years will push up the paddy unit cost.
On the other hand, the net farm income and benefit depend on fluctuation of rice price in
international market. The strong increase of petrol prices in international market in the recent years
has posed a remarkable pressure on rice farm income as well as competitiveness of rice production in
comparison to other alternative cash crops and off-farm activities.
5000
x1000 VN đong /
ha
360
4800
4400
Summer-Autum
340
Summer-Autum
4600
USD / ha
Autum-Winter
320
Winter-Spring
300
4200
Autum-Winter
Winter-Spring
280
4000
3800
260
3600
240
3400
220
3200
200
3000
1995 1996 1997 1998 1999
1995 1996 1997
2000 2001 2002 2003 2004
Figure 11a. Trend of total costs (in VND, current price)
(in $US)
Paddy farmgate price (VND/kg)
2002 2003 2004
Figure 11b. Trend of total costs
Paddy unit cost (VND/kg)
2300
1998 1999 2000 2001
180
Paddy unit cost (USD/ton)
160
Paddy farmgate price (USD/ton)
140
1800
120
1300
100
80
800
60
40
Figure 12a. Trend of paddy price & unit cost
(in VND)
2004-2
2003-3
2003-1
2002-2
2001-3
2001-1
2000-2
1999-3
1999-1
1998-2
1997-3
1997-1
1996-2
1995-3
20
1995-1
2004-2
2003-3
2003-1
2002-2
2001-3
2001-1
2000-2
1999-3
1999-1
1998-2
1997-3
1997-1
1996-2
1995-3
1995-1
300
Figure 12b. Trend of paddy price & unit cost (in
$US)
IMPLICATIONS FOR VARIETIES, TECHNOLOGIES, INSTITUTIONS AND POLICIES
Varieties and Technologies
The major factors contributing to the fast growth of rice production and productivity in the Mekong
Delta are attributed to the development of technology which includes high yielding rice varieties,
chemical fertilizers and assured irrigation. The average rice yield has almost doubled in the past 30
years, from about 2 t/ha in 1976-77 to 4.2 t/ha in 2002. The rice cropping index has almost doubled
within the last 30 year period. The area under rice has expanded from 2.06 million ha in 1976 to 3.97
ha in 2002, accounting for 82-85 % of total crop area. The application of urea fertilizer in rice
production has increased considerably from 40 kg/ha in 1976 to 150 kg/ha in 1994.
The implications of technological innovation are clearly seen from the enormous increases in paddy
yields by close to five times with a change to irrigated lowland rice cultivation from traditional single
rice crop, and considerable increases in household income through diversification towards aquaculture
and other rice based cropping systems. These technological innovations have obviously contributed to
the non-farm economy by increasing backward and forward linkages for input services and creating
increased employment. The marketed rice surplus creates value-added and employment along the rice
value chain. The market for non-farm goods and services expanded as a result of increased
expenditures of increased farm households: the expenditure linkages in the Mekong Delta average
around 26%. These have also contributed significantly in generating additional employment and
income in the rural trade, transport and service sectors. The growth in the rural agricultural sector
created additional employment in the non-farm sector.
The application of integrated farming and improved knowledge of nutrient mangement can maintain
the sustainability of productivity of fertilizer use. The deceasing efficiency of nitrogen fertlizer use seen
during the 1970s and 1980s showed a reverse trend. More balanced fertilizer application had
improved efficiency of fertilizer use.
Institutions and Policies
Institutions and policies were key milestones in achieving significant growth in rice production in
Mekong Delta. For example, the reallocation of land and the market liberalization boosted the rice
productivity. In 1989, the transition to the market economy started. Land use rights were allocated to
individual farm households. Land was allocated for 20 years to farmers cultivating annual crops and
undertaking aquaculture, and for 50 years to those planting perennial crops including horticulture.
Land use rights were further strengthened by the information of the land Law in 1993. Under this law,
land use rights can be inherited, transferred, rented or exchanged. The land transaction market was
implicitly recognized and the operation of land transactions has many features similar to those in other
countries.
In parallel with the policy transition initiated in 1989, the marketing system including export markets
was also gradually liberalized, thereby lengthening the value chains and enlarging the forward
linkages. The dual price system was abolished and replaced by a “one-price” system. A two-tier
banking system was introduced under which commercial banking functions were taken away from the
State Bank. The distribution of material inputs and farm products, particularly the retail markets, was
passed to private traders. The latest package of policy reforms, and in particular the opening up of the
rice export market, has boosted rice production. Within the four years period from 1985 to 1989, rice
production increased almost 20%. Vietnam changed from a rice deficit state to become one of the
largest rice exporters in the world. Vietnam has consistently exported 3-4 million metric tons of rice
every year since 1990. The bulk of the increase in rice production and export has been brought about
in the Mekong Delta.
A second important institutional and policy contribution is the high priority according to investment in
irrigation systems and land reclamation. The introduction of policy reforms in agriculture provided
farmers with incentives and more freedom in rice production to respond to market signals, leading to
increased input use, market surpluses and size of backward and forward linkages.
The lowland rice farming in the Mekong Delta is highly dynamic. Rice farmers sell about an average
80% of their harvest and they depend totally on the market for material inputs and thus create strong
but simple backward and forward linkages between agriculture and the non-farm economy. The
marketed proportion of other farm produce is even higher. However, in recent years, in response to
the declining rice price and the prospects of increasing demand and price for non-rice farm products,
the rice farming system is being diversified in those areas with suitable natural conditions. However,
the diversification process is constrained by undeveloped post-harvest facilities and the marketing
system.
Although marketing channels are often fragmented, the marketing system is dynamic and able to
provide a linkage between farmers and markets. There are some problems such as, lack of
standardization of the production processes, and dependency of processors and exporters on the
multiplicity of small traders for their source of supply.
Nonetheless, technological innovation has led to an positive impact on the intensification of irrigated
lowland rice cultivation. This has had considerable impacts on the growth of the non-farm economy.
The key policy instrument that promoted growth of both farm and non-farm economies is the enabling
policy environment for private sector investment and incentives. In this context, future policy
strategies for the sustainable intensification of farming and farm enterprises should be public/private
partnerships for the development of technology, markets, investment in the service sectors and
targeted priority investments from the public sector for resource poor farmers.
Trend analysis of rice production costs using farm level data in the riverine flood plain of Mekong
Delta in the period 1995-2004 showed that the rice production cost per area unit in VND increased at
the rate of 2.0 – 2.4% per year in period 1995-2004. In the same period, the devaluation of the
domestic currency had positive effects on strengthening the competitiveness of Vietnamese rice. Due
to improved efficiency in input use, rice farmers in Mekong Delta were able to manage paddy unit
cost. On the average, the unit costs decreased by 4.5 – 5.4% per year during the last 10 years. The
devaluation of the domestic currency to $US helped to further lower the unit cost more, by 8.1 – 8.9
% per year. However, the much higher rates of input prices in recent years will push up the paddy
unit cost.
Because the rice market is highly connected to the export market, the net farm income and profit
depend on fluctuation of rice price in international market. The strong increase of petrol prices in
international market in the recent years has posed a remarkable pressure on rice farm income as well
as competitiveness of rice production in comparison to other alternative cash crops and off-farm
activities.
Research Perspectives
Long-terms farm observations was able to supply a better understanding on the efficiency, the use of
inputs in relation to output, the affection of price factors and the overall evolution of rice production in
Mekong region in the 1900s. The findings can contribute to better understandings on rice production
in relation with the impacts of agricultural policies at farm level.
Key observations and policy implications:
-
Intensification is the key contribution to rice production growth in Mekong region. The main
rice bowl of Viet nam.
-
Rice farmers in the Mekong region have rapidly responded to the changes of production
environment as well as the changes in the international rice market, depend strongly on the
fluctuation of input and output prices in the market.
-
The role of technology wss behind the productivity growth in rice production by transforming
from land augmentation to knowledge and management intensification.
-
The tendency of application of the labour-saving techniques in combination with input-saving
techniques. Technology transfer from research institutions.
-
Market for farm operation service – land preparation, crop establishment, harvest are
gradually developed.
-
Heterogeneity in use of rice varieties makes the standardisation of rice product for export
more difficult. Consequently, the access of Vietnamese rice to the international market is less
efficient.
-
Increasing dependence on the chemical fertilizer and pesticides lead to the increase in
production costs and safety of rice products. On the other hand, the fater rise of market input
prices compared with rice price affect rice farm income.
-
Lack of machines specialised for mechanised harvest on submerged land, especially in wet
season causes high post-harvest loss and increase in rice production costs when the manual
labour shortage occurs. Land fragmentation is a constraint to mechanization.
-
Low income from rice in comparison to the competing crops (e.g. fruits, vegetables) and
aquaculture (e.g. fresh-water fish, shrimp) lead to diverisification, particularly in coastal
regions.
-
Farm differentiation in terms of production efficiency is another constraint. The disparity in
property and use of farm resources, knowledge, know-how and accessibility to market causes
the existence of a great percentage of low efficient rice farms. In consequence, it leads to
overall reduction of the production efficiency of the regional rice production. Variation of farm
yield is large within the same location implying the potential of productivity improvement can
be achieved by extension.
-
Rice production in Mekong region is likely to face potential risks of natural disaster. In recent
years, the more frequent occurence of unpredicted inundation, drought and saline intrusion,
in combination with deforestation in watershed mountainous regions. Abnormal inundation
and drought can badly harm rice crops because of the dependence on water supply of
Mekong River. The meteorological and hydrological changes affect the agricultural production
of all countries in the river basin. High international competition for Mekong River water,
especially in dry season may rise as potential conflict in the future. Inefficient use of water
resource as well as high application of chemical products may contaminate and pollute the
water used for human consumption.
-
Demand of high quality rice and change of international market standards, especially food
quality and safety will be the barriers for low-developed rice industry in Vietnam. Standard of
chemical residues is also a potential challenge. The choice of yield and grain quality is a
problem that Vietnamese scientists have to overcome. The potential application of
biotechnology may alleviate constraints for paddy yield improvement and reduction of rice
production costs. Improvement of rice grain quality through breeding is very promising for
obtaining high product value. The improvement should focus in both grain shape and cooking
quality.
-
Improvement of the accessibility to formal credit for small farms is also an appropriate
measure to reduce financial pressure on small farms. Credit support for other farm activities
than rice production will permit farmers to seek the opportunities of income diversification. To
enhance a better allocation of farm resources, the establishment of different co-operation
types among farms would be suitable as a measure that helps to make use of cost economies.
Improve banking sector - more appropriate credit lending to agriculture.
-
Technologies that can reduce production costs as integrated nutrient and pest, water and
weed management, breeding for abiotic stress tolerance and bio-farming would help rice
production to meet international food safety standards and increase product value.
-
Encourage private investments (leveled playing field with SOEs). Restructure or equitize the
inefficient SOEs in rice marketing and rice export. Create specialize Export Promotion agency.
-
Further revise the Land Law. Improve regulations on agricultural cooperatives; organize
farmers to join cooperatives or groups for better bargaining power.
-
Restructure the national agricultural research system and redefine the activities of the
national agricultural extension system. Integrate research and extension program at the
provincial level.
REFERENCES
GSO. Various Years. General Statistical Office.
Khai, T.T. 2004. Methodology for analysis of rice production costs evolution: application to Mekong
region, Vietnam. Thesis of PhD. Unité d’Economie et Developpement rural, Faculté
universitaire des Sciences agronomiques de Gembloux, Belgique.
Khiem, N.T & Pingali, P. 1995. Supply response of rice and food crops in Vietnam. In Vietnam and
IRRI: a partnership in rice research. IRRI, Manila, Philippines.
Rothuis A J, Nhan D. K., Richter C. J. J. & Ollevier F. 1998. Rice with fish culture in the semi-deep
waters of the Mekong Delta: a socio-economical survey. Aquaculture Research Volume 29.
Leuven, Belgium.
Sanh, N. V, Xuan Vo-Tong & Phong, T.A. 1998. History and future of farming systems in the Mekong
Delta In Vo-Tong Xuan and S. Matsui, eds. Development of Farming Systems in the Mekong
Delta of Vietnam. Ho Chi Minh city Publishing House.
Wilder, M., Di Thi Thanh, H. & Wei-Jun,Y. 2002. Reproductive mechanism In The giant fresh water
prawn, Macrobrachium rosenbergii: Identification of yolk protein structure and site of
synthesis. In development of new technologies and their practice for sustainable farming
systems in the Mekong Delta. Proceedings of the 2000 annual Workshop of JIRCAS Mekong
Delta Project. Cantho University. Ho Chi Minh, Vietnam.
Xuan, V.T. 2003. Sustainable Rural and Agricultural Development. Paper presented at the workshop
on Environmental Protection and Sustainable Development in Vietnam”. Hanoi, Vietnam.
Xuan, V.T. 2003. Excerpt from Review of the Irrigated Rice Program.