- Trang chủ >>
- Nông - Lâm - Ngư >>
- Thú y
THE COMPARISON OF DIFFERENT PELLET FEED ON FEED UTILIZATION, SURVIVAL AND GROWTH OF CLOWN KNIFE FISH (chitala chitala)
Bạn đang xem bản rút gọn của tài liệu. Xem và tải ngay bản đầy đủ của tài liệu tại đây (487.76 KB, 57 trang )
CAN THO UNIVERSITY
COLLEGE OF AQUACULTURE AND FISHERIES
THE COMPARISON OF DIFFERENT PELLET FEED ON
FEED UTILIZATION, SURVIVAL AND GROWTH OF
CLOWN KNIFE FISH (Chitala chitala)
BY
VO THI Y THU
A thesis submitted in partial fulfillment of the requirements for
the degree of Bachelor of science in Aquaculture
Can Tho, January, 16th 2013
i
CAN THO UNIVERSITY
COLLEGE OF AQUACULTURE AND FISHERIES
THE COMPARISON OF DIFFERENT PELLET FEED ON
FEED UTILIZATION, SURVIVAL AND GROWTH OF
CLOWN KNIFE FISH (Chitala chitala)
BY
VO THI Y THU
A thesis submitted in partial fulfillment of the requirements for
the degree of Bachelor of science in Aquaculture
Supervisor
Dr. LAM MY LAN
Can Tho, January, 16th 2013
i
Acknowledgment
The author wishes to express to her advisor, Dr. Pham Minh Duc, for his
consistent guidance, encouragement and assistance in her study
The author also wishes to extend special thanks to Dr. Lam My Lan for her
guidance, valuable suggestions and overall supervision
Many thanks to Mr. Nguyen Hong Quyet Thang, Mss. Tran Le Cam Tu and
my friends for their help, preparation of experimental system, sampling, feeding…
and analysis data.
VO THI Y THU
ii
ABSTRACT
A study on the comparison of different pellet feed on survival rate, growth
and feed utilization of Clown knife fish (Chitala chitala) was set up at College of
Aquaculture and Fishery, Can Tho University.
The mean initial weight of fish was 60±5 g/ind.. Density were stocked 15
ind. Into 250L tank. Four diet treatments were conducted with three different types
of pellet and the control treatment using trash fish. After 8 weeks, the survival rate
of four treatments fluctuated from 75.6 - 97.8% and were significant difference
among treatments (p<0.05). The weight of fish in treatments using different pellets
was increase during experiment, especially; the survival rate of fish in treatment 2
was highest (69.5±0.94 g/fish) as compared with treatment 1 and 3. The daily
weight gain of fish in treatment using trash fish (1496.1±6.7 mg/fish/day) was
higher than other treatments and there was significant difference with others (p <
0.05). Besides that, the specific growth rate of control treatment (1551.39±4.61 )
was also highest after 8 weeks and treatment 2 and 3 were significant difference
with treatment 1 and the control ( p<0.05). The food conversion ratio (FCR) of
treatment 3 was lowest and was significant difference with treatment 1, 2 and the
control (p<0.05). The PER of treatments fluctuated from 0.41% to 0.94%; there was
lowest in control treatment. The protein content in flesh fish changed 4.24% to
5.14% and there were significantly different between dietary treatments and the
control treatment.
iii
TABLE OF CONTENT
Acknowledgment ........................ ................................................................... i
Abstract ...................................... .................................................................... ii
Table of content .......................... .................................................................... iii
List of tables ............................... .................................................................... v
List of figures.............................. .................................................................... vi
List of abbreviations ................... .................................................................. vii
Chapter I: INTRODUCTION .... .................................................................... 1
1.1 Background ..... .................................................................................... 1
1.2 Objectives of the study ......................................................................... 2
1.3 Research activities ................................................................................ 2
Chapter II: LITERATURE REVIEW ............................................................ 3
2.1 Biological characteristic ...................................................................... 3
2.1.1 Classification and morphology ................................................... 3
2.1.2 Distribution characteristics ......................................................... 3
2.2. Growth characteristics ......................................................................... 5
2.3. Nutrition characteristics ...................................................................... 5
2.4. Study of commercial feed utilization for clown knife fish culture ....... 6
Chapter III: RESEARCH METHODOLOGY ............................................... 8
3.1. Selection site . .................................................................................... 8
3.2 Materials ........ .................................................................................... 8
3.3. Methodology . .................................................................................... 9
3.3.1 Experimental management ...................................................... 10
3.3.2 Data analyses ........................................................................... 11
3.3.2.1 Evaluations of growth parameters ..................................... 11
3.3.2.2 Survival rate ....................................................................... 11
3.3.2.3 Feed utilization .................................................................. 11
3.3.2.4 Proximate composition of feed and fish ............................ 12
3.3.2.5 Data analysis ...................................................................... 12
iv
Chapter IV: RESULT AND DISCUSSION ................................................... 13
4.1. Water quality in experimental in tanks ............................................... 13
4.1.1 Water temperature ........................................................................ 13
4.1.2 pH in experimental ....................................................................... 13
4.1.3 DO, ammonium, nitrite ................................................................. 14
4.2. Survival rate ... .................................................................................... 15
4.3.1. The weight gain of fish in experimental ........................................... 17
4.3.2. Daily weight gain ............................................................................ 18
4.3.3. Specific growth rate ......................................................................... 19
4.3.4 Food conversion ratio, food intake, protein efficiency ratio ............ 21
4.4. Proximate composition of the experimental diets and fish ................ 23
4.4.1 Proximate composition of experimental diets ............................... 23
4.4.2 Proximate composition of fish ...................................................... 24
4.5 Feed cost of diets ................................................................................. 25
Chapter V: CONCLUSION AND RECOMMENDATION .......................... 27
5.1. Conclusion .... .................................................................................... 27
5.2. Recommendation ............................................................................... 27
REFERENCES .......... .................................................................................... 28
APPENDICES ........... .................................................................................... 32
Appendix 1 ........... .................................................................................... 32
Appendix 2 ........... .................................................................................... 34
Appendix 3 ........... .................................................................................... 35
Appendix 4 ........... .................................................................................... 37
Appendix 5 ........... .................................................................................... 37
Appendix 6 ........... .................................................................................... 38
Appendix 7 ........... .................................................................................... 39
Appendix 8 ........... .................................................................................... 40
Appendix 9 ........... .................................................................................... 41
Appendix 10 ......... .................................................................................... 42
Appendix 11 ......... .................................................................................... 43
Appendix 12 ......... .................................................................................... 44
v
LIST OF TABLES
Table 3.1 The nutrition composition in commercial feed .............................. 7
Table 4.1 Water temperature in experimental tanks ....................................... 13
Table 4.2 pH in experimental tanks ................................................................ 14
Table 4.3 The fluctuation of DO, ammonium, nitrite .................................... 15
Table 4.4 Survival rate of Chitala chitala after 57 days ................................ 15
Table 4.5 Weight gain of fish during culture periods ..................................... 17
Table 4.6 The DWG of treatments in experiment .......................................... 18
Table 4.7 The specific growth rate of treatments in experiment ................... 19
Table 4.8 FCR, FCE, FI and FER of treatment during culture periods .......... 21
Table 4.9 The proximate composition of the experimental diets ................... 23
Table 4.10 The proximate composition of initial and final fish ..................... 23
Table 4.11 The cost for feed of diets .............................................................. 25
vi
LIST OF FIGURES
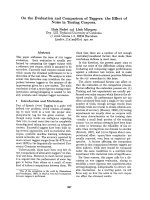
Figure 3.1 Trash fish .. ................................................................................... 9
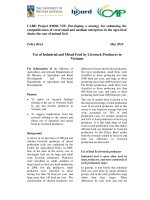
Figure 3.2 The composite tank system for experiment .................................. 10
vii
LIST OF ABBREVIATIONS
CP
Crude Protein
DWG
Daily Weight Gain
SGR
Specific Growth Ratio
SR
Survival Rate
FCR
Feed Conversion Rate
FCE
Feed Conversion Efficiency
PER
Protein Efficiency Ratio
Ind.
Individual
MK
Mekong delta
CF
Commercial Feed
CL
Crude Lipid
T1
Treatment using A diet
T2
Treatment using B diet
T3
Treatment using C diet
T4
Treatment using trash fish
DO
Dissolved oxygen
TAN
Total ammonium nitrogen
CAF
College of Aquaculture and Fisheries
CTU
Can Tho university
viii
Chapter I
INTRODUCTION
1.1 Background
The Clown knife fish (Chitala chitala) is distributed in some parts of
Southeast Asia, especially in Vietnam. Presently, this species has been cultured
more in many areas in the Mekong delta because this fish has high value in local
market, good meat quality, high price, and growth fast. However, in the world, this
fish species has not yet studied generous. There was some researches on
morphology, classification and distribution. In Vietnam, some studies were
proclaimed about classification of knife fish such as: Truong Thu Khoa and Tran
Thi Thu Huong (1993), fingerling production and feed production for Notopterus
notopterus culture (Tran Ngoc Nguyen, 2000; Le Ngoc Dien, 2004). Although the
knife fish (Notopterus notopterus) has studied and has cultured but this species was
small size, most farmers changed to clown knife fish (Chitala chitala) culture
because of large size and fast growth.
Presently, most of fingerling production farms fed their fish by fresh foods,
worms for fry. However, farmers were got more difficulties, especially, they cannot
initiative about natural food (depend on the seasons such as flooding season have
more different fish species). Using natural food for nursing from fry to fingerling
should be replaced by commercial feed to reduce production cost, disease infectious
from the live food and initiative of feed for development of clown knife fish
farming in pond. Therefore, the study on the comparison of pellet feed on survival,
growth of clown knife fish (Chitala chitala) fingerling was carried.
1
1.2 Objective of the study
To find out the suitable feed with optimal feed utilization, survival and
growth for Chitala chitala culture in order apply to the farming practice of this
species in the Mekong delta.
1.3- Research activities
- To determine the effect of different types of pellet feed on survival rate and
growth of Chitala chitala.
- To determine the effect of using pellet on feed utilization of clown knife
fish.
- To determine the proximate composition of feed and fish.
2
Chapter II
LITERATURE REVIEW
2.1 Biological characteristics
2.1.1 Classification and morphology
According to FishBase (2010), the classification of clown knife fish is:
Kingdom: Animalia
Phylum: Chordata
Class: Actinopterygii
Order: Osteoglossiformes
Family: Notopteridae
Genus: Chitala
Species: Chitala chitala (Hamilton, 1822)
2.1.2. Distribution
In the natural, the clown knife fish are distributed in many countries such as:
Laos, Cambodia, Thailand, Indonesia, and Malaysia… In Vietnam, this fish lives
from Quang Binh to south areas, especially in the MK delta including Cantho,
Haugiang, Angiang, Travinh, Vinhlong. In the flood season, the fish remove to rice
fields with more water to live. In the dry season, fish live in big lakes, dams, main
branches of rivers and depth water bodies (Truong Thu Khoa and Tran Thi Thu
Huong, 1993).
3
The clown knife fish is fresh water species. Fish can live in water body with
low oxygen and pH. In the natural condition, this fish lives in the middle or lower
reaches of a river or marshes. During the day, knife fish usually hides in aquatic
plant and dark areas. At night, the fish has more activities, catch food, swimming
slowly, the dorsal anal operates continuously as waves, fish like live areas with
more aquatic plant, pH about 6.5-7.0 (Duong Nhut Long, 2003).
2.2 Growth characteristics
In the natural, the clown knife fish could live about 8-10 years, and could get
the size 80 cm in length, and 8-10 kg in weight (Nguyen Chung, 2006). The
temperature ranged from 25-32ºC and it was suitable for clown knife fish growth
(Truong Quoc Phu, 2006). In addition, Chitala chitala grew 8-9 cm of length after
4 weeks of nursing (Doan Khac Bo, 2008).
Comparing with other species in the same family of fish, the clown knife fish
grew faster than knife fish (Notopterus notopterus). After one year, the fish was
about 30-40 cm in length and weight about 800-1200 g/ind. In the pond, Chitala
chitala has size about 500-600 g/ind. after 6 months (Duong Nhut Long, 2003).
The stocking density of fry at 100 ind/m² was the best for nursing. The fry of
this species also feed phytoplankton or zooplankton when the yolk sac was still.
Therefore, this was so a basic for determination the time when needs supply feed
right time that could improve survival rate and growth rate for the nursing (Heming
and Budington, 1988). In recent years, clown knife fish was cultured more in many
provinces in the Mekong delta. The clown knife fishes were stocked with different
density and stocking density with 7-15 ind/ m² was better for culture.
According to Le Ngoc Dien (2004), the knife fish (Notopterus notopterus )
nursing and growing at the different stocking densities, the daily weight gain
(0.23g/day) and survival rate (90.03%) of knife fish at 10 fingerling/m² were higher
than stocking density of 20 fingerling/m² (0.16 g/day and 55.20% ).
4
2.3 Nutritional characteristics
According to Heming and Budington (1988), the knife fish is an canivorous
species. After hatching about 3-4 days, this species fed with small food size
including: commercial feed with small size, phytoplankton, zooplankton, soybean,
etc. The digestive system of Chitala chitala has including: mouth, gullet, stomach,
gut. The ratio between gut length and body length of 30 old days was Li < 1 (Tran
Thi Thanh Hien et al., 2007). The clown knife fish ate fresh foods, insects,
crustaceans, artificial feed (Le Ngoc Dien, 2004). In addition, the stomach of knife
fish contains 25.09% of crustaceans and 17.41% of trash fish (Hossain et al., 1990).
More than 20 days old, clown knife fish could feed commercial feed such as sinking
or floating feed and survival rate of fish to 30 old days was not stable, especially
using commercial feed for hatching. The survival rate of fish was 74 % (Tran Thi
Thanh Hien, 2008; Nguyen Trung et al., 2000).
Several studies on body structure of fish have been conducted as: mouth site,
teeth and size of mouth which can know clearly about natural food types and
catching the bail characteristic of fish (Pillar, 1952- cited by Pham Thanh Liem and
Tran Dac Dinh, 2004).
The growth rate was important factor that could determine nutrient
requirement of aquatic animals. The fish would grow fast if they ate enough about
quantity and quality of food and suitable food types. Conversely, if fishes ate
unsuitable food types, fishes would grow slowly or death (Tacon, 1990).
The clown knife fish can attack others fish when they feel hungry. In
addition, the fish was also shocked by the fluctuation of water quality parameters or
changing food suddenly that they did not consume or could be infected by disease to
death. Therefore, during culture, environmental condition and food should be not
change suddenly; the fish should be weaned with new food and feed punctually
(Nguyen Chung, 2006).
5
The growth and survival of early stage of Chitala chitala were studied with
several different type diets as red worm (turbifex) and fresh fish eggs, zooplankton
in both culture systems (nylon hapa and tank). Fishes accepted all types of diets in
experiment rearing with high survival rate (Sarkar et al., 2006).
2.4 Study of commercial feed utilization for clown knife fish culture
and other species
Using fresh food for nursing from fry was got difficulties due to fresh food
contains pathogen and couldnot initiative food source. Therefore, the period time
determination of commercial feed utilization and artificial feed types was studied
more for most of fish species. There were some researches and results in fry stage of
many fish species including: Clarias gariepinus, Coregonus sp., Cyprinus carpio (
Appelbaum et al., 1988; Bergot et al., 1986; Charlon et al., 1986) but some
researches also limited with carnivorous fish species.
According to Preson – le Ruyet et al. (1995), Watanable and Kiron (1994)
researched on using commercial feed for fry stage was early that was cause of low
survival rate and growth slowly. Presently, this stage of fish has not yet stomach and
digestive enzyme or artificial fish did not stimulate fish catching or decreasing
amount of feed intake of fish (Muran et al., 1990; Person-le Ruyet et al., 1993).
The clown knife fish fry usually ate natural food such as phytoplankton,
zoobenthos after using all yolk sac (Tran Ngoc Nguyen et al., 2000). The fishes
grew more than 20 old days, they could feed artificial feed. However, the natural
food could not lack in hatching and culturing, especially it was important for first
time of using artificial feed. Survival rate of clown knife fish fingerlings was higher
when using artificial feed (74%), formulated feed combined with red worm (82.7%91.3%) (Tran Thi Thanh Hien and Nguyen Huong Thuy, 2008). According to the
study on Micropterus dolomieui (Ehrlich et al., 1989), Clarias macrocephalus
(Fermin et al., 1991) were carried out that using a combination of 50% trash fish
6
and 50% pellet feed for nursing was efficiency than using all commercial feed.
Survival rate and growth of fish were improved when apply those feed.
According to Phan Quoc Thu (2009), the growth of clown knife fish rearing
in the hapas feeding fed 50% trash fish and 50% commercial feed was lower than
feeding commercial feed of fish. However, survival rate of fish in both experiment
was not significant different. Amount of trash fish was replaced increasing by
commercial feed that affected to the growth of fish.
The clown knife was hatched and reared by using trash fish. Besides that,
Chitala chitala was also accepted pellet feed with different protein levels such as
25-30% protein for hatching, 20-25% protein for culturing and their daily weight
gain was also increase, but using homemade feed as 50% pellet feed with 20%
protein and 50% trash fish was used and the daily weight gain was increase better
the growth and survival (Le Ngoc Dien, 2004).
The survival rate of clown knife fish was not affected by different protein
levels. The daily weight gain of fish fed protein levels from 40.3% to 65.7% was
from 0.53 to 0.9 g/day, respectively (Ho Duc Toan, 2011). According Le Thi Thuy
Trang (2012), the growth of fish fed high protein level (40%) was 17.68 and
increased higher than fish fed low protein level (30%). In addition, the survival rate
of fish was not affected by using commercial feed with different protein levels.
7
Chapter III
RESEARCH METHODOLOGY
3.1 Experimental site
Experiment was set up at freshwater aquaculture lab, College of Aquaculture
and Fishery.
3.2 Materials
Fish seed: the clown knife fishes were same size, good healthy and no
disease. Fishes were weaned commercial feed before conducting experiment. The
mean initial weight of fish was 60 ± 5 g/individual. Density with 15 individual was
stocked into 250L composite tank
Feed source:
Different types of commercial pellet feed were used (homemade feed with
40% protein, Cavang (goldfish), Tongwei) which were the similar protein
(40% protein)
One type of feed was trash fish (marine fish)
Table 3.1 Proximate composition of dietary (dry matter)
Feed
CP
≥ (%)
CL
≥ (%)
Moisture
≤ (%)
Size
mm
A diet
40
5
11
6
B diet
40
6
11
4
C diet
40
6
9
6
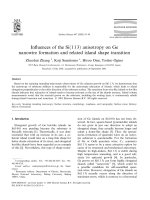
Experimental tools:
12 composite tanks: 250 L each
Water resource: tap water, recirculation system
Test kit: DO, TAN, pH and nitrite
Chemical: Chlorine, salt
8
Electric balance (1 g), aerator system, net, tray
3.3 Experimental design
Experiment was conducted in composite tank system. Each tank had aerated
and supplied water continuously. Before experiment was carried out, tank system
had been treated by 1 kg of salt and wash by clean water.
Experiment was carried out in 8 weeks. Fish was sampled randomly with 15
individuals / tank. The experiment had 3 treatments of different pelltes(Tongwei,
Cavang (goldfish) and homemade with 40% protein were called A, B and C diet)
and the control treatment (marine fish) with three replications for each treatment.
Figure 3.1 Marine fish
9
Figure 3.2: The composite tank system (250L/tank) for experiment
3.3.1 Experimental management
During experiment, the experimental fish were fed two times per day (7am
and 4pm). The fish activity was daily observed such as swimming, feeding. Siphon
bottom of tank and remove wastes out and uneatten feed with 2 days/time. Each
tank had aerator continuously.
3.3.2 Data collection and analysis
Fish was cultured in tanks for 8 weeks. Water quality parameters as pH,
nitrite, TAN and DO were measured as follows:
Nitrite: be measured biweekly at 7 am by using sera test kit
Total Ammonium nitrogen: be measured biweekly at 7 am by using
sera test kit
pH: be measured biweekly at 7 am by pH meter
Temperature: be measured biweekly at 7 am by dipping a mercury
thermometer into the water surface.
3.3.2.1 Evaluation of growth parameters
Fish growth performance was determined biweekly by all weighing
10
-Specific growth rate (%/day)
SGR= (lnWf – lnWi)*100/t
Wi: mean initial fish weight (g)
Wf: mean final fish weight (g)
-Daily weight gain (g/day)
DWG= (Wf – Wi)/ t
Wi: mean initial fish weight (g)
Wf: mean final fish weight (g)
t: cultured period (day)
3.3.2.2 Survival rate (%)
During the experiment, the mortality rate of fish was recorded.
Number of fish at stocking
SR=100*
Number of fish at harvest
3.3.2.3 Feed utilization
- FCR: food conversion ratio
FCR= dry food fed/ wet weight gain
- FCE: food conversion efficiency
FCE = 1/ FCR
- PER: protein efficiency ratio
PER= weight gain/ protein intake
Protein intake = feed intake * crude protein (%) in feed
- FI: feed intake (g/ fish/ day)
FI= dry feed intake/ fish/ t
t: cultured period (day)
11
3.3.2.2. Proximate composition feed and fish
The flesh was collected and 2 times: at stocking and harvesting fish for
analysis. The proximate analysis of experimental diet and fish were analyzed by the
following methods:
+ Moisture: the sample was dried in the oven at 105ºC for 4 hours and
weighing the sample.
+ Crude protein (CP): analyzed by using the Kjeldahl method
+ Crude lipid (CL): analyzed by Soxhlet method with Chloroform solution.
The lipid in the sample was extracted perfectly from chloroform washing.
+ Ash: was determined by weighing a dry subsample in a preweighed
procelain crucible for 8 hours at 600ºC.
3.3.2.5 Data analysis
Mean value of treatments were statistically analyzed using one way ANOVA
through SPSS version 16.0. The mean among the treatments were significantly
compared at p< 0.05 by Duncan Test.
12
CHAPTER IV
RESULTS AND DISCUSSION
4.1. Water quality in experimental tanks
4.1.1 Water temperature
Table 4.1 The fluctuation of water temperature (ºC) during culture periods
Sampling time
T1
T2
T3
T4
1
29±0
29±0
29±0
29±0
2
29±0
29±0
29±0
29±0
3
27±0
27±0
27±0
27º±0
4
28±0
28±0
28±0
28±0
The temperature in the experimental tanks fluctuated from 27ºC to 29ºC. At
the first and second sampling time, the temperature was 29ºC, and higher than that
at third and fourth sampling time. The water temperature is one of the important
factors that affects on the growth. According to Truong Quoc Phu (2006), the water
temperature from 20ºC to 30ºC was suitable for optimal growth of fish.
13
4.1.2. pH in the experiment
Table 4.2 The fluctuation of pH in experimental tanks
Sampling time
T1
T2
T3
T4
1
7.5±0
7.5±0
7.5±0
7.5±0
2
8.2±0
8.2±0
8.2±0
8.2±0
3
8.2±0
8.2±0
8.2±0
8.2±0
4
8.5±0
8.5±0
8.5±0
8.5±0
pH in the water fluctuated from 7.5 to 8.5. At the first sampling time, water
pH was 7.5. From the second sampling time to the end of experiment period pH
increased to 8.5. pH fluctuation went up due to break up of feed or feces of fish into
water. However, the water pH were in suitable ranges (6.5- 9) for optimal growth of
knife fish (Truong Quoc Phu, 2006). Comparison with the study on different protein
levels in homemade feed for Chitala chitala culture conducted by Ho Duc Toan
(2011), pH in experimental tanks was 7.5 and lower than the present study.
4.1.3 Dissolved oxygen, total ammonium nitrogen and nitrite
(mg/L)
During experimental periods, the tank system was supplied enough oxygen
by aeration. Therefore, the DO in all tanks did not fluctuate, and was 5 mg/L.
According to Truong Quoc Phu (2006), the optimal of dissolved oxygen for fish
growth were 5 mg/L. DO in during experiment periods was maintained higer than
5mg/L for growth of clown knife fish.
Nitrite content was not much fluctuated among treatments. The nitrite values
varied from 0.05 mg/L to 1 mg/L and was suitable for fish growth. According to
14
Boyd (1990), TAN concentration was 0.6 to 2mg/L that was toxic for aquatic
animal. Therefore, the result of TAN was in suitable range for optimal fish growth.
Table 4.3 The fluctuation of TAN (mg/L) and NO2- (mg/L) at different sampling
time
SAMPLING
first time
second time
third time
fourth time
14 days
28 days
42 days
56 days
TIME
TREATMENT
NO2-
TAN
NO2-
TAN
NO2-
TAN
NO2-
TAN
T1
0.05
1
0.5
0.5
0.5
0.05
0.5
0.05
T2
0.05
1
0.5
0.5
0.5
0.05
0.5
0.05
T3
0.05
1
0.5
0.5
0.5
0.05
0.5
0.05
T4
0.05
1
0.5
0.5
1
0.13
0.83
0.1
4.2 Survival rate
Table 4.4 Survival rate of clown knife fish after 8 weeks
TREATMENT
Survival rate (%)
T1
84.4±5.88bc
T2
75.6± 2.22c
T3
95.6± 2.22ab
T4
97.8± 2.22a
Note: values are mean±SD. Mean within a column followed by different letters is
significantly different at p<0.05.
15
The survival rate of all treatments fluctuated from 75.6% to 97.8% (Table
4.4). During the experiment period, the survival rate of treatment 4 was the highest
and significant difference with the treatment 1 and 2 (p<0.05). The survival rate of
fish in the treatment 2 was the lowest. The survival of treatment 3 was no significant
difference with treatment 4. However, there was significant difference with the
treatment 2. Besides, the survival of the treatment 1 was no significant difference (p
< 0.05) with the treatment 2 and 3 but it was significant difference with the
treatment 4 (p < 0.05).
In fact, disease factor was also one of causes that affected to fluctuation of
survival. In the treatment 1 and 2, survival went down 75.6% and 84.4% (table 4.4)
due to parasites and fungus occurred and infected to experimental fish. The survival
rate of treatments using different commercial feed of the present study was lower
than the result of Le Thi Thuy Trang (2012), the survival rate of Clown knife fish
fed different protein content was range 96,7% to 100%. Furthermore, the study on
determination protein requirement of knife fish with size 2-3 g/ fish was 68,9 84,4% of survival rate (Nguyen Thi Thuy Kieu, 2011). In addition, the survival rate
of Chitala chitala fed different pellets feed was lower than the result of Ho Duc
Toan (2011), the control fed trash fish was 98.3%. However, those results was
higher than the study on clownknife culture in hapa of La Anh Nguyet (2008), the
survival of fish was 70% in treatment using trash fish and 77% in treatment fed
commercial feed.
16