- Trang chủ >>
- Khoa Học Tự Nhiên >>
- Vật lý
Influences of the si(1 1 3) anisotropy on ge nanowire formation and related island shape transition
Bạn đang xem bản rút gọn của tài liệu. Xem và tải ngay bản đầy đủ của tài liệu tại đây (290.38 KB, 7 trang )
Influences of the Sið113Þ anisotropy on Ge
nanowire formation and related island shape transition
Zhaohui Zhang
1
, Koji Sumitomo
*
, Hiroo Omi, Toshio Ogino
NTT Basic Research Laboratories, 3-1 Morinosato Wakamiya, Atsugi, Kanagawa 243-0198, Japan
Received 11 July 2001; accepted for publication 26 September 2001
Abstract
Based on the scanning tunneling microscopy observations of Ge coherent growth on Si(1 1 3), we demonstrate that
the anisotropy of substrate stiffness is responsible for the anisotropic relaxation of islands, which leads to island
elongation perpendicular to the softer direction of the substrate surface. The transition from wire-like islands to dot-like
islands indicates that relaxation of islands tends to become isotropic as the size of the islands increase. Island volume
measurements reveal that the material grown on the substrate, including the wetting layer, is continuously rebuilt
during island formation and transition. Ó 2001 Elsevier Science B.V. All rights reserved.
Keywords: Scanning tunneling microscopy; Surface structure, morphology, roughness, and topography; Surface stress; Epitaxy;
Silicon; Germanium
1. Introduction
Elongated growth of Ge hut-like islands on
Si(1 0 0) was puzzling because the substrate is
biaxially isotropic [1]. Theoretically, it was dem-
onstrated that with an increase in its size, a co-
herent island would take on a long thin shape for
better elastic relaxation of its stress, and elongated
hut-like islands have been regarded as an example
of this [2]. Nevertheless, this type of shape transi-
tion of Ge islands on Si(1 0 0) has not been ob-
served. In fact, square-based pyramid-like islands
do not grow in just one direction to adopt an
elongated shape, they actually become larger and
adopt a dome-like shape [3]. Thus, the sponta-
neous formation of quantum wires on an isotro-
pic substrate is questionable. For the formation
of Ge or GeSi quantum wires, C
1v
symmetry
Si(1 1 3) seems to be a more attractive option be-
cause of its structural and mechanical anisotropy.
Despite its high-indices, Si(1 1 3) is stable during
high temperature annealing, and is a good sub-
strate for epitaxial growth [4]. In particular,
Ge grown on Si(1 1 3) can form highly elongated
islands called ‘‘nanowires’’ [5], which could be
a possible candidate for self-assembled quan-
tum wires. However, elongation of Ge islands on
Si(1 1 3) actually occurs along the direction of
maximum stress, which is contrary to a theoretical
Surface Science 497 (2002) 93–99
www.elsevier.com/locate/susc
*
Corresponding author. Tel.: +81-462-40-3457; fax: +81-
462-40-4718.
E-mail address: (K. Sumi-
tomo).
1
Permanent address: Department of Physics, Mesoscopic
Physics National Laboratory, Peking University, Beijing
100871, China.
0039-6028/01/$ - see front matter Ó 2001 Elsevier Science B.V. All rights reserved.
PII: S 00 39 - 6 0 2 8 ( 0 1) 0 1 6 2 9- 6
expectation that when epitaxial stress is aniso-
tropic, a coherent island should align itself per-
pendicular to the direction of maximum stress [6].
So, it is interesting to investigate the mechanism of
elongated growth of an island on an anisotropic
substrate.
Previous studies of Ge nanowire formation on
Si(1 1 3) were based on atomic force microscopy
(AFM) observations [5]. Because the observations
were ex situ and the AFM resolution was not good
enough, the growth morphology of the surface
could not be unambiguously determined, and
therefore the formation mechanism of the nano-
wires could not be well understood. With help of
scanning tunneling microscopy (STM), we have
carefully observed the as-grown surfaces of Ge on
Si(1 1 3) in situ on an atomic scale, and we have
found new evidences for understanding the nano-
wire formation and related island transition. Here
we demonstrate that the anisotropy of the Si(1 1 3)
substrate stiffness plays an important role in the
formation of Ge nanowires and that the island
transition from a wire-like to a dot-like one is ac-
tually caused by a transition of island relaxation
from anisotropy to isotropy.
2. Experimental
Experiments were carried out in an ultrahigh
vacuum STM system equipped with epitaxial
growth facilities. Samples were cut from a Si(1 1 3)
wafer (P doped, 1–10 X cm) with a misorientation
towards the ½
1110 direction of less than 0:2°.Ge
deposition at 1.4 ML/min, where 1 ML is defined
as 8: 2 Â 10
14
atoms/cm
2
, was conducted using a
Knudsen cell, and the growth temperature was set
at 430 °C in order to favor nanowire formation [5].
The base pressure of the system was lower than
1 Â 10
À10
Torr; and during substrate preparation
and Ge deposition the pressure typically remained
lower than 5 Â 10
À10
Torr. Ge deposition was moni-
tored using reflection high-energy electron dif-
fraction. The morphology of each grown surface
was observed using STM, and a sample voltage of
2 V and tunneling current of 0.1 nA were typically
used.
3. Results and discussion
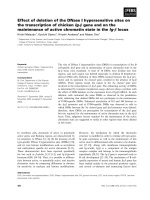
Our STM observations are consistent with
previous reports [4,5] in that after $5 ML two-
dimensional growth of a wetting layer, three-
dimensional islanding began. As shown in Fig. 1a,
the islands already appear elongated along the
½33
22 direction with widths of $20 nm at the initial
nucleation stage. Increasing the Ge coverage by
half a ML causes the elongated islands to become
several hundreds of nm long while their widths
did not increase, as shown in Fig. 1b. This
growth morphology leads one to employ the term
‘‘nanowires’’. Further increasing the Ge coverage
by another half a ML causes the wires to reach
their maximum density, as can be seen in Fig 1c.
STM images on an atomic scale indicate that the
wires extend in ½33
22 and ½
33
332 directions with
(2 4 9)/(4 2 9) side facets near their ends and that
they thicken with (1 5 9)/(5 1 9) side facets, but their
ends are not faceted. The (2 4 9)/(4 2 9) facets are
tilted at an angle of 8° with respect to the substrate
surface, and the (1 5 9)/(5 1 9) facets are tilted at an
angle of 16° . All the islands have a (1 1 3) top facet.
Theoretical calculations indicated that there
exists a strain energy concentration around a co-
herent island at its base edges, which results from
relaxation of the island and acts as an energy
barrier to limit the lateral growth of the island
[7,8]. Through experiments it was shown that this
strain energy concentration could be relieved by
the formation of trenches around the island [9].
As demonstrated above, the growth of wires is
strongly limited laterally in the ½
1110 direction.
Checking the surface around the wires, we were
unable to find any depression at their two ends;
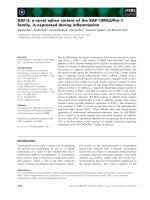
however we did observe depressions beside their
base edges along the ½33
22 direction. Such as the
wire-like island that is pointed out by an arrow in
Fig. 1b, from its end on, the surface on the both
sides first becomes 1 ML lower and then 2–3 ML
lower, which can be determined by checking the
sectional profiles such as along A–B and C–D as
shown in Fig. 2. Despite the depressions, there is
indication of a significant strain field beside the
wires because the wires never contact each other
laterally, but do interfere with one another, which
causes the interruption of some wires, as can be
94 Z. Zhang et al. / Surface Science 497 (2002) 93–99
seen in Fig. 1c. All of these observations lead to
the conclusion that relaxation of the islands at this
growth stage is dominant, in the ½
1110 and ½1
110
directions. Island growth in these two directions is
therefore self-limited because energy barriers at
their base edges. Height growth of the islands
seems to be kinetically limited at this growth stage,
as has been generally expected [2]. Thus length
growth of the islands is dominant in the formation
of ‘‘nanowires’’ along the ½33
22 direction.
The compressive stress in a flat Ge film on
Si(1 1 3) along ½33
22 is 9% larger than it is along
½
1110 [6]. The observed orientation of the nano-
wires is therefore contrary to Tersoff and Tromp’s
prediction that when epitaxial stress is anisotropic,
a coherent island should align itself perpendicular
to the direction of maximum stress [2]. To clarify
this controversy, we follow Tersoff and Tromp to
estimate the relaxation energy of the Ge wires on
Si(1 1 3). Let r
x
and r
y
stand for the bulk stress
in the ½
1110 and ½33
22 directions, respectively, of
a flat Ge film that is uniformly strained to the Si
substrate. Epitaxial contact of an island to the
substrate, which is assumed to be strained in
the same way as the film, may be estimated by the
distribution of a point force r
x
tan h
x
in the ½
1110
direction and r
y
tan h
y
in the ½33
22 direction, where
h
x
and h
y
are the facet angles with respect to the
substrate surface. Within an elastic range of the
material, the resulting displacements of the sub-
strate surface can be estimated using Hooke’s law,
and therefore the work done by the point force is
Fig. 1. STM images of Ge island growth on Si(1 1 3) at 430 °C for a total coverage of (a) 5.2 ML, (b) 5.7 ML, and (c) 6.2 ML, re-
spectively. The three images are all 250 Â 500 nm
2
in size. The directions marked in (a) are common to (a)–(c).
Fig. 2. The sectional line profiles of nanowires as marked A–B
and C–D in Fig. 1(b).
Z. Zhang et al. / Surface Science 497 (2002) 93–99 95
estimated to be ðr
x
tan h
x
Þ
2
=E
x
and ðr
y
tan h
y
Þ
2
=E
y
in the ½
1110 and ½33
22 directions with E
x
and E
y
of
the Young’s modulus of the substrate concerned in
these two directions, respectively. As the total re-
laxation energy of the island is determined by an
integral of the work of the point force over the
epitaxial contact area, relaxation of the island is
therefore not only dependent on the stress of the
island, but also on the substrate stiffness and the
island shape. Unfortunately, Tersoff and Tromp
did not pay attention to the substrate anisotropy
in stiffness but assumed the same angles of island
facets with respect to the substrate surface for an
anisotropic substrate.
The Young’s modulus of the substrate along
½
1110 is 9% lower than it is along ½33
22 [6]. Fur-
thermore, the wires are faceted on both sides with
the (2 4 9) or (1 5 9) at an angle of 8° or 16° with
respect to the substrate surface, but their ends
gradually decrease to wet the surface, forming
contact angles smaller than 2° but no defined
facets, according to our measurements. As a result,
the work of the point force in the ½
1110 direction is
actually much larger than it is along the ½33
22 di-
rection, and the observed elongation of the islands
is therefore more favorable for island relaxation.
Besides, surface energy of a well-defined defined
facet is obviously lower than that of an unfaceted
one. Thus, compared with their unfaceted end fa-
ces the observed elongation of islands with a larger
area of the (2 4 9) or (1 5 9) facets indicates a lower
surface energy of the islands. So, the observed is-
land elongation along the direction of maximum
stress is actually energetically favorable. Never-
theless, the wire-like shape of the islands is never
an equilibrium configuration, which will be seen in
their shape transition displayed below. So, the
observed wire-like shape of the islands is just
metastable.
Formation of the 3D nanowires can be traced
back to Ge growth of 2D islands. Knall and
Pethica suggested that a 2 Â 2 structure consisting
of dimers and rebounded adatoms make it more
energetically favorable to relax the 2D island along
the ½
1110 direction than along the ½33
22 direction
[4]. From our STM observations of high resolu-
tion, this suggestion can be further strengthened
with another 2 Â 2 model, which consists of
alternating rows of subsurface interstitials and
rebounded adatoms along the ½
1110 direction [10].
So, from the beginning of 3D islanding the islands
already relax more towards the ½
1110 than towards
the ½33
22. As we mentioned above, the surface
stiffness of the substrate along ½
1110 is 5% smaller
than it is along ½33
22, while the compressive stress
in a flat Ge film on Si(1 1 3) along ½33
22 is 9%
larger than it is along the ½
1110. It seems confusing
why the islands always prefer to relax along the
½
1110. In fact, as has been seen in the estimation
of the point force work, the surface stiffness acts
directly but the point force may be a function of
the stress and an island shape. Relaxation of an
island is therefore competitive along these two
directions. Since a 2D island already relaxes pref-
erably along the ½
1110 direction, in the case of Ge
growth on Si(1 1 3), Ge islands may naturally first
relax towards the softer direction of the substrate,
which induces more compression at ½
1110 base
edges of islands than their ½33
22 base edges. The
Ge nucleation is therefore suppressed at the ½
1110
base edges but favored at the ½33
22 base edges,
forming an elongated island shape perpendicular
to the softer direction of substrate stiffness.
Wire-like growth of the islands proceeds within
a Ge coverage of $6.2 ML. For further Ge de-
position, the wire compact surface, as shown in
Fig. 1c, acts as a new precursor. We have observed
that new islands form on the wires and then the
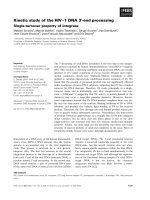
wires disappear. As shown in Fig. 3a, the thinner
features indicate the remaining wires and the
thicker features indicate the newly formed islands.
These new islands are elongated in the same ori-
entation as the wires, but are much shorter than
the wires. For simplicity, we refer to this type of
island as an elongated island. In contrast to wires,
all of the side faces of elongated islands are faceted
with (1 5 9)/(5 1 9) at an angle of 16° with respect to
the substrate surface, their ½33
22 ends are faceted
with (15 3 17), (1 1 1) and (3 15 17) at the angles of
24°,30° and 24°, respectively, and their ½
33
332 ends
are faceted with (5 1 7) and (1 5 7) at the angle of
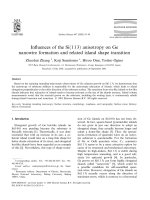
20°, as shown in Fig. 4b. In successive growth, the
elongated islands become regular in size and dis-
tribution, as can be seen in Fig. 3b and c. Mean-
while, the ½
33
332 ends of the elongated islands split
into ‘‘dot-like islands’’, as marked by arrows in
96 Z. Zhang et al. / Surface Science 497 (2002) 93–99
Fig. 3b and c. The dot-like islands adopt the facet
structure of the elongated islands by simply re-
placing the (1 5 9)/(5 1 9) facets with the (1 7 11)/
(7 1 11) at an angle of 19° with respect to the
Fig. 3. STM images of Ge island growth on Si(1 1 3) at 430 °C for a total coverage of (a) 6.7 ML, (b) 7.2 ML, and (c) 8.2 ML, re-
spectively. The three images are all 250 Â 500 nm
2
in size. The directions marked in (a) are common to (a)–(c).
Fig. 4. STM images showing the facets of (a) the wire-like islands, (b) the elongated islands, and (c) the dot-like islands.
Z. Zhang et al. / Surface Science 497 (2002) 93–99 97
substrate surface. They grow bigger and higher at
a fixed lateral aspect ratio near 1, as can be seen in
Fig. 4c. Some of dot-like islands grow larger and
finally become dislocated islands, which we ob-
served when the Ge coverage was larger than 9
ML.
Fig. 5 shows the average width, height, length,
and number density along ½
1110 of the wires and
elongated islands versus the Ge coverage. Growth
of the wires is clearly characterized by an increase
in the island length and the number density. The
width of the island is $20 nm and the height of
the island is $1.5 nm. In comparison, growth of
elongated islands mainly proceeds via increases in
island height. As they grow higher up to an aver-
age value of $3.5 nm, their lengths average to
$120 nm, but their widths are limited to $30 nm.
Moreover, the deposited material is condensed on
the ½
33
332 ends of elongated islands to form dot-
like islands.
Obviously, islands tend to lose their elongation,
become higher, and their edge facets become
steeper during shape transition. This type of
shape transition is a more favorable condition for
strained islands to relax. In particular, the config-
urations of the island ends indicate significant re-
laxation of the islands along their elongation
direction while the formation of dot-like islands at
the elongated island end of the ½
33
332 direction
implies that relaxation of the islands is easier along
the ½
33
332 direction than the ½33
22 direction. As a
result of the enhanced energy barriers at the base
edges, elongated growth of the islands tends to
become self-limited in the same way as their lateral
growth does. The resulting strain field around the
islands is obvious in that with continuous growth
the islands become more regular in size and dis-
tribution and their number density decreases, as
shown in Figs. 3 and 5. In growth kinetics it is
unfavorable for diffusing atoms to attach them-
selves to the top of islands because as we have
seen, there is a height limit to wire-like growth.
However, as Ge coverage increases, the enhanced
interaction between the islands and the substrate
surface tends to drive atoms to diffuse onto the
islands, forming a more energetically stable island
shape with less elongation.
Island shape formation of Ge on Si(1 0 0) has
been explained as being the energy-minimization
of strained islands [3]. Nevertheless, it has been
demonstrated that minimum-energy configuration
of the islands is unnecessary, and that shape
transition occurs due to coarsening during growth
[11]. In the case of Ge growth on Si(1 1 3), the is-
lands are energetically favorable within some ki-
netic limits and may be metastable. Stability of the
islands increases as island elongation decreases.
However, in the end, no island is absolutely stable
against shape transition to a dislocated island.
Complete transition of the wires to the elongated
islands took less than 40 s during the deposition
for less than 1 ML, as can be seen in Figs. 1c to 3b.
In comparison, the transition from elongated is-
lands to dot-like islands was much slower. Within
the limited time available for 10 ML Ge to be
deposited, we observed the coexistence of elon-
gated, dot-like, and dislocated islands. We also
conducted coarsening experiments at a Ge cover-
age of 6.2 ML by stopping the Ge deposition but
maintaining the substrate temperature. As a result,
the wire-like islands, as shown in Fig. 1c, almost
completely changed into elongated islands within
25 s. However, afterwards the shape transition to
Fig. 5. Changes in the average width, height, length, and
number density along ½
1110 of the wire-like islands (open cir-
cles) and the elongated islands (solid circles) with increasing Ge
coverage, as measured from STM images on a large scale of $1
lm.
98 Z. Zhang et al. / Surface Science 497 (2002) 93–99
dot-like and dislocated islands took more time
than it did during the growth period. Moreover,
after annealing the sample at 500 °C or higher
temperatures, most of the islands became either
dot-like islands or a combination of dot-like and
dislocated islands.
Volume measurements of each type of island
demonstrate that the shape transition of the is-
lands proceeds via mass transport. Interestingly,
we also found that during growth of up to 7 ML
the total island volume increased at a rate ap-
proximately three times that of the deposition rate,
followed by increases in the deposition rate. This
indicates that after 3D growth begins there is also
a mass transport from the wetting layer to the is-
lands. Fig. 6 shows fractional coverage of the
wetting layer and each type of island. The thick-
ness of the wetting layer was determined by sub-
tracting the total island volume from the amount
of Ge deposited. Like the islands, the volume of
the wetting layer increases up to a maximum value
and then decreases. Mass transport from the wet-
ting layer to the islands may be driven by the
difference in the chemical potential between the
wetting layer and the islands, as previously pre-
dicted [12]. On the other hand, the surface mor-
phology changes like depressions, as shown in Fig.
1b, beside the wire-like islands indicate that the
mass transport process is enhanced by interaction
between the islands and the wetting layer.
4. Summary
In summary, depending on island relaxation, the
interaction between the islands and the wetting
layer influences growth kinetics so that islands
tend to form lower strain energy configurations
as the amount of deposited material increases.
Dominant island relaxation along the softer di-
rection of the Ge/Si(1 1 3) surface leads to elongated
growth of the islands along the perpendicu-
lar direction, which in turn forms ‘‘nanowires’’.
This only occurs, however, when the height growth
is kinetically limited. Higher island growth induces
island relaxation along the direction of island
elongation, which in turn causes the formation of
‘‘elongated islands’’ and ‘‘dot-like islands’’. Dur-
ing island shape transition, the material grown on
the substrate is continuously rebuilt to more
effectively release the accumulated strain energy.
Acknowledgements
The authors would like to thank D. J. Bottom-
ley and T. Fukuda for their fruitful discussion.
References
[1] Y W. Mo, D.E. Savage, B.S. Swartzentruber, M.G.
Lagally, Phys. Rev. Lett. 65 (1990) 1020.
[2] J. Tersoff, R.M. Tromp, Phys. Rev. Lett. 70 (1993) 2782.
[3] G. Medeiros-Ribeiro et al., Science 279 (1998) 353.
[4] J. Knall, J.B. Pethica, Surf. Sci. 265 (1992) 156.
[5] H. Omi, T. Ogino, Appl. Phys. Lett. 71 (1997) 2163;
H. Omi, T. Ogino, Phys. Rev. B 59 (1999) 7521.
[6] D.J. Bottomley, H. Omi, T. Ogino, J. Cryst. Growth 225
(2001) 16.
[7] Y. Chen, J. Washburn, Phys. Rev. Lett. 77 (1996) 4046.
[8] S.A. Chaparro et al., Phys. Rev. Lett. 83 (1999) 1199.
[9] S.A. Chaparro, Y. Zhang, J. Drucker, Appl. Phys. Lett. 76
(2000) 3534.
[10] P. M
€
uuller, R. Kern, Surf. Sci. 457 (2000) 229.
[11] F.M. Ross, J. Tersoff, R.M. Tromp, Phys. Rev. Lett. 80
(1998) 984.
[12] J. Tersoff, Phys. Rev. B 43 (1991) 9377.
Fig. 6. Measured fractional Ge coverage of the wetting layer
(A), the wires (B), the elongated islands (C), and the dot-like
islands (D) versus the amount of Ge deposited.
Z. Zhang et al. / Surface Science 497 (2002) 93–99 99