The big picture marcoeconomics 12e parkin chapter 01
Bạn đang xem bản rút gọn của tài liệu. Xem và tải ngay bản đầy đủ của tài liệu tại đây (117.01 KB, 11 trang )
C h a p t e r
1
WHAT IS
ECONOMICS?
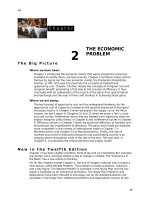
The Big Picture
Where we are going:
After completing Chapter 1, the student will have a good sense for the range of
questions that economics addresses and will be on the path towards an
economic way of thinking. The students will begin to think of cost as a forgone
alternative—an opportunity cost—and also about making choices by balancing
marginal costs and marginal benefits.
Chapter 2 reinforces the central themes of Chapter 1 by laying out a core
economic model, the production possibilities frontier (PPF), and using it to
illustrate the concepts of tradeoff and opportunity cost. Chapter 2 also
provides a deeper explanation, again with a model, of the concepts of
marginal cost and marginal benefit, beginning with the concept of efficiency,
and concluding with a review of the source of the gains from specialization and
exchange.
N e w i n t h e Tw e l f t h E d i t i o n
In all the chapters, the “Reading Between the Lines” sections are now called
“Economics in the News.” A new exciting feature is a full-page end-of-chapter
worked problem. The Worked Problem gives students an opportunity to work a
multi-part problem that covers the core content of the chapter and consists of
questions, solutions, and key figures. The answers help the students realize
whether their grasp of the material is complete or needs additional study to
reinforce it.
This important chapter is not one to gloss over as it lays down an important
foundation that can be drawn from as you move through more specific
applications later. Students relate well to the section on self and social interest
which calls out issues of both efficiency and fairness and is great for class
discussion. Economics in the News covers some current issues with Facebook and
Mark Zuckerberg’s vision to have the Internet available to the whole world.
Lecture Notes
What Is Economics?
I. Definition of Economics
•
•
Economic questions arise because we always want more than we can get, so we face
scarcity, the inability to satisfy all our wants. Everyone faces scarcity because no
one can satisfy all of his or her wants.
Scarcity forces us to make choices over the available alternative. The choices we
make depend on incentives, a reward that encourages a choice or a penalty that
discourages a choice.
Forbes lists Bill Gates and Warren Buffet among some of the wealthiest Americans. Do
these two men face scarcity? According to The Wall Street Journal, both men are ardent
bridge players, yet they have never won one of the many national bridge tournaments they
have entered as a team. These two men can easily afford the best bridge coaches in the
world and but other duties keep them from practicing as much as they would need to in
order to win. So even the wealthiest two Americans face scarcity (of time) and must choose
how to spend their time.
Economics
•
•
•
Economics is the social science that studies the choices that individuals,
businesses, governments and entire societies make when they cope with scarcity
and the incentives that influence and reconcile those choices.
Economists work to understand when the pursuit of self-interest advances the social
interest
Economics is divided into microeconomics and macroeconomics:
• Microeconomics is the study of the choices that individuals and businesses
make, the way these choices interact in markets, and the influence of
governments.
• Macroeconomics is the study of the performance of the national economy and
the global economy.
On the first day do a “pop quiz.” Have your students write on paper the answer to “What is
Economics?” Reassure them that this is their opinion since it is the first day. You will find
most of the answers focused around money and/or business. Stress that Economics is a
social science, a study of human behavior given the scarcity problem. All too often firsttime students (especially business students) think that Economics is just about making
money. Certainly, the discipline can and does outline reasons why workers work longer
hours to increase their wage earnings, or why firms seek profit as their incentive. But
Economics also explains why a terminally ill cancer patient might opt for pain medication
as opposed to continued chemotherapy/radiation, or why someone no longer in the
workforce wants to go to college and attain a Bachelor’s degree, in their sheer pleasure of
learning and understanding. Stressing the social part of our science now will help later
when relating details to the overall bigger picture (especially when time later in the
semester seems scarce, no pun intended!).
The definition in the text: “Economics is the social science that studies the choices that
individuals, businesses, governments, and societies make as they cope with scarcity and
the incentives that influence and reconcile these choices,” is a modern language version of
Lionel Robbins famous definition, “Economics is the science which studies human
behavior as a relationship between ends and scarce means that have alternative uses.”
Other definitions include those of Keynes and Marshall:
2
CHAPTER 1
John Maynard Keynes: “The theory of economics does not furnish a body of settled
conclusions immediately applicable to policy. It is a method rather than a doctrine, an
apparatus of the mind, a technique of thinking, which helps it possessors to draw correct
conclusions.”
Alfred Marshall: “Economics is a study of mankind in the ordinary business of life; it
examines that part of individual and social action which is most closely connected with the
attainment and with the use of the material requisites of wellbeing.”
A “shorthand” definition that resonates with students is: “Economics is the study of
trying to satisfy unlimited wants with limited resources.” Students can—and do—easily
abbreviate this definition to “unlimited wants and limited resources,” which captures an
essential economic insight.
II. Two Big Economic Questions
How do choices wind up determining what, how, and for whom goods and services
are produced?
What, How and For Whom?
•
•
•
•
Goods and services are the objects that people value and produce to satisfy
human wants. What we produce changes over time—today we produce more MP3s
and CDs than 5 years ago.
Goods and services are produced using the productive resources called factors of
production. These are land (the “gifts of nature”, natural resources), labor (the
work time and work effort people devote to production), capital (the tools,
instruments, machines, buildings, and other constructions now used to produce
goods and services), and entrepreneurship (the human resource that organizes
labor, land, and capital).
The quality of labor depends on human capital, which is the knowledge and skill
that people obtain from education, work experience, and on-the-job training.
Owners of the factors of production earn income by selling the services of their
factors. Land earns rent, labor earns wages, capital earns interest, and
entrepreneurship earns profit.
Do Choices Made in the Pursuit of Self-Interest also promote the social interest?
•
•
•
You make a choice in your self-interest if you think that choice is the best one
available for you.
An outcome is in the social interest if it is best for society as a whole.
A major question economists explore is “Could it be possible that when each of us
makes choices in our self-interest, these choices are in the social interest?’
The Two Big Economic Questions
Don’t skip the questions in a rush to get to the economic way of thinking. Open your
students’ eyes to economic in the world around them. Ask them to bring a newspaper to
class and to identify headlines that deal with stories about What, How, and For Whom. Use
Economics in the News Today on your Parkin Web site for a current news item and for an
archive of past items (with questions). Pose questions but hold off on the answers letting
them know that “we can have a much more fruitful discussion when our toolbox is full.”
Remind them that this course is about learning simple economic models that provide tools
to seek answers to complex issues.
Students (and others!) often take the answers to the what, how, and for whom questions for
granted. For instance, most of the time we do not bother to wonder “How does our economy
determine how many light bulbs, automobiles, and pizzas to produce?” (what), or “Why
does harvesting wheat from a plot of land in India occur with hundreds of laborers toiling
W H AT I S E C O N O M I C S ?
with oxen pulling threshing machines, while in the United States, a single farmer listening to
a Garth Brooks CD and sitting in an air-conditioned cab of a $500,000 machine harvests the
same quantity of wheat from the same sized plot of land?” (how), or “Why is the annual
income of an inspiring and effective grade school teacher much less than that of an
average major-league baseball player?” (for whom). Explaining the answers to these types
of questions and determining whether the answers are in the social interest is a major part
of microeconomics.
Figure 1.1 in the textbook “What Three Countries Produce” ties in nicely with Chapter 2’s
later discussion on the PPF. Figure 1.1 also links the three questions of what, how and for
whom nicely to the component parts of those questions: goods and services, factors of
production (land, labor, capital, entrepreneurship), and incomes economic agents earn
(rent, wages, interest and profit).
•
We can examine whether the self-interested choices serve the social interest for a
variety topics:
• Globalization: Buying an iPod allows workers overseas to earn a wage and
provide for family
• Information-Age Monopolies: A firm producing popular software leads to format
standards
• Climate Change: Carbon dioxide emissions led to higher global temperatures and
climate change
• Financial Instability: Bank bailouts with the intent of social interest may cause
more risky loans to be made in the future by banks serving their own selfinterests.
III. Economic Way of Thinking
Scarcity requires choices and choices create tradeoffs.
What is the difference between scarcity and poverty?
Ask the students why they haven’t yet attained all of their personal goals. One reason will
be that they lack sufficient money. Ask them if they could attain all of their goals if they
were as rich as Bill Gates. They quickly realize that time is a big constraint—and the great
leveler: we all have only 24 hours in a day. They have stumbled on the fact that scarcity,
which even Bill Gates faces, is not poverty.
A Choice is a Tradeof
•
•
A tradeof is an exchange—giving up one thing to get another.
Whatever choice you make, you could have chosen something else.
Virtually every choice that can be thought of involves a tradeoff. Presenting a few of the
following as examples can help your class better appreciate this key point:
• Consumption and savings: If someone decides to save more of his or her income,
savings can be funneled through the financial system to finance businesses new capital
purchases. As a society, we trade off current consumption for economic growth and
higher future consumption.
• Education and training: A student remaining in school for another two years to
complete a degree will need to forgo a significant amount of leisure time. But by doing
so, he or she will be better educated and will be more productive. As a society, we trade
off current production for greater future production.
• Research and development: Factory automation brings greater productivity in the
future, but means smaller current production. As a society, we trade off current
production for greater future production.
3
4
CHAPTER 1
Making a Rational Choice
•
•
A rational choice is one that compares costs and benefits and achieves the
greatest benefit over cost for the person making the choice.
But how do people choose rationally? Why do more people choose an iPhone rather
than a Windows phone? Why has the U.S. government chosen to build an interstate
highway system and not an interstate high-speed railroad system? The answers turn
on comparing benefits and costs.
Benefit: What you Gain
•
•
•
The benefit of something is the gain or pleasure that it brings and is determined by
preferences—by what a person likes and dislikes and the intensity of those
feelings.
Some benefits are large and easy to identify, such as the benefit that you get from
being in school. Much of that benefit is the additional goods and services that you
will be able to enjoy with the boost to your earning power when you graduate.
Some benefits are small, such as the benefit you get from a slice of pizza. That
benefit is just the pleasure and nutrition that you get from your pizza.
Cost: What You Must Give Up
Seeing choices as tradeoffs shows there is an opportunity cost of a choice. The
opportunity cost of something is the highest-valued alternative that must be given up to
get it. So, for instance, the opportunity cost of being in school is all the good things that you
can’t afford and don’t have the spare time to enjoy.
Students like the “Dr. Suess Version”: Opportunity cost is the thing you would have done if
you did not do what you did.
What is the Opportunity Cost of Getting a College Degree?
When the students calculate their opportunity cost of being in school, be sure they place a
value on their leisure time lost to studying on weekends and evenings. Most students are
shaken when they realize that when lost leisure time and income is included in their
calculations, the opportunity cost of a college degree approaches $200,000 or more. Don’t
leave them hanging here though. Mention that a college education does yield a high rate of
financial return over.
To ensure that people do not die of any serious side effects, the Food and Drug
Administration (FDA) requires all drug companies to thoroughly test newly developed
medicines before allowing them to be sold in the United States. However, it takes many
years to perform these tests and many people suffering from the terminal diseases these
new medicines are designed to cure will die before good new medicines are eventually
approved for use. Yet, if the FDA were to abandon this testing process, many others would
die from the serious side effects of those bad medicines that made it to market. People’s
lives will be at risk under either policy alternative. This stark example of a tradeoff reveals
the idea that choices have opportunity costs.
How Much? Choosing at the Margin
•
•
Making choices at the margin means looking at the trade-offs that arise from
making small changes in an activity. People make choices at the margin by
comparing the benefit from a small change in an activity (which is the marginal
benefit) to the cost of making a small change in an activity (which is the marginal
cost).
Changes in marginal benefits and marginal costs alter the incentives that we face
when making choices. When incentives change, people’s decisions change.
W H AT I S E C O N O M I C S ?
•
For example, if homework assignments are weighed more heavily in a class’s final
grade, the marginal benefit of completing homework assignments has increased and
more students will do the homework.
Choices Respond to Incentives
•
•
Economists take human nature as given and view people acting in their self-interest.
Self-interest actions are not necessarily selfish actions.
Self interest can be said to be in the eye of the beholder. Thus, covering the next portion on
positive versus normative analysis can be crucial to the student’s understanding how
economic agents act in their own self-interests, but perhaps not (and often not) in other’s
self-interest.
IV. Economics as Social Science and Policy Tool
Economist as Social Scientist
•
•
•
•
Economists distinguish between positive statements and normative statements. A
positive statement is about “what is” and is testable. A normative statement is
about “what ought to be” and is an opinion and so is inherently not testable. A
positive statement is “Raising the tax on a gallon of gasoline will raise the price of
gasoline and lead more people to buy smaller cars” while a normative statement is
“The tax on a gallon of gasoline should be raised.”
Economists tend to agree on positive statements, though they might disagree on
normative statements.
An economic model describes some aspect of the economic world that includes
only those features needed for the purpose at hand. Economic models describe the
economic world in the same way that a road map explains the road system: Both
focus on only what is important and both are abstract depictions of the real world.
Testing an economic model can be difficult, given we observe the outcomes of the
simultaneous operation of many factors. So, economists use the following to copy
with the problem:
• Natural experiment: A situation that arises in the ordinary course of economic
life in which the one factor of interest is different and other things are equal or
similar.
• Statistical Investigation: A statistical investigation might look for the
correlation of two variables, to see if there is some tendency for the two variables
to move in a predictable and related way (e.g. cigarette smoking and lung
cancer).
• Economic Experiment: Putting people in a decision-making situation and
varying the influence of one factor at a time to see how they respond.
Economic Model vs. the General Lee Car Model
When I was a kid, I had a plastic model car that I put together that was from Dukes of
Hazard television show (you can insert your own “model” as you’d like). Tell the students,
“Even though we all know the model car is not a “real” car, it does give us insights into
what the real car is like. You have number on the door, the confederate flag on top, the
proportions are correct and if you lift the little hood you can see what a V8 engine looks
like”. An economic model is similar in that it gives us a glimpse of reality under some
certain assumptions and although it is not reality it gives us insights about reality.
Economist as Policy Adviser
•
Economics is useful. It is a toolkit for advising governments and businesses and for
making personal decisions.
5
6
CHAPTER 1
•
For a given goal, economics provides a method of evaluating alternative solutions—
comparing marginal benefits and marginal costs and finding the solution that makes
the best use of the available resources.
The success of a model is judged by its ability to predict. Help your student’s
appreciate that no matter how appealing or “realistic looking” a model appears to be, it is
useless if it fails to predict. And the converse, no matter how abstract or far removed from
reality a model appears to be, if it predicts well, it is valuable.
Milton Friedman’s Pool Hall example illustrates the point nicely. Imagine a physicist’s
model that predicts where a carefully placed shot of a pool shark would go as he tries to
sink the eight ball into the corner pocket. The model would be a complex, trigonometric
equation involving a plethora of Greek symbols that no ordinary person would even
recognize as representing a pool shot. It certainly wouldn’t depict what we actually see—a
pool stick striking a pool cue on a rectangular patch of green felt. It wouldn’t even reflect
the thought processes of the pool shark that relies on years of experience and the right
“touch.” Yet, constructed correctly, this mathematical model would predict exactly where
the cue ball would strike the eight ball, hit opposite the bank, and fall into the corner
pocket. (You can easily invent analogous examples from any sport.)
W H AT I S E C O N O M I C S ?
Additional Problems
1.
You plan a major adventure trip for the summer. You won’t be able to take
your usual summer job that pays $6,000, and you won’t be able to live at
home for free. The cost of your travel accomodations on the trip will be
$3,000, gasoline will cost you $200, and your food will cost $1,400. What is
the opportunity cost of taking this trip?
2.
The university has built a new parking garage. There is always an available
parking spot, but it costs $1 per day. Before the new garage was built, it
usually took 15 minutes of cruising to find a parking space. Compare the
opportunity cost of parking in the new garage with that in the old parking lot.
Which is less costly and by how much?
Solutions to Additional Problems
1.
The opportunity cost of taking this trip is $10,600. The opportunity cost of taking the
trip is the highest-valued activity that you will give up so that you can go on the trip.
In taking the trip, you will forgo all the goods and services that you could have bought
with the income from your summer job ($6,000) plus the expenditure on travel
accommodations ($3,000), gasoline ($200), and food ($1,400).
2.
The opportunity cost of parking before the building of the new parking garage is the
highest-valued activity that you forgo by spending 15 minutes parking your car. The
opportunity cost of parking in the new parking garage is $1 that you could have spent
elsewhere. If the opportunity cost of 15 minutes spent parking your car is greater than
the opportunity cost of $1, then the new parking garage is less costly.
Additional Discussion Questions
1. Why are economists so concerned about the material aspects of life?
Explain that this is a myth! Economists are often criticized for focusing on
material well-being because of the general public’s view that economics is
about money. Explain that there are economists that research social and
emotional (or spiritual) aspects of life. You may also add that these parts of life
often depend heavily on attaining material well-being. You may want to
reference the Economic Freedom Index (www.freetheworld.com) and its
explanatory power on issues of world hunger and poverty. Ask them to
consider the need for life-enhancing goods and services such as health care or
education to support spiritual or emotional well-being. Ask how protestors
would be able to voice their opinions without low-cost air travel and the power
of the Internet to coordinate the activities of hundreds of protesters. (Be
careful not to seem to be either condoning or condemning these activities.)
Most students will begin to see that the more efficient we are at producing
material prosperity, the more time and opportunity everyone has to promote
emotional (or spiritual) goals.
2. Mini Case Study Illustrating How Economists Use Modeling:
Women are unfairly underpaid when compared to men. Ask your
students whether this statement is positive or normative. Mention that the
media frequently reports that the average woman gets paid only 3/4 the
wages of the average man. Is this “fact” a sufficient test of the positive
statement?
7
8
CHAPTER 1
If women were paid more than men in one or two professions (like
professional modeling or elementary teaching) is that sufficient
evidence to conclude that women in general are not underpaid when
compared to men? Ask the students to think about how to properly test the
model. Are these counter examples enough to discard the idea that women are
underpaid?
What would you take into account when you collected data to
compare women’s salaries versus men’s salaries? Remind the students
that any model directly comparing men’s and women’s wages should control
for any differences in wage-relevant characteristics between working men and
women. You can discuss many different reasons why a gender wage gap can
occur, including:
• Women are underrepresented in higher paid occupations and are
overrepresented in lower paid occupations (the problem may not be
unequal pay but instead it may be unequal access to high paying jobs
(glass ceiling?);
• Women are underrepresented among those earning advanced degrees,
though mostly among older age cohorts (U.S. Bureau of Labor Statistics,
Employment and Earnings, Vol. 45, January, 1998). Here the problem here
might not be unequal pay but unequal access to higher education;
• Women have relatively less occupational-specific work experience and
have relatively less unbroken work experience, as many women struggle
between pursuing a career and raising a family. For example, one study
found that women who were not mothers earned 90 percent of men’s
salaries, whereas those who were mothers earned only 77 percent
(Waldfogel, “Understanding the ‘Family Gap’ in Pay for Women with
Children,” Journal of Economic Perspectives, Vol. 12, No. 1, 1998).
Does it further the public interest (and the interests of women
workers specifically) to propagate normative statements about wage
inequality based on statistics without taking account of all relevant
factors? Summarize the discussion by noting that economic studies have
indeed found evidence that a gender gap in wages exists in the United States,
even after controlling for all known relevant factors. However, the gender
wage gap is much less than the 1/3 number often quoted by the media, and
has been decreasing significantly over the last few decades (Blau, “Trends in
the Well Being of American Women, 1970-1995,” Journal of Economic
Literature, Vol. 36, No.1, March 1998). Get the students to see how properly
applying the science of economics to social issues helps us strip away
inflammatory rhetoric and examine the problem carefully and objectively.
W H AT I S E C O N O M I C S ?
Chapter 1 Appendix, Graphs in Economics
Lecture Notes
Goggle Theory
Explain to students that you are going to ask them to use three sets of goggles to view
math in the course. I have found this to be a great tool for students to understand why we
present data in different ways.
1. Equation Goggles: Write an equation in slope-intercept form and explain that this is one
way to show relationships between two variables. I like to use X and Y for this one and
then quickly explain that economics is much more fun than math because we may be
talking about X-rays and Yo-Yo’s. This helps some students break the barrier early on
what “variable” means.
2. Graphing Goggles: Work through a graph of the equation you wrote highlighting slope
and intercept. Indicate that this may be a Demand or Supply curve for instance.
3. Schedule Goggles: Draw a simple “T” schedule with X and Y choosing your own
numbers to “plug and chug” with the equation you first used.
Now you can explain that they will see all three of these forms of math at different times
during the course and it is important for them to understand that you can move between all
three anytime. We usually have it shown just one way for convenience. It is also fun during
lecture to say, “I need you to pull out your graphing goggles.”
I. Graphing Data
•
•
•
Graphs are valuable tools that clarify what otherwise might be obscure relationships.
Graphs represent “quantity” as a distance. Two-variable graphs use two
perpendicular scale lines. The vertical line is the y-axis. The horizontal line is the xaxis. The zero point in common to both axes is the origin.
Scatter diagram—a graph that plots the value of one variable on the x-axis and
the value of the associated variable on the y-axis. A scatter diagram can make clear
the relationship between two variables.
II. Graphs Used in Economic Models
•
Graphs are used to show the relationship between variables. Graphs can
immediately convey the relationship between the variables:
• A positive relationship (or direct relationship)—when the variable on the xaxis increases the variable on the y-axis increases. A straight line is a linear
relationship.
• A negative relationship (or inverse relationship)—when the variable on the
x-axis increases, the variable on the y-axis decreases.
• A maximum or a minimum—when the variable has a highest or lowest value.
III. The Slope of a Relationship
•
•
•
•
The slope of a curve equals the change in the value of the variable on the vertical
axis at the point where the slope is being calculated divided by the change in the
value of the variable on the horizontal axis at the relevant point.
• In terms of symbols, the slope equals ∆y/∆x, with ∆ standing for “change in.”
The slope of a straight line is constant. The slope is positive if the variables are
positively related and negative if the variables are negatively related.
The slope of a curved line at a point equals the slope of the straight line that is
tangent to the curved line at the point.
The slope of a curved line across an arc equals the slope of the straight line between
the two points on the curved line.
9
10
CHAPTER 1
IV. Graphing Relationships Among More Than Two Variables
•
A. When a relationship involves more than two variables, we can plot the
relationship between two of the variables by holding other variables constant.