The closed end fund discount
Bạn đang xem bản rút gọn của tài liệu. Xem và tải ngay bản đầy đủ của tài liệu tại đây (962.57 KB, 72 trang )
Elroy Dimson
London Business School
Carolina Minio-Paluello
Goldman Sachs
FO UN
N
R ES E A
H
IO
AT
C
D
R
The Closed-End Fund
Discount
O
F AIMR
The Research Foundation of AIMR™
Research Foundation Publications
Active Currency Management
by Murali Ramaswami
Anomalies and Efficient Portfolio Formation
by S.P. Kothari and Jay Shanken
Common Determinants of Liquidity and Trading
by Tarun Chordia, Richard Roll, and Avanidhar
Subrahmanyam
Company Performance and Measures of
Value Added
by Pamela P. Peterson, CFA, and
David R. Peterson
Controlling Misfit Risk in Multiple-Manager
Investment Programs
by Jeffery V. Bailey, CFA, and David E. Tierney
Global Asset Management and Performance
Attribution
by Denis S. Karnosky and Brian D. Singer, CFA
Interest Rate and Currency Swaps: A Tutorial
by Keith C. Brown, CFA, and Donald J. Smith
Interest Rate Modeling and the Risk Premiums in
Interest Rate Swaps
by Robert Brooks, CFA
The International Equity Commitment
by Stephen A. Gorman, CFA
Investment Styles, Market Anomalies, and Global
Stock Selection
by Richard O. Michaud
Long-Range Forecasting
by William S. Gray, CFA
Corporate Governance and Firm Performance
by Jonathan M. Karpoff, M. Wayne Marr, Jr., and
Morris G. Danielson
Managed Futures and Their Role in Investment
Portfolios
by Don M. Chance, CFA
Country Risk in Global Financial Management
by Claude B. Erb, CFA, Campbell R. Harvey, and
Tadas E. Viskanta
Options and Futures: A Tutorial
by Roger G. Clarke
Country, Sector, and Company Factors in
Global Equity Portfolios
by Peter J.B. Hopkins and C. Hayes Miller, CFA
Currency Management: Concepts and Practices
by Roger G. Clarke and Mark P. Kritzman, CFA
Earnings: Measurement, Disclosure, and the
Impact on Equity Valuation
by D. Eric Hirst and Patrick E. Hopkins
Economic Foundations of Capital Market Returns
by Brian D. Singer, CFA, and
Kevin Terhaar, CFA
Emerging Stock Markets: Risk, Return, and
Performance
by Christopher B. Barry, John W. Peavy III,
CFA, and Mauricio Rodriguez
Franchise Value and the Price/Earnings Ratio
by Martin L. Leibowitz and Stanley Kogelman
The Franchise Value Approach to the Leveraged
Company
by Martin L. Leibowitz
Real Options and Investment Valuation
by Don M. Chance, CFA, and
Pamela P. Peterson, CFA
Risk Management, Derivatives, and Financial
Analysis under SFAS No. 133
by Gary L. Gastineau, Donald J. Smith, and
Rebecca Todd, CFA
The Role of Monetary Policy in
Investment Management
by Gerald R. Jensen, Robert R. Johnson, CFA,
and Jeffrey M. Mercer
Sales-Driven Franchise Value
by Martin L. Leibowitz
Term-Structure Models Using Binomial Trees
by Gerald W. Buetow, Jr., CFA, and
James Sochacki
Time Diversification Revisited
by William Reichenstein, CFA, and
Dovalee Dorsett
The Welfare Effects of Soft Dollar Brokerage:
Law and Ecomonics
by Stephen M. Horan, CFA, and
D. Bruce Johnsen
The Closed-End Fund
Discount
To obtain the AIMR Product Catalog, contact:
AIMR, P.O. Box 3668, Charlottesville, Virginia 22903, U.S.A.
Phone 434-951-5499; Fax 434-951-5262; E-mail
or
visit AIMR’s World Wide Web site at www.aimr.org
to view the AIMR publications list.
The Research Foundation of The Association for Investment Management and Research™, the
Research Foundation of AIMR™, and the Research Foundation logo are trademarks owned by
the Research Foundation of the Association for Investment Management and Research. CFA®,
Chartered Financial Analyst™, AIMR-PPS ®, and GIPS ® are just a few of the trademarks owned
by the Association for Investment Management and Research. To view a list of the Association
for Investment Management and Research’s trademarks and a Guide for the Use of AIMR‘s
Marks, please visit our Web site at www.aimr.org.
© 2002 The Research Foundation of the Association for Investment Management and Research
All rights reserved. No part of this publication may be reproduced, stored in a retrieval system,
or transmitted, in any form or by any means, electronic, mechanical, photocopying, recording,
or otherwise, without the prior written permission of the copyright holder.
This publication is designed to provide accurate and authoritative information in regard to the
subject matter covered. It is sold with the understanding that the publisher is not engaged in
rendering legal, accounting, or other professional service. If legal advice or other expert
assistance is required, the services of a competent professional should be sought.
ISBN 0-943205-61-1
Printed in the United States of America
December 13, 2002
Editorial Staff
Bette A. Collins/Christine E. Kemper
Book Editors
Kara E. Hite
Online Production
Jaynee M. Dudley
Production Manager
Kelly T. Bruton/Lois A. Carrier
Production and Composition
Mission
The Research Foundation’s mission is to
encourage education for investment
practitioners worldwide and to fund,
publish, and distribute relevant research.
Biographies
Elroy Dimson is professor of finance and an elected governor of the London
Business School, where he has served as chair of the Finance Area, chair of
the Accounting Area, dean of M.B.A. Programs, and director of the
Investment Management Program. Professor Dimson has held visiting
positions at the Universities of Chicago and California, Berkeley, and at the
Bank of England. He has been chair of a closed-end fund and an investment
advisor and a director for several other funds. Professor Dimson is a former
president of the European Finance Association and recently won the QGroup’s Roger F. Murray Prize and the Most Innovative Paper Medal from
Inquire. He has published articles in such journals as the Journal of Finance,
Journal of Financial Economics, Journal of Business, Financial Analysts
Journal, and Journal of Portfolio Management. His books include Stock Market
Anomalies and Triumph of the Optimists: 101 Years of Global Investment
Returns (with Paul Marsh and Mike Staunton). Professor Dimson holds
degrees from the Universities of Newcastle, Birmingham, and London and
was recently awarded an Honorary Fellowship of the Institute of Actuaries.
Carolina Minio-Paluello is executive director at Goldman Sachs Asset
Management, London. As a product and portfolio manager, she is responsible for Goldman Sachs’s quantitative and global balanced strategies in
Europe and Asia ex-Japan. In previous positions with Goldman Sachs, she
managed the global balanced product for the Global Fixed Income and Active
Equity Teams and served in the Institutional Client Research and Strategy
Group. Prior to joining Goldman Sachs, Ms. Minio-Paluello worked at J.P.
Morgan Investments in the Strategic Investment Advisory Group. She is the
recipient of the StyleAdvisor Prize for her research on returns-based style
analysis, and she received the Edward Jones Scholarship Award at the
London Business School for her research on closed-end funds. She has
taught at the Universities of Geneva and London and has presented her
research in a number of countries. Ms. Minio-Paluello was educated in Italy,
Belgium, and the United Kingdom and holds a Ph.D. in finance from the
London Business School.
Acknowledgements
We are grateful for valuable suggestions from Gordon Gemmill, Don Keim,
Julian Kozerski, Mark Kritzman, Stefan Nagel, Andrei Shleifer, Bill Ziemba,
and colleagues at London Business School and Goldman Sachs. Financial
support from the Research Foundation of AIMR is gratefully acknowledged.
Foreword
The closed-end fund discount is one of the most persistent and troubling
puzzles of financial economics and, as such, has generated an extensive
literature of proposed resolutions. Elroy Dimson and Carolina Minio-Paluello
offer a superbly organized and detailed review of the extant literature, including
their own contributions.
They begin with a description of the closed-end fund industry, focusing on
the variety of ways in which closed-end funds are structured and the regulatory
environment in which they operate. They cover closed-end funds in both the
United Kingdom and the United States, which allows them to evaluate certain
hypotheses in light of the differences between these two markets.
Dimson and Minio-Paluello review the economic explanations of the
discount within the context of the efficient market hypothesis. They address
four types of explanations:
• The discount arises from biases in the funds’ net asset values, such as tax
liabilities and differences in liquidity.
• Agency costs account for the discounts. These costs include management
fees, the expectation of poor performance, and the effect of ownership
structure on the likelihood of opening the fund.
• The discount reflects the inability of investors to time gains and losses in
order to reduce their tax liabilities.
• The discount is a result of market segmentation.
Dimson and Minio-Paluello scrutinize each of these explanations and find
that, assuming markets are reasonably efficient, none of them individually
accounts for all aspects of the closed-end fund discount.
The failure of economic hypotheses to explain the closed-end fund discount leads the authors to explore behavioral explanations. They consider
whether investor sentiment might explain the discount. If investors have finite
horizons, then the noise introduced by irrational investors who make systematic forecasting errors deters rational investors from engaging in the type of
arbitrage that would eliminate the discount. Because rational investors are
risk averse, they invest only in closed-end funds that sell at a discount as
compensation for the incremental risk generated by the noise traders. Dimson
and Minio-Paluello document evidence to support behavioral explanations of
the puzzle, although they also find some contradictory evidence.
Finally, Dimson and Minio-Paluello examine ways to profit from the
closed-end fund discount. Although they document evidence of apparent
profitable opportunities, they acknowledge that implementation frictions may
hinder the realization of these opportunities.
viii
©2002, The Research Foundation of AIMR™
Foreword
This monograph presents a thorough review, including the authors’
latest thinking, of one the greatest challenges to the efficient market
hypothesis. The Research Foundation is pleased to present The Closed-End
Fund Discount.
Mark Kritzman, CFA
Research Director
The Research Foundation of the
Association for Investment Management and Research
©2002, The Research Foundation of AIMR™
ix
The Closed-End Fund Discount
Closed-end funds are companies whose operations are similar to those of any
business corporation. Closed-end funds differ only because their corporate
business consists largely of investing funds in the securities of other corporations and managing these investment holdings for income and profit. An
important characteristic that makes closed-end funds unique is that they
provide contemporaneous and observable market-based rates of return for
both stocks and underlying asset portfolios. Closed-end funds are so called
because their capitalization is fixed, or “closed,” which implies that the supply
of closed-end fund shares is inelastic. Thus, the price is a function of the supply
and demand for the shares trading on the market and has only an indirect link
with the value of the assets corresponding to each share.
Closed-end funds are characterized by one of the most puzzling anomalies
in finance—the closed-end fund discount. Shares in U.S. funds are issued at a
premium to net asset value (NAV) of up to 10 percent; British funds are issued
at a premium amounting to at least 5 percent. (This premium represents the
underwriting fees and start-up costs associated with the flotation.) Subsequently, within a matter of months, the shares trade at a discount, which persists
and fluctuates according to a mean-reverting pattern. On termination (liquidation or “open-ending”1) of the fund, share price rises and discounts disappear.
The flotation and subsequent behavior of closed-end fund shares, therefore,
represent a challenge to the hypothesis that investors behave rationally and
markets function efficiently. Closed-end funds provide apparent evidence of
market inefficiency, violations of standard asset-pricing models, and exceptions
to such fundamental principles of corporate finance as the law of the conservation of value and the Modigliani-Miller propositions.2 So, it is no surprise that
closed-end funds have attracted the attention of leading scholars in finance.
1 The term “open-ending” refers to a set of techniques that force a closed-end fund’s share price
to NAV. The methods include converting the fund to an open-ended structure, merging the
fund with an open-ended fund, tender offers for the entire assets of the fund, and liquidating
the fund’s assets and distributing the proceeds to shareholders.
2 See Dimson and Mussavian (1998, 1999) and Dimson and Talmor (2003) for reviews of these
bodies of literature, and see Dimson (1988) and Keim and Ziemba (2000) for summaries of the
literature on stock market anomalies as a whole.
©2002, The Research Foundation of AIMR™
1
The Closed-End Fund Discount
This monograph reviews the theories and evidence on the behavior of the
discount on closed-end funds.3 We start by providing an overview of the
closed-end fund industry. We then examine economic explanations for the
discount, with particular attention to the managerial performance theory, and
consider the behavioral explanations. Finally, we examine the opportunities
for exploiting the discount.
Closed-End Funds
Since the launch in 1868 of the world’s first closed-end fund, the Foreign and
Colonial Government Trust (listed on the London Stock Exchange), the
closed-end fund industry has grown considerably.4 In the United States, the
first closed-end fund, the New York Stock Trust, was offered to the public in
1889. Over the following century, the closed-end fund industry evolved to
provide professionally managed portfolios aimed primarily at the individual
investor. By the 1980s and 1990s, however, closed-end funds emphasized
raising capital for investment in specialized areas or for special purposes,
rather than for traditional, internationally diversified funds. In mid-2001, 470
funds were listed on the London Stock Exchange (LSE), with a total market
capitalization of nearly $80 billion (Dimson and Marsh 2001).5 The total
market cap of U.K. open-end funds was then approximately $320 billion
(AUTIF 2001). British closed-end funds, therefore, have a market cap that is
about one-quarter of the market cap of open-end funds. In the United Kingdom, closed-end funds and open-end funds are referred to, respectively, as
investment trusts and unit trusts.
The assets of U.K. closed-end funds are invested almost exclusively in
stocks. In contrast, the United States has two main types of closed-end funds—
stock and bond. The Investment Company Institute (ICI 2002) reported that
of $130 billion invested in the closed-end fund industry in 2001, $30 billion was
in equity funds; these equity funds had almost three-quarters of their assets
invested in the United States. The aggregate market value of U.S. equity
closed-end funds corresponds to less than 1 percent of the value of U.S. openend funds.
Table 1 provides an overview of the closed-end fund market, broken
down into equity and bond funds and subdivided into domestic and foreign
subgroups. Table 2 uses the sector classification prevalent in the United
Kingdom to show a more detailed breakdown of British closed-end funds.
These tables clearly demonstrate the wide variety of funds traded on the LSE.
3 See
Kraakman (1988) and Rozeff (1991) for earlier reviews of this literature.
(1997) recorded the history of the closed-end fund industry from its origins to the
present day and provided references to other historical material.
5 Values in sterling have been converted into U.S. dollars at an exchange rate of 1.42.
4 Newlands
2
©2002, The Research Foundation of AIMR™
The Closed-End Fund Discount
Table 1. Overview of the Closed-End Fund Market, 2001
Number of Companies
Fund Type/Category
Sector Value (billions)
United States
United Kingdom
United States
United Kingdom
Domestic
51
205
$22
$30
International and global
59
149
8
50
110
354
$30
$80
324
0
$92
$0
24
0
8
0
348
0
$100
$0
Equity funds
All equity funds
Bond funds
Domestic
International and global
All bond funds
Sources: ICI; Dimson and Marsh.
Table 2. U.K. Closed-End Fund Categories
Category
Investment Policy
Number
Market Cap
(billions)
A. Closed-end funds mid-1998
1. International general
< 80% in any one geographical area (“area”)
17
$15
2. International capital growth
< 80% in any one area; policy to stress capital growth
25
7
3. International income growth
< 80% in any one area; policy to stress income growth
4
2
4. U.K. general
> 80% in U.K.-registered (“U.K.”) companies
13
4
5. U.K. capital growth
> 80% in U.K. companies; policy to stress capital growth
13
2
6. U.K. income growth
> 80% in U.K. companies; policy to stress income growth
16
5
7. High income
> 80% in equities/convertibles; yield > 25% above FTSE A.S.
14
l1
8. Closed-end funds
> 80% in inv. trusts and other closed-end inv. companies
9. Small companies
> 50% in the shares of small-/mid-cap companies
7
1
39
6
9
2
28
4
5
3
10. North America
> 80% of assets in North America
11. Far East, excluding Japan
> 80% of assets in Far East securities, ex Japan
12. Far East, including Japan
> 80% in Far East securities; < 80% in Japan
13. Japan
> 80% of assets in Japan
13
2
14. Continental Europe
> 80% of assets in continental Europe
19
3
15. Pan Europe
> 80% in Europe (incl. U.K.); > 40% in continental Europe
3
2
16. Property
> 80% of assets in listed property shares
4
<1
17. Commodity and energy
> 80% of assets in listed commodity and energy shares
18. Emerging markets
> 80% of assets in emerging markets
19. Venture/development capital Significant portion in the securities of unquoted companies
3
1
27
5
22
9
4
20. Split-capital trusts
Fixed open-ending date and ≥ 2 classes of equity capital
62
21. Venture capital trusts
Trusts, with a different tax status, invested in private equity
21
1
364
$80
Total
B. Closed-end funds mid-2001
1. Global growth
< 80% in any one area; > 20% in U.K.; stress on growth
37
$25
2. Global growth and income
< 80% in any one area; > 20% in U.K.; growth plus income
8
3
3. Global small companies
< 80% in any one area; > 20% in U.K.; > 80% small/mid-caps
2
1
©2002, The Research Foundation of AIMR™
3
The Closed-End Fund Discount
Table 2. U.K. Closed-End Fund Categories (continued)
Category
Investment Policy
Number
Market Cap
(billions)
4. Overseas growth
< 80% in any one geographical area; < 20% in U.K.; growth
4
2
5. U.K. growth
> 80% in U.K.-registered companies; growth stressed
27
8
6. U.K. growth and income
> 80% in U.K.-registered companies; growth plus income
38
9
7. U.K. small companies
> 80% in U.K.-registered companies; > 80% small-/mid-caps
36
5
8. U.K. high income
> 80% in equities/convertibles; yield > 25% above FTSE A.S.
36
4
9. North America
> 80% of assets in North America
10. N. American small companies > 80% of assets in North America; > 80% small-/mid-caps
7
2
3
<1
11. Far East, including Japan
> 80% in Far East securities; > 20% in Japan
3
1
12. Far East, excluding Japan
> 80% in Far East securities; < 20% in Japan
16
2
13. Japan
> 80% of assets in Japan
13
2
14. Japanese small companies
> 80% of assets in Japan; > 80% small-/mid-caps
5
1
15. Europe
> 80% of assets in Europe
17
5
16. European small companies
> 80% of assets in Europe; > 80% small-/mid-caps
5
2
17. Global emerging markets
> 80% of assets in global emerging markets
9
2
2
<1
18. European emerging markets > 80% of assets in European emerging markets
19. Latin America
4
<1
20. Venture/development capital Significant portion in the securities of unquoted companies
> 80% of assets in Latin America
22
<1
21. Country specialists
> 80% in 1 or 2 European/Far East/other countries
14
<1
22. Sector specialists
Specialization in a particular sector
46
4
23. Split-capital trusts
Fixed open-ending date and ≥ 2 classes of equity capital
na
na
24. Venture capital trusts
Trusts, with a different tax status, in private equity
Total
na
na
354
$80
na = not available.
Notes: In Panel A, Sectors 1–15 were included in Dimson and Minio-Paluello (2002); Sectors 16−21 were omitted. In Panel
B, sectors were analyzed by CLL (2001). Split funds were allocated to sectors, and venture capital trusts omitted.
Sources: Association of Investment Trust Companies (sectors); Dimson and Minio-Paluello (2002); CLL.
The Discount. One important characteristic that sets closed-end funds
apart from other collective investment schemes is the mismatch between the
funds’ share prices and the value of their underlying investments. The funds
trade at a discount or premium to NAV.6 Investors, therefore, have two ways
of making (or losing) money—from any rise or fall in the value of the
underlying investments and from any narrowing or widening of the discount.
The history of the closed-end fund discount and premium mirrors the
popularity of these funds. In the 1960s, the average discount fluctuated around
10 percent. However, by the middle of the 1970s, private, as well as institutional, investors had lost interest in such funds and the average discount in
the United Kingdom widened to nearly 50 percent. The bull market of the
6 NAV is defined as the market value of the securities held less the liabilities, all divided by the
number of shares outstanding.
4
©2002, The Research Foundation of AIMR™
The Closed-End Fund Discount
1980s and the introduction of new investment objectives, capital structures,
and tax-efficient wrappers renewed interest in closed-end funds. By the early
1990s, the average discount (expressed as the logarithm of the unweighted
mean ratio of share price to NAV) had narrowed to around 5 percent, as Panel
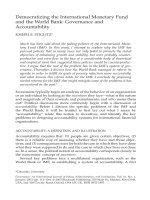
A of Figure 1 shows. During the 1990s, the trend seemed to reverse somewhat. By the beginning of 2001, however, the average discount of U.K. closedend funds was again below 10 percent.
Figure 1. The Closed-End Fund Discount,
1973–2001
A. U.K. Average Discount
Discount (%)
0
−10
−20
−30
−40
−50
73
77
81
85
89
93
97
01
93
97
01
B. U.S. Average Discount
Discount (%)
0
−10
−20
−30
−40
−50
73
77
81
85
89
Note: U.K. data include almost the entire industry, with the exception of funds that invest in unquoted securities, specialist funds,
and emerging market and split-capital funds.
Sources: Datastream (Panel A); CDA/Wiesenberger (Panel B).
©2002, The Research Foundation of AIMR™
5
The Closed-End Fund Discount
The behavior of U.S. equity domestic funds closely follows the pattern of
the U.K. market. As Panel B of Figure 1 shows, during the 1970s, U.S. funds
traded, on average, at a discount larger than 20 percent. Successively, the
discount gradually narrowed until these funds traded at about a 5 percent
average discount. Nevertheless, whereas U.S. closed-end funds are typically
a retail product, a high level of institutional ownership exists in the United
Kingdom. Two-thirds of the shares in U.K. closed-end funds, on average, are
held by institutions, and for many funds, the institutional proportion is much
higher than two-thirds (CLL 2001). Much of the academic research on closedend funds (reviewed in detail later) has focused on explaining the discount.
Regulations. In this section, we describe the structure and regulatory
environment of the closed-end fund industry and draw a comparison between
the United States and the United Kingdom. Some differences between closedend and open-end funds are also discussed.
■ Capital structure. As discussed previously, closed-end funds are
characterized by a fixed capitalization. This structure makes it easier for the
investment manager to make long-term commitments. In contrast, open-end
funds are characterized by the continual sale and redemption of their units at
or near NAV, and this at the request of any unitholder. Therefore, open-end
funds have a variable number of shares in issue.
Closed-end funds issue a wide variety of financial instruments, and their
fund managers frequently devise new ways of providing investment exposure.
Different classes of investment are now available. In the United Kingdom, they
include ordinary shares, highly geared shares (common stock in a company
with a windup date that is designed to give stockholders a highly leveraged
return in terms of both capital and income), income shares (securities that are
entitled to the surplus income after expenses and after the income requirement
of any prior charge has been met), capital shares (securities that are entitled
to the surplus assets on windup after repayment of other share classes), zerodividend preference shares (securities that have a predetermined rate of
capital growth), stepped preference shares (securities with a predetermined
growth in both income and capital), warrants, and convertibles.
Although only a few U.S. closed-end funds take on any leverage,7 U.K.
closed-end funds more frequently make use of leverage through their own
capital structures. This use of leverage increases the underlying holdings of
7 Until
1988, no U.S. closed-end equity funds were leveraged. At the time we were researching
this monograph, only 11 U.S. closed-end equity funds had any leverage and the aggregate debt
ratio for this sector was less than 1 percent. The Investment Company Act of 1940 requires
funded debt and preferred stock to be covered, respectively, at least three times and at least
two times total assets (Anderson and Born 1992).
6
©2002, The Research Foundation of AIMR™
The Closed-End Fund Discount
a closed-end fund. The risk of highly leveraged shares is larger, however,
because borrowing boosts NAVs in rising markets but depresses them when
markets fall. To protect the interests of shareholders, there are restrictions
on the amount of capital that a company may borrow, but the majority of funds
operate with low levels of leverage, and prior to 2001, the limits in leverage
had rarely been reached.8 In contrast, open-end funds are generally prohibited from borrowing money, which implies that unitholders’ interests vary
directly with the value of their proportionate part of the fund.
Split-capital funds are effectively a way of introducing an element of
leverage without borrowing any money. In the United States, split-capital
funds are referred to as dual-purpose funds. These funds are capitalized with
two types of claim—preferred and capital shares—and have a fixed expiration
date. Preferred shares receive all dividend and interest income as it accrues
from the underlying portfolio of the fund and have a predetermined redemption price, when the fund terminates. Capital shares are entitled to the capital
gains that the entire portfolio generates.9 Dual-purpose funds issue equal
amounts of common and preferred shares. On termination, income shareholders receive the minimum of either their stated redemption price or the value
of the remaining assets of the fund. Capital shareholders then have a residual
claim on the terminal value of the fund’s portfolio. At the windup date, one of
two things usually happens—either the fund is liquidated and each shareholder receives his portion of the assets or, at the election of common
shareholders, the fund can be converted into an open-end operation and
continue as an investment company.
Warrants are long-term traded options that give the right to buy shares at
some time in the future at a price fixed when the warrants are first issued.
They are essentially call options. Warrants do not form part of the company’s
issued share capital, and they are usually not entitled to dividends until
exercised (an exception to the rule is the “subscription share,” which has all
the features of a conventional warrant but also pays dividends). Well over 100
8 As
might be expected, during the 2000–2002 bear market, U.K. closed-end funds suffered
serious declines, some breached covenants, and in certain cases, they were wound up. The
declines were amplified in split-capital funds—not only through the leverage provided (e.g., by
zero-dividend preference shares) but also through the additional leverage created in some
funds by mutual cross-investment in other split-capital funds.
9 The discount or premium on capital shares is computed by comparing the capital share price
with the NAV. Most income shares have fixed redemption values over their lives; only a few
have arrangements whereby they share in a portion of the capital growth over time. The net
assets attributable to this class correspond to the estimated final redemption value. The overall
split-capital fund discount is computed by summing the market capitalizations of all classes of
shares and comparing the total with the sum of the net assets attributable to each class.
©2002, The Research Foundation of AIMR™
7
The Closed-End Fund Discount
closed-end fund warrants are traded in the London market. Most U.K. closedend funds include warrants with their share capital when they are first
launched. Typically, an investor is offered one warrant for every five shares.
Most warrants are “free” and are intended to compensate for any downward
move in the share price from that price paid at launch. Investors can sell
warrants once they are traded in their own right, separate from the shares.
Warrants can easily be repurchased by the issuer.
■ Taxation. Under the U.S. tax system, closed-end funds are required to
distribute to shareholders 90 percent of realized capital gains in a given year
to qualify for exclusion from corporation tax. Closed-end funds make two types
of distribution—the income dividend and the capital gains dividend.
Shareholders are taxed according to the type of dividend received; the income
dividend is taxed as ordinary income, and the capital gains dividend is taxed
at the capital gains rate. Federal regulations require closed-end funds that
elect to retain their beneficial tax status to return all dividend income to
shareholders every year. Closed-end funds typically pay dividends quarterly
or semiannually.
In contrast, U.K. closed-end funds are not allowed to distribute capital
gains but must retain them for reinvestment. The capital gains tax on closedend funds was reduced to 10 percent in 1977 and removed completely in 1980.
Therefore, closed-end fund managers can turn over their portfolios without
incurring any capital gains tax liability. U.K. closed-end funds cannot retain
more than 15 percent of dividends received. If the dividend they can distribute
to their shareholders is lower than the desired level, they are prevented from
selling part of their holdings to boost the dividend payout.
■ Charges. The costs associated with acquiring closed-end funds shares
are typically lower than those for open-end funds. Open-end managers set an
initial charge of about 5 percent when units are bought.10 The bid-offer spread,
however, is often larger than the initial charge. In the United Kingdom, the
calculation is strictly controlled by the Department of Trade and Industry and,
in theory, can go as high as 12 percent.11 In contrast, closed-end funds have
no initial management charge when shares are bought, and the bid-offer
10 The
annual charge will be deducted before the investment income is distributed to
unitholders, but the initial charge will normally be part of the buying price.
11 The
published spread is normally 5–7 percent, but managers are free to fix their prices
anywhere within the permitted spread. On the one hand, an investor might have to buy the
units when prices are being fixed in relation to the offer price and sell them when they are being
fixed on the bid, so the spread can theoretically become as high as 12 percent. On the other
hand, if the investor buys the units when prices are being fixed in relation to the bid price and
sells them when they are being fixed at the offer, the spread can, in theory, disappear.
8
©2002, The Research Foundation of AIMR™
The Closed-End Fund Discount
spread is normally about 2 percent. The dealing costs involved in buying or
selling through the investment trust management company can be as low as
0.2 percent, whereas a full-service stockbroker normally charges 1.65 percent.
Considering the management charges and bid-offer spread as a whole, the cost
associated with buying and selling closed-end fund shares can be markedly
below 4 percent of the original investment and will never be above 8 percent.
With open-end funds, the equivalent costs can be as high as 13 percent.
In the United States (and, to a lesser extent, the United Kingdom), some
open-end companies, known as no-load funds, sell their shares directly to
investors (see Morey, forthcoming 2003). Because no salesperson is involved,
there is no sales commission (load) and the shares are sold at the net asset
price. Others, known as load funds, offer shares through brokers or other
selling organizations; these organizations add a percentage load charge to the
NAV, and a portion of the investor’s equity is removed as the “load” at the
beginning of the contract. The load charge for a U.S. fund is generally about
8 percent of the sale price. It is possible but much less usual to buy units
directly from existing unitholders. In the United States, the term “unit trust”
is used in a more limited sense to refer to a fixed-unit trust—a company with
a portfolio that is fixed for the life of the fund.
Closed-end fund managers take a fee for managing shareholders’ assets,
and out of this fee, they pay the costs of portfolio management. All cost savings
that they achieve will increase their own profits. Conversely, it costs the
shareholder no more if a trust is managed expensively. When a closed-end
fund is able to reduce costs, doing so usually benefits the management
company.
Economic Explanations for the Discount
Several standard theories about the pricing of closed-end funds attempt to
explain the discount within the framework provided by the efficient market
hypothesis. We discuss first the most obvious approach, which is to ask whether
the discount is really there or whether the NAV is simply miscalculated; perhaps
the market is efficient and the calculation of NAV contains biases. We turn in
the following subsection to explanations based on agency costs. These explanations typically assert that the discount reflects the present value of management fees in excess of the value of services rendered, either before or after
taking account of managerial performance. The tax-timing hypothesis we discuss next attempts to explain the existence of discounts based on the argument
that by holding shares of a closed-end fund, investors lose valuable tax-trading
opportunities associated with the idiosyncratic movements of the individual
©2002, The Research Foundation of AIMR™
9
The Closed-End Fund Discount
security prices in the portfolio. Finally, we present additional explanations for
the discount that emphasize the impact of market segmentation.
As we move through these discussions, keep in mind that the explanations
offered need to account for the premium as well as the discount
Biases in NAV. The dominant puzzle in the literature is the discount, so
we first ask whether or not it is really there. Explanations of the discount that
are consistent with a broad notion of market efficiency emphasize the possibility that NAVs may be overestimated. Possible causes of this miscalculation
are tax liabilities relating to unrealized capital gains and illiquid assets.
Another possibility is bias in the NAV arising from differences in liquidity
between the underlying portfolio constituents and the shares of the fund.
■ Tax liabilities. As noted earlier, U.S. closed-end funds must distribute
90 percent of realized gains to qualify for exclusion from corporation tax. Thus,
shareholders receive two streams of dividends—the income dividend and the
capital gains dividend. An investor could buy fund shares worth $1,000 and,
with the fund then unwinding some profitable positions, take a $200 capital
gains distribution. Such an event would not only increase the effective cost of
buying the shares, but tax would be due on a gain from before the investor
owned the fund. If a closed-end fund is characterized by large unrealized
capital gains, shareholders will be liable for capital gains taxes. Theoretically,
this possibility might explain part (or all) of the discount on closed-end funds.
Malkiel (1977) found, however under fairly generous assumptions, that
tax liabilities can account for a discount of no more than 6 percent, whereas
the average discount of domestic equity funds in the United States has in
recent years been almost 10 percent. Moreover, U.K. closed-end funds are not
allowed to distribute any capital gains, and the shareholders are not liable for
any capital gains tax unless they sell their holdings in the fund. Yet, U.K. funds
behave remarkably like their U.S. counterparts (see Figure 1), which suggests
that the discount cannot be explained by tax factors that are specific to a single
country. Furthermore, the tax liabilities theory implies that on open-ending,
the NAV should decrease. Lee, Shleifer, and Thaler (1990) showed the opposite: On liquidation, prices rise to the NAV.
Fredman and Scott (1991) argued that discounts may partially be caused
by capital gains liabilities and suggested that if portfolio performance has been
good and capital gains liabilities are large, discounts follow suit. Pontiff (1995)
provided evidence, however, that past NAV returns, net of the market return,
are more strongly related to current discounts than simple NAV returns,
which is inconsistent with the capital gains arguments because capital gains
are computed from unadjusted returns.
10
©2002, The Research Foundation of AIMR™
The Closed-End Fund Discount
The theory of capital gains tax liabilities predicts that when stocks do well,
closed-end funds should accrue unrealized capital gains and, provided turnover
rates on fund assets are constant, the discount should generally widen. However, Lee, Shleifer, and Thaler (1991—hereafter, LST) found that the correlation between returns on the market and changes in discounts is about zero.
■ Liquidity. Bookkeeping procedures could lead to a fund manager
either under- or overestimating the fund’s NAV. For example, reporting
restricted shares at the same price as publicly traded common stocks can
overstate the NAV.12 Malkiel found, for the 1969–74 period, a significant
relationship between the discount and the variable measuring the proportion
of the portfolio in restricted stock. Lee et al. (1990) showed that restricted
holdings cannot explain much of the closed-end fund puzzle, however,
because most funds are barely exposed to such illiquid securities but the funds
still sell at a discount. More importantly, if restricted stocks were overvalued,
the NAV should drop down on open-ending to the fund’s price. Instead, the
evidence shows that the share price, in fact, rises.
Liquidity—or, more precisely, lack of liquidity—is a possible explanation
for the discount. On the one hand, Seltzer (1989) argued that discounts can
be accounted for by the mispricing of illiquid securities in the portfolio. He
suggested that these securities are likely to be overvalued because of the
difficulty of determining their fair market value. In this connection, Datar,
Naik, and Radcliffe (1998) demonstrated the importance of liquidity in terms
of explaining stock returns. On the other hand, investors might be willing to
pay higher management fees for holding the liquid shares of closed-end funds
that invest in less liquid securities, such as small-cap stocks. Therefore, the
importance of illiquid assets is difficult to measure.
Datar and Dubofsky (1999) also showed that closed-end funds react no
differently from other firms to stock distribution announcements. Trading
volume and turnover remain unchanged after closed-end funds’ ex-stockdistribution days, although for other firms that distribute shares, liquidity
declines.
Closed-end funds hold diversified portfolios of stocks and report the
market values of their underlying assets weekly. Consequently, the little
uncertainty about their current liquidation values should not generate an
adverse selection component in fund bid–ask spreads. Neal and Wheatley
(1998a) found, however, that estimates of the adverse selection component of
12 Restricted
or “letter” stocks are like common stocks except that they must be held for
investment and cannot be sold for a prespecified period of time. These stocks are unregistered
and highly illiquid, which implies that the market price of these stocks is not a fair indication
of their liquidation value.
©2002, The Research Foundation of AIMR™
11
The Closed-End Fund Discount
a firm’s bid–ask spread are large and significant for both closed-end funds and
a matched sample of common stocks. Their evidence suggests that either
adverse selection arises primarily from factors other than current liquidation
values or the empirical models are misspecified. Note, however, that in
contrast to Neal and Wheatley’s findings, Clarke and Shastri (forthcoming
2003) have found that the adverse selection component of closed-end fund
spreads is lower than it is for control firms.
Wu and Xia (2001a, 2001b) took a different perspective on liquidity.
Focusing on country funds, they perceived discount changes to be instruments for expected future economic conditions, so the discount proxies for
the expectation of future liquidity risk.
Finally, Deli and Varma (2002) investigated whether the choice of fund
organization plays a role in the discount. They found that funds that hold the
less liquid assets, because of the less transparent pricing of those securities,
are more likely to be closed-end funds. The relationship is economically
meaningful as well as statistically significant.
In summary, most researchers conclude that the discount cannot be
explained away by biases in the calculation of fund NAVs. This series of
explanations is consistent with neither the existence of premiums to NAV nor
with the empirical regularity of price rises at open-ending.
Agency Costs. Agency costs are a possible explanation of the closed-end
fund discount if fees and expenses are considered too high or if future portfolio
management is expected to be below par. From this point of view, the discount
reflects excessive management fees and/or inadequate management performance. This approach has several problems. Positive agency costs imply that
funds should never be issued at a premium as long as equivalent no-load openend funds charging comparable fees exist. Furthermore, agency costs account
neither for the wide cross-sectional and periodic fluctuations in the discounts
nor for why some closed-end funds trade at a premium. An additional drawback of this hypothesis is that it cannot explain why rational investors buy into
closed-end funds that are issued at a premium; rational investors would be
aware of the likelihood of the fund subsequently trading at a discount.
■ Management fees. The simplest interpretation of the agency approach
predates Jensen and Meckling’s seminal 1976 paper on agency theory. It
focuses on management fees and other expenditures as a deadweight cost
imposed on shareholders of a closed-end fund. As Baur, Coelho, and Santoni
(1996) explained, because of this cost, the discount on closed-end funds is a
consequence of investors anticipating possible managerial dissipation and
capitalizing future management fees. Malkiel found no correlation, however,
between U.S. discounts and management expenses as a proportion of NAV
(see also Boudreaux 1973).
12
©2002, The Research Foundation of AIMR™
The Closed-End Fund Discount
Turnover has also been suggested as a possible explanation for the discount, because some closed-end fund managers execute a large volume of
discretionary transactions. Yet, Malkiel found no correlation between discounts and turnover. Furthermore, agency theory predicts that when long-term
interest rates fall, the present value of future management fees should rise and
discounts increase. LST showed, however, that changes in discounts are not
correlated with unanticipated shifts in the term structure of interest rates.
Ammer (1990) showed that with both a simplified static version and a
dynamic version of an arbitrage-based framework, expenses and yields account
for a level of the discount that is typical of U.K. closed-end funds. Ross (2002)
supported the view that discounts can be explained as the present value of
managerial fees. However, this framework fails to explain most of the time
series, cross-sectional, and international variations in discount. Kumar and
Noronha (1992) reexamined the role of expenses by developing a present value
model that emphasizes expenses relative to dividend income. Using a larger
sample than Ammer used and their alternative specification of the expense
variable, Kumar and Noronha found that discounts are related to expenses.
Gemmill and Thomas (2002) addressed the existence of a long-run equilibrium discount on closed-end funds and the reason the discount fluctuates
over time. They argued that discounts exist in the long term because of
management expenses and the asymmetry of arbitrages and that discounts
fluctuate in the short term because of changes in investor sentiment.
■ Managerial performance. Many funds, both closed-end and open-end
funds, experience costs that are larger than the value of the investment
manager’s expertise. Therefore, as Ferguson and Leistikow (2001) suggested, the economic value of a portfolio can differ from its NAV. The shares of
closed-end funds would generally sell at a discount or earn an abnormally low
return on investment. We call this idea the “performance theory” of closedend fund discounts.
Thompson (1978) did not support this hypothesis. He observed that over
long time periods, many funds sell at a discount but simultaneously earn, on
a before-tax basis, greater rates of return than can be justified by the twoparameter capital asset pricing model. Similarly, Malkiel found no significant
relationship between future fund performance and discount levels. Roenfeldt
and Tuttle’s (1973) marginal support for a contemporaneous relationship is
anomalous, but it relates to a very small sample.
Assuming rational expectations, the performance theory predicts that
large discounts reflect poor future NAV performance. Lee et al. (1990) did not
support this hypothesis. They found that assets of funds trading at large
discounts tend to outperform those with smaller discounts. Furthermore,
Pontiff (1995) showed that the ability to predict future discounts based on
©2002, The Research Foundation of AIMR™
13
The Closed-End Fund Discount
current discounts is almost entirely attributable to the ability to forecast stock
returns (as opposed to NAV returns).
Gruber (1996) and Elton, Gruber, and Blake (1996) showed that investors
can, and do, identify superior managers and direct incremental money to the
open-end funds that are better managed. Zheng (1999), examining the statistical and economic significance of Gruber’s “smart money” effect, confirmed
the existence of fund selection ability. Chen, Jegadeesh, and Wermers (2000)
presented findings for growth-oriented mutual funds that are consistent with
the existence of fund selection ability. Bal and Leger (1996) and Leger (1997)
reported weak performance persistence among British closed-end funds, and
comparable results for the United States were presented by Bers and Madura
(2000). In a very different environment, Chen, Rui, and Xu (2002) and Cao and
Esman (2002) found evidence of superior and persistent managerial performance among Chinese closed-end fund managers.
On the one hand, if the superior funds are drawn from the universe of
closed-end funds, discounts should reflect investor expectations of future
managerial performance, and Gruber suggested that funds might trade at a
smaller discount (or even at a premium) if the market were anticipating good
managerial performance. Chay (1992) and Chay and Trzcinka (1999), calculating managerial performance net of expenses charged by managers, showed
that funds selling at a discount do underperform funds selling at a premium.
These findings tend to support the hypothesis that discounts reflect market
expectations of fund managers’ future performance. Bodurtha, Kim, and Lee
(1995) concluded that at a monthly horizon, discounts are not mean reverting,
yet they predict future price returns, and Wu and Xia (2001a) found that
discounts predict future NAV returns. These findings, therefore, tell a story
similar to Chay and Trzcinka’s findings.
On the other hand, despite the belief that discounts should reflect the
quality of management of closed-end funds, the existing evidence presents
something of a puzzle, in that discounts appear to be negatively related to
subsequent measures of performance. In Dimson and Minio-Paluello (2001),
we found that larger discounts (a low ratio of price to NAV) tend to be
associated with high share price and NAV returns, although this relationship
is mostly not statistically significant. Consistent with Malkiel and with Pontiff
(1995), the results demonstrated that smaller discounts (a high ratio of share
price to NAV) are not associated with the expectation of higher NAV returns.
The difficulty of identifying a link between closed-end fund discounts and
managerial performance helps explain why so few studies have looked at
managerial performance. Either the expected link between the discount and
subsequent performance does not exist, or investigators need a more sophisticated test procedure.
14
©2002, The Research Foundation of AIMR™
The Closed-End Fund Discount
For this reason, Dimson and Minio-Paluello (2001) revisited the managerial performance theory predicting that if a fund pays more than the “fair” value
for managerial expertise, its shares should sell at a discount, and vice versa.
In that paper, instead of defining managerial performance as the fund’s NAV
return (as previous research had done), we introduced a measure of managerial performance that adjusts for the fund’s effective asset exposure. This
definition of performance can capture the manager’s ability to select the
“right” stocks. The idea is that if a fund is simply exposed to an asset class that
is doing well, the manager is not necessarily good. The manager outperforms
only if he or she does better than a passive strategy with the same asset mix.
We used multi-index models to adjust for the fund’s effective asset
exposure to obtain a refined measure of managerial performance. NAV
returns, rather than share price returns, were used to judge managerial
performance because they are not affected by fluctuations in the discount.
Our analysis of the relationship between discounts and managerial performance suggests that price weakly reflects past performance but incorporates
no expectations of future performance. Bleaney (2002), again using U.K. data,
confirmed this finding.
Finally, Deaves and Krinsky (1994) suggested a possible reconciliation of
the conflicting findings on the role of managerial performance in closed-end
fund discounts. They investigated the puzzling evidence that managerial contribution (the difference between managerial performance and managerial
fees) and discounts are not negatively related. They showed that some of the
findings can be explained without abandoning market efficiency. Their model
has its foundations in the principle of investor rationality and shows that the
relationship between managerial contribution and discounts is not necessarily
monotone. Specifically, they argued that investors may attach an increased
probability to open-ending, which by definition moves the price toward the
NAV, in which case, as managerial contribution declines, the discount narrows.
■ Agency problems. Agency problems have the potential to provide an
explanation for the existence of the discount. Agency theory focuses on the
relationship between the principal (the shareholder of the fund) and the agent
(the manager). Agency problems emerge when conflicts of interests between
agents and principals affect the operations of the company or fund.
Draper (1989) investigated the U.K. fund management market and
observed that U.K. closed-end funds are rarely managed in-house but, rather,
contract out their management to groups of specialists. These potentially
lucrative contracts act as an incentive to managers to impede shareholder
asset realization as a result of open-ending. Consequently, shareholders may
be forced to bear substantial costs because of the difficulty of displacing
©2002, The Research Foundation of AIMR™
15