Fluid mechanisc of intrathecal drug delivery
Bạn đang xem bản rút gọn của tài liệu. Xem và tải ngay bản đầy đủ của tài liệu tại đây (7.44 MB, 158 trang )
Fluid Mechanics of Intrathecal Drug Delivery
THÈSE NO 4061 (2008)
PRÉSENTÉE le 27 juin 2008
À LA FACULTÉ DES SCIENCES ET TECHNIQUES DE L'INGÉNIEUR
LABORATOIRE DE MÉCANIQUE DES FLUIDES
PROGRAMME DOCTORAL EN MÉCANIQUE
ÉCOLE POLYTECHNIQUE FÉDÉRALE DE LAUSANNE
POUR L'OBTENTION DU GRADE DE DOCTEUR ÈS SCIENCES
PAR
Radboud Michael Nelissen
M.Sc. in applied physics, University of Twente, Enschede, Pays-Bas
et de nationalité néerlandaise
acceptée sur proposition du jury:
Prof. D. Favrat, président du jury
Prof. P. Monkewitz, Dr N. Borhani, directeurs de thèse
Prof. E. Buchser, rapporteur
Prof. D. Poulikakos, rapporteur
Prof. M. Swartz, rapporteur
Suisse
2008
Acknowledgements
This thesis would not have been possible without the funding of CTI Medtech, Medtronic
Europe SA, and the help of many. I would like to thank Peter Monkewitz for giving
me the freedom and the means to explore my subject, whilst gently pushing me in the
right direction. I owe gratitude to Navid Borhani for the many brainstorming sessions
which were instrumental in designing my experiment as well as for his critical evaluation
of the presentations that I did. I would especially like to thank Eric Buchser who besides
initiating the project has generated considerable interest in the clinical world. It was
always a pleasure to go to the Morges hospital and discuss progress and new ideas. I
would also like to thank the defense committee members, namely prof. Melody Swartz
and prof. Dimos Poulikakos, for the pleasant discussion and good ideas.
Trong-Vien Truong has helped me tremendously by making the CAD drawings of
my experiment and advising on experimental techniques. I want to thank the students
that were involved in this project, especially Friedemann for his dedication when my
own deadlines were fast approaching. My experiment was manufactured to the highest
standards thanks to the many people at our institute’s machine shop. I especially thank
Bernard Savary and Marc Salle for making pieces, giving ideas, correcting my errors, and
accepting the occasional ‘need-that-yesterday’ rush jobs. I would also like to thank Eva
Gasser for her kind help with all things administrative.
I have sometimes experienced my thesis as a solitary exercise, but only in the late
hours of the evening or during the weekend when Andrew, Chris, David, Etienne, Flavio,
Marc-Antoine, Orestis, Richard, and Roland were doing the laundry or “working at home”.
I’ll miss the banana/M&M’s/squash/coffee/beer breaks. I am not sure we have made this
world a better place with our regular discussions on the pretty pictures in the morning
newspapers, but at least we tried. Emeric, I can’t wait to receive the 49%, even though I
know it won’t come close to covering my own debt. Anyway, we would have made a great
couple!
Mam, pap, Ljiljana, André, Wyke, Hiske, Harald, Wouter, and other friends who I
have not mentioned explicitly, your encouragement and support is very dear to me. I feel
privileged and lucky to be able to count on you. Sanja, there are many ways to beat
around the bush (and unfortunately for you I know them all), but this thesis would not
have been possible without you. Je t’aime fort, enfin, quand même!
i
ii
Abstract
The aim of this principally experimental study is to understand from fluid mechanic
principles why an insignificant anesthetic dose administered as a short bolus into the cerebrospinal fluid inside the subarachnoid space provides greater pain relief than a larger
dose continuously injected over a longer period. The subarachnoid space is modeled as
an annular gap of constant or slowly varying cross section into which a catheter is introduced. The cerebrospinal fluid is replaced by water of 37◦ C which has very similar
properties. This fluid in the annular gap is subjected to oscillations of amplitude and
frequency (heart frequency) typically found in the subarachnoid space. The anesthetic is
replaced by a fluorescent dye injected through the catheter. To study its dispersion, we
have developed a 400 Hz laser scanning setup with which we perform quasi-instantaneous,
quantitative 3D laser induced fluorescence (LIF) as well as 2D particle image velocimetry
(PIV). The experiments are supplemented by an analytical axi-symmetric model as well
as an exploratory numerical model to help interpret the results. The study has identified
steady streaming (a nonlinear effect associated with the fluid oscillation) and enhanced
diffusion (an effect associated with oscillating shear flow) as the principal agents of dye
(anesthetic) dispersion. Besides the slowly varying cross section, the catheter tip has been
identified as an important cause for steady streaming. In an attempt to identify optimal
injection parameters of use for clinicians, a rough parametric model of the primary factors
influencing drug spread (fluid oscillation frequency and amplitude, geometry, and injection
rate) has been constructed.
Keywords: intrathecal drug delivery; injection rate; enhanced diffusion; steady streaming; laser induced fluorescence; particle image velocimetry.
iv
Version abrégée
Le but de cette étude, principalement expérimentale, est de comprendre pourquoi une
très faible dose d’anesthésique administrée en un rapide bolus dans le liquide céphalorachidien produit une plus grande diminution de la douleur qu’une dose plus importante
administrée sur une plus longue période. L’espace sous-arachnoïde est modélisé par un
volume annulaire de section transversale constante ou variant lentement dans lequel on a
introduit un cathéter. Le liquide céphalo-rachidien est remplacé par de l’eau à 37◦ C qui
possède des propriétés similaires. Ce fluide est soumis à des oscillations d’amplitude et de
fréquence comparables à celles rencontrées dans l’espace sous-arachnoïde. L’anesthésique
est, quant à lui, remplacé par un colorant fluorescent injecté dans le modèle par le cathéter.
Pour étudier la dispersion, un système de balayage laser fonctionnant a 400 Hz a été mis
en place afin de réaliser une étude quantitative tridimensionnelle quasi-instantanée par
fluorescence induite par laser (LIF) ainsi qu’une étude bidimensionnelle par vélocimétrie
d’image de particules (PIV). Ces mesures expérimentales sont complétées par une modélisation analytique du cas axisymétrique ainsi que par un modèle numérique préliminaire
afin d’appuyer l’interprétation des résultats. L’étude a mis en évidence un écoulement
redressé ou “steady streaming” (effet non linéaire associé avec les oscillations du fluide)
ainsi qu’une diffusion augmentée ou “enhanced diffusion” (effet associé au cisaillement
dans un écoulement oscillant) comme étant les deux principaux agents responsables de
la dispersion du colorant (i.e. de l’anesthésique). En plus de la variation lente de la section transversale, l’extrémité du cathéter a été identifiée comme une cause importante de
l’apparition de l’écoulement redressé. Dans le but d’identifier les paramètres d’injection
optimaux pour une utilisation clinique, un modèle paramétrique préliminaire basé sur les
principaux facteurs a été établi. Les facteurs déterminant la dispersion de l’anesthésique
sont la fréquence et l’amplitude des oscillations du fluide, la géométrie locale et le taux
d’injection.
Mots clés: administration intrathécale; taux d’injection; diffusion augmentée; écoulement redressé; fluorescence induite par laser; vélocimétrie d’image de particules.
vi
Contents
Abstract
iii
Version abrégée
v
Contents
ix
List of Figures
xiii
List of Tables
xv
1 Introduction to Intrathecal Drug Delivery
1.1
Intrathecal Drug Delivery . . . . . . . . .
1.2
Literature on ITDD . . . . . . . . . . . .
1.3
Research Questions . . . . . . . . . . . . .
1.4
Scope . . . . . . . . . . . . . . . . . . . .
.
.
.
.
.
.
.
.
.
.
.
.
.
.
.
.
.
.
.
.
.
.
.
.
.
.
.
.
.
.
.
.
.
.
.
.
.
.
.
.
.
.
.
.
.
.
.
.
.
.
.
.
.
.
.
.
.
.
.
.
.
.
.
.
1
1
2
3
4
2 Clinical trial
2.1
Introduction . . . . . . . . . . . . . . . . . . . .
2.2
Patients and methods . . . . . . . . . . . . . .
2.3
Results . . . . . . . . . . . . . . . . . . . . . . .
2.3.1 VAS Measurements . . . . . . . . . . . .
2.3.2 Dermatome Measurements . . . . . . . .
2.3.3 Cardiovascular and Respiratory Changes
2.4
Discussion . . . . . . . . . . . . . . . . . . . . .
2.5
Conclusion . . . . . . . . . . . . . . . . . . . . .
.
.
.
.
.
.
.
.
.
.
.
.
.
.
.
.
.
.
.
.
.
.
.
.
.
.
.
.
.
.
.
.
.
.
.
.
.
.
.
.
.
.
.
.
.
.
.
.
.
.
.
.
.
.
.
.
.
.
.
.
.
.
.
.
.
.
.
.
.
.
.
.
.
.
.
.
.
.
.
.
.
.
.
.
.
.
.
.
.
.
.
.
.
.
.
.
.
.
.
.
.
.
.
.
.
.
.
.
.
.
.
.
.
.
.
.
.
.
.
.
7
7
8
10
10
10
11
12
14
3 Dispersion Mechanisms in ITDD
3.1
Cerebrospinal Fluid (CSF) Oscillation
3.2
Geometry of the Subarachnoid Space .
3.3
Molecular Diffusion . . . . . . . . . . .
3.4
Enhanced Diffusion . . . . . . . . . . .
3.5
Steady Streaming . . . . . . . . . . . .
3.6
Injection Jet . . . . . . . . . . . . . . .
3.7
Drug Buoyancy . . . . . . . . . . . . .
3.8
Absorption into the Spinal Cord . . .
3.9
Summary . . . . . . . . . . . . . . . .
.
.
.
.
.
.
.
.
.
.
.
.
.
.
.
.
.
.
.
.
.
.
.
.
.
.
.
.
.
.
.
.
.
.
.
.
.
.
.
.
.
.
.
.
.
.
.
.
.
.
.
.
.
.
.
.
.
.
.
.
.
.
.
.
.
.
.
.
.
.
.
.
.
.
.
.
.
.
.
.
.
.
.
.
.
.
.
.
.
.
.
.
.
.
.
.
.
.
.
.
.
.
.
.
.
.
.
.
.
.
.
.
.
.
.
.
.
.
.
.
.
.
.
.
.
.
.
.
.
.
.
.
.
.
.
17
17
18
19
20
24
25
25
26
27
.
.
.
.
.
.
.
.
.
.
.
.
.
.
.
.
.
.
.
.
.
.
.
.
.
.
.
.
.
.
.
.
.
.
.
.
.
.
.
.
.
.
.
.
.
.
.
.
.
.
.
.
.
4 Setup
29
4.1
Model and Material . . . . . . . . . . . . . . . . . . . . . . . . . . . . . . . 29
4.2
Optical Scanning System . . . . . . . . . . . . . . . . . . . . . . . . . . . . 31
vii
viii
I
Contents
Steady Streaming in ITDD
35
5 Introduction
37
6 Steady Streaming Theory
39
6.1
Introduction . . . . . . . . . . . . . . . . . . . . . . . . . . . . . . . . . . . 39
6.2
Annular Gap with Slowly Varying Cross Section . . . . . . . . . . . . . . . 40
6.3
Key Features of Axi-symmetric Steady Streaming . . . . . . . . . . . . . . 42
7 Numerical Investigation of Steady Streaming
7.1
Introduction . . . . . . . . . . . . . . . . . . . . . . . .
7.2
Case I: Straight Annular Gap with Injection Catheter
7.3
Case II: Geometry From Visible Human Database . . .
7.4
Numerical Method and Validation . . . . . . . . . . .
7.5
Results: Case I . . . . . . . . . . . . . . . . . . . . . .
7.6
Results: Case II . . . . . . . . . . . . . . . . . . . . . .
7.7
Summary of the Numerical Study . . . . . . . . . . . .
.
.
.
.
.
.
.
.
.
.
.
.
.
.
.
.
.
.
.
.
.
.
.
.
.
.
.
.
.
.
.
.
.
.
.
.
.
.
.
.
.
.
.
.
.
.
.
.
.
.
.
.
.
.
.
.
.
.
.
.
.
.
.
.
.
.
.
.
.
.
.
.
.
.
.
.
.
45
45
45
46
47
48
51
55
8 Experimental Investigation of Steady Streaming
8.1
Notes on the Setup . . . . . . . . . . . . . . . . .
8.2
Procedure . . . . . . . . . . . . . . . . . . . . . .
8.3
PIV Results . . . . . . . . . . . . . . . . . . . . .
8.4
Summary of the PIV study . . . . . . . . . . . .
.
.
.
.
.
.
.
.
.
.
.
.
.
.
.
.
.
.
.
.
.
.
.
.
.
.
.
.
.
.
.
.
.
.
.
.
.
.
.
.
.
.
.
.
57
57
58
59
63
.
.
.
.
.
.
.
.
.
.
.
.
9 Conclusions
65
II
67
Mixing phenomena in ITDD
10 Introduction
69
11 Quantitative LIF
11.1 Introduction . . . . . . . . . . . .
11.2 Setup . . . . . . . . . . . . . . .
11.3 Corrections for Image Distortions
11.3.1 Lens Aberrations . . . . .
11.3.2 Image Distortions . . . . .
11.3.3 Scanner Speed ξ˙ . . . . . .
11.4 Complex LIF Behavior . . . . . .
11.4.1 Collisional Quenching . . .
11.4.2 Static Quenching . . . . .
11.4.3 Laser Beam Scattering . .
11.5 Calibration Measurements . . . .
11.5.1 Procedure . . . . . . . . .
11.5.2 Amplitude Dependence . .
11.5.3 Absorption . . . . . . . . .
11.5.4 Error Analysis . . . . . . .
71
71
71
72
72
74
75
76
76
77
79
81
81
81
82
82
.
.
.
.
.
.
.
.
.
.
.
.
.
.
.
.
.
.
.
.
.
.
.
.
.
.
.
.
.
.
.
.
.
.
.
.
.
.
.
.
.
.
.
.
.
.
.
.
.
.
.
.
.
.
.
.
.
.
.
.
.
.
.
.
.
.
.
.
.
.
.
.
.
.
.
.
.
.
.
.
.
.
.
.
.
.
.
.
.
.
.
.
.
.
.
.
.
.
.
.
.
.
.
.
.
.
.
.
.
.
.
.
.
.
.
.
.
.
.
.
.
.
.
.
.
.
.
.
.
.
.
.
.
.
.
.
.
.
.
.
.
.
.
.
.
.
.
.
.
.
.
.
.
.
.
.
.
.
.
.
.
.
.
.
.
.
.
.
.
.
.
.
.
.
.
.
.
.
.
.
.
.
.
.
.
.
.
.
.
.
.
.
.
.
.
.
.
.
.
.
.
.
.
.
.
.
.
.
.
.
.
.
.
.
.
.
.
.
.
.
.
.
.
.
.
.
.
.
.
.
.
.
.
.
.
.
.
.
.
.
.
.
.
.
.
.
.
.
.
.
.
.
.
.
.
.
.
.
.
.
.
.
.
.
.
.
.
.
.
.
.
.
.
.
.
.
.
.
.
.
.
.
.
.
.
.
.
.
.
.
.
.
.
.
.
.
.
.
.
.
.
.
.
.
.
.
.
.
.
.
.
.
.
.
.
.
.
.
.
.
.
.
.
.
.
.
.
.
.
.
.
.
.
.
.
.
.
.
.
.
.
.
.
.
.
ix
Contents
11.6
11.7
Increasing Dynamic Range . . . . . . . . . . . . . . . . . . . . . . . . . . . 84
Summary . . . . . . . . . . . . . . . . . . . . . . . . . . . . . . . . . . . . 84
12 Experimental Investigation of Mixing in ITDD
12.1 Introduction . . . . . . . . . . . . . . . . . . . . . . . . . . . . . . .
12.2 Procedure . . . . . . . . . . . . . . . . . . . . . . . . . . . . . . . .
12.3 Analysis . . . . . . . . . . . . . . . . . . . . . . . . . . . . . . . . .
12.3.1 Parametric Modeling . . . . . . . . . . . . . . . . . . . . . .
12.3.2 Data Reduction . . . . . . . . . . . . . . . . . . . . . . . . .
12.4 Straight Tube and Catheter . . . . . . . . . . . . . . . . . . . . . .
12.4.1 Qualitative Observations . . . . . . . . . . . . . . . . . . . .
12.4.2 Bulk movement . . . . . . . . . . . . . . . . . . . . . . . . .
12.5 Mixing Parameter Φ . . . . . . . . . . . . . . . . . . . . . . . . . .
12.6 Varying Outer Wall and Catheter . . . . . . . . . . . . . . . . . . .
¯ t) . . . . . . . . . . . . . . . . . . . . . . . . . .
12.7 Axial Spread C(z,
12.7.1 Qualitative Observations . . . . . . . . . . . . . . . . . . . .
12.7.2 Influence of Characteristic Length L and Catheter Position .
12.7.3 Influence of the amplitude of the varying cross section ∆ro .
12.7.4 Measured Diffusion Coefficient Dexp . . . . . . . . . . . . . .
12.8 The Dye’s Envelope . . . . . . . . . . . . . . . . . . . . . . . . . .
12.8.1 Dispersion Above the Catheter Tip . . . . . . . . . . . . . .
12.8.2 Growth Rate of the Envelope . . . . . . . . . . . . . . . . .
12.9 Total Measured Mass in the Control Volume mCV . . . . . . . . . .
12.9.1 The Influence of the Detection Threshold . . . . . . . . . . .
12.9.2 Primary Effect of Aosc on mCV . . . . . . . . . . . . . . . .
12.9.3 Primary Influence of fosc on mCV . . . . . . . . . . . . . . .
12.9.4 Primary Influence of Qinj on mCV . . . . . . . . . . . . . . .
12.9.5 Primary Influence of ǫ on mCV . . . . . . . . . . . . . . . .
12.9.6 The Maximum of mCV . . . . . . . . . . . . . . . . . . . . .
12.9.7 Factors Influencing m
˙ CV During Injection . . . . . . . . . .
12.9.8 The Decay of mCV after Injection . . . . . . . . . . . . . . .
12.10 Qualitative Observations Regarding Buoyancy . . . . . . . . . . . .
12.11 Summary of Experimental Observations . . . . . . . . . . . . . . .
13 Conclusions
.
.
.
.
.
.
.
.
.
.
.
.
.
.
.
.
.
.
.
.
.
.
.
.
.
.
.
.
.
.
.
.
.
.
.
.
.
.
.
.
.
.
.
.
.
.
.
.
.
.
.
.
.
.
.
.
.
.
.
.
.
.
.
.
.
.
.
.
.
.
.
.
.
.
.
.
.
.
.
.
.
.
.
.
.
.
.
.
.
.
.
.
.
.
.
.
.
.
.
.
.
.
.
.
.
.
.
.
.
.
.
.
.
.
.
.
87
87
88
90
90
92
93
93
94
96
98
103
104
104
105
105
108
109
111
112
112
112
113
114
114
117
117
118
119
119
123
Nomenclature
127
Bibliography
133
Curriculum Vitae
138
x
Contents
List of Figures
1.1
1.2
Two examples of human granulomas. . . . . . . . . . . . . . . . . . . . . .
The limited distribution of injected dye in a pig spinal cord. . . . . . . . .
2.1
2.2
2.3
2.4
Histogram of the position of the catheter tip . . . . . . . . . . . . . . . .
Protocol of the clinical trial. . . . . . . . . . . . . . . . . . . . . . . . . .
The time evolution of the normalized mean VAS score. . . . . . . . . . .
Histogram of the lowest and the highest dermatome measured at any time
during the trials. . . . . . . . . . . . . . . . . . . . . . . . . . . . . . . . .
A histogram of the average position of the highest and lowest dermatome
measured at any point during the trial. . . . . . . . . . . . . . . . . . . .
Histogram of the difference between the highest and lowest measured dermatome. . . . . . . . . . . . . . . . . . . . . . . . . . . . . . . . . . . . .
2.5
2.6
2
3
. 8
. 9
. 11
. 12
. 12
. 13
3.1
3.2
3.3
3.4
Cross sections of the human spinal canal from the Visible Human Database.
A dissection image of the human spinal canal. . . . . . . . . . . . . . . . .
An illustration of enhanced diffusion in oscillatory flow. . . . . . . . . . . .
The relative increase of diffusion Denh (t)/D vs. dosc and fosc . . . . . . . . .
18
19
21
24
4.1
4.2
4.3
4.4
4.5
4.6
Schematic of the experimental setup. . . . . . . . . . . . . . . . . . .
The coordinate system used throughout this work. . . . . . . . . . . .
A schematic of a constricted varying cross section annular gap. . . . .
Typical oscillatory waveforms. . . . . . . . . . . . . . . . . . . . . . .
The injection direction ϕ in two experimental configurations. . . . . .
Schematic of the method to create a laser sheet with rotating mirrors.
29
30
31
32
32
33
6.2
Characteristic steady streaming in an annular gap with a slowly varying
outer wall shown with a vector plot of vs (r, z), and contours of the stream
function Ψs . . . . . . . . . . . . . . . . . . . . . . . . . . . . . . . . . . . . 43
The steady streaming velocity ws vs. r at zˆ = Lc /2 inside an annular gap
with a sinusoidally varying outer wall for different values of ǫ. . . . . . . . 44
max(ws ) for different values of α and Aosc . . . . . . . . . . . . . . . . . . . 44
6.3
6.4
7.1
7.2
7.3
7.4
7.5
7.6
.
.
.
.
.
.
.
.
.
.
.
.
The extracted human-like geometry that was used for the numerical computation shown inside the spinal canal. . . . . . . . . . . . . . . . . . . .
The computational grid for the human-like geometry. . . . . . . . . . . .
Comparison of numerically calculated velocity profiles with the Stokes solution for annular gap flow. . . . . . . . . . . . . . . . . . . . . . . . . . .
¯ in the planes (r = 2, θ, z), and (r, θ = 0, z). . . . . . .
A vector plot of v
A contour plot of |¯
v| in the planes (r = 2, θ, z), and (r, θ = 0, z). . . . . .
A contour plot of |vrms | in the planes (r = 2, θ, z), and (r, θ = 0, z). . . .
xi
.
.
.
.
.
.
. 46
. 47
.
.
.
.
48
49
50
50
xii
List of Figures
7.7
The computational grids of the top surface of the human-like geometry
and the standard straight annular gap used in experiments. . . . . . . . .
7.8 |vrms | of the non-singly harmonic human waveform on several cross sections extracted from the human-like geometry and inside an annular gap
of similar dimensions as our experimental setup. . . . . . . . . . . . . . .
7.9 Characteristic velocities in a plane (P4 ) extracted from the human-like
geometry. . . . . . . . . . . . . . . . . . . . . . . . . . . . . . . . . . . . .
7.10 Characteristic velocities in a plane (P3 ) extracted from the human-like
geometry. . . . . . . . . . . . . . . . . . . . . . . . . . . . . . . . . . . . .
8.1
8.2
8.3
8.4
. 51
. 52
. 53
. 54
The experimentally measured |vrms | vs. r for several oscillatory waveforms.
The measured axial steady streaming velocity ws = wˆs /(ωdosc γ) vs. r for
4 different values of ǫ compared with asymptotic theory. . . . . . . . . . .
The magnitude of the measured steady streaming |vs | in several slowly
varying cross section annular gaps, with and without the injection catheter.
The axial steady streaming component ws around the catheter tip for 3
different values of θ and 2 different values of ǫ. . . . . . . . . . . . . . . . .
11.1
11.2
11.3
11.4
11.5
11.6
11.7
11.8
11.9
59
60
61
62
Optical setup used for calibration measurements. . . . . . . . . . . . . .
Zernike correction of lens aberrations. . . . . . . . . . . . . . . . . . . . .
The optical effect of the inner cylinder on concentration measurements. .
The intensity profile across the image planes (ex ). . . . . . . . . . . . . .
The error due to rotating mirror acceleration. . . . . . . . . . . . . . . .
The effect of static quenching on the mean fluorescent intensity vs. t. . .
Transverse intensity profile of a stationary laser beam in fluorescein. . . .
The standard deviation (σ) of the normalized beam signature vs. z. . . .
Beam width of the normalized intensity profile for different C and laser
power P0 . . . . . . . . . . . . . . . . . . . . . . . . . . . . . . . . . . . . .
11.10 The fluorescein signal vs. C and P0 . . . . . . . . . . . . . . . . . . . . .
11.11 The attenuation constant a vs. concentration C. . . . . . . . . . . . . . .
.
.
.
.
.
.
.
.
72
73
74
75
76
78
80
80
12.1 Illustration of the method of presenting the parametric models. . . . . .
12.2 (θ, z)-projections of dye dispersion after an injection with the metal injection catheter oriented at 2 different ϕ. . . . . . . . . . . . . . . . . . . . .
12.3 (θ, z)-projections of dye dispersion after an injection with the Medtronic
silicone injection catheter oriented at 2 different ϕ. . . . . . . . . . . . .
12.4 The axial position of the center of gravity of the dye zg , and the parametric
model for the mean axial position of the dye. . . . . . . . . . . . . . . . .
12.5 The parametric model for the ratio of the mean top and bottom disappearance rates computed with a simple bin model. . . . . . . . . . . . . .
12.6 Three typical curves of Φ vs. t. . . . . . . . . . . . . . . . . . . . . . . . .
12.7 Parametric models for min(Φ), and Φ(t = 1500s). . . . . . . . . . . . . .
12.8 (θ, z)-projections of dye dispersion after an injection with the metallic injection catheter placed near a constricted outer wall. . . . . . . . . . . .
12.9 Single plane (r, θ = 0, z) concentration measurements above the injection
catheter in a constant cross section geometry. . . . . . . . . . . . . . . .
. 91
. 81
. 82
. 83
. 93
. 94
. 95
. 96
. 97
. 97
. 99
. 100
List of Figures
12.10 Single plane (r, θ = 0, z) concentration measurements above the injection
catheter in a constricted geometry. . . . . . . . . . . . . . . . . . . . . . .
12.11 Single plane (r, θ = 0, z) concentration measurements above the injection
catheter in an expanded geometry. . . . . . . . . . . . . . . . . . . . . . .
¯ t) of a single fast bolus injected with a metal, or silicone catheter
12.12 C(z,
inside a constant cross section annular gap. . . . . . . . . . . . . . . . . .
¯ t) of a single fast (Qinj = 0.4 µl/s) bolus injected with a metal catheter
12.13 C(z,
placed inside 2 constricted annular gaps with different ǫ. . . . . . . . . .
¯ t) of a single fast bolus injected with a metal catheter inside 2 ex12.14 C(z,
panded annular gaps with different ǫ. . . . . . . . . . . . . . . . . . . . .
¯ t) of a single fast bolus injected with a metal catheter inside a stacked,
12.15 C(z,
or repetitive, expanded geometry. . . . . . . . . . . . . . . . . . . . . . .
12.16 The computed theoretical variance σ 2 vs. t. for 1D axial diffusion in a
limited size CV for different detection thresholds. . . . . . . . . . . . . .
12.17 Three examples of calculating an enhanced diffusion coefficient and a comparison of Dexp with Denh . . . . . . . . . . . . . . . . . . . . . . . . . . .
12.18 The computed theoretical envelope of the dye vs. t. for 1D axial diffusion
in a limited size CV for different detection thresholds. . . . . . . . . . . .
12.19 Two typical dye boundary curves as determined using the detection limit
of the setup as a threshold on the axial concentration. . . . . . . . . . . .
12.20 The parametric models for the typical height of the envelope above the
catheter tip, and the time it takes the envelope to reach a point 14 mm
above the catheter tip. . . . . . . . . . . . . . . . . . . . . . . . . . . . .
12.21 The parametric model for the growth rate of the envelope away from the
catheter tip. . . . . . . . . . . . . . . . . . . . . . . . . . . . . . . . . . .
12.22 The theoretical variance mCV vs. t. for 1D axial diffusion in a limited size
CV for different detection thresholds. . . . . . . . . . . . . . . . . . . . .
12.23 The primary influence Aosc on mCV vs. t inside a constant cross section
and a slowly varying constricted cross section annular gap. . . . . . . . .
12.24 The primary influence fosc on mCV vs. t inside a constant cross section
and a slowly varying constricted cross section annular gap. . . . . . . . .
12.25 The primary influence Qinj on mCV vs. t inside a constant cross section
annular gap. . . . . . . . . . . . . . . . . . . . . . . . . . . . . . . . . . .
12.26 The primary influence ǫ on mCV vs. t inside a slowly varying constricted
cross section annular gap for high and low Qinj . . . . . . . . . . . . . . .
12.27 The primary influence ǫ on mCV vs. t inside a slowly varying expanded
cross section annular gap for high and low Qinj . . . . . . . . . . . . . . .
12.28 The average effect of L of the varying cross section annular gap on the
dispersion. . . . . . . . . . . . . . . . . . . . . . . . . . . . . . . . . . . .
12.29 The parametric models for max(mCV ) and the linear slope of mCV during
injection. . . . . . . . . . . . . . . . . . . . . . . . . . . . . . . . . . . . .
12.30 The parametric model for the decay of mCV after the injection. . . . . .
12.31 Qualitative observations regarding the influence of 0.3% (mass) glucose on
the dispersion of dye. . . . . . . . . . . . . . . . . . . . . . . . . . . . . .
xiii
. 101
. 102
. 104
. 106
. 107
. 107
. 108
. 109
. 109
. 110
. 110
. 111
. 112
. 113
. 114
. 115
. 115
. 116
. 116
. 117
. 118
. 120
xiv
List of Figures
List of Tables
2.1
2.2
2.3
Patient Statistics. . . . . . . . . . . . . . . . . . . . . .
A summary of the drug delivery used during the trials.
The average minimum and maximum blood pressure at
bolus injection . . . . . . . . . . . . . . . . . . . . . .
. . . . . . . . . . . . 8
. . . . . . . . . . . . 10
any point after the
. . . . . . . . . . . . 13
11.1 Zernike model coefficients, including a 95% confidence interval. . . . . . . . 74
11.2 The measured destruction rate of fluorescein. . . . . . . . . . . . . . . . . . 78
12.1 The range of variables used for the investigation of mixing. . . . . . . . . . 89
12.2 Slowly varying cross section geometries used for LIF experiments. . . . . . . 89
12.3 The range of responses measured in the parametric models. . . . . . . . . . 121
xv
xvi
List of Tables
Chapter 1
Introduction to Intrathecal Drug Delivery
1.1
Intrathecal Drug Delivery
The management of pain often involves the administration of a number of analgesic drugs.
The most common route is the systemic administration, that is by mouth or by intramuscular, subcutaneous or intravenous injections. The majority of potent analgesic drugs act
through the stimulation of cellular receptors that are mostly located in the central nervous
system (CNS). With systemic administration, a drug is distributed throughout the body.
Diffusion into the CNS is however impaired by anatomical as well as functional obstacles referred to as the blood-brain barrier (BBB). This results in a concentration gradient
between the CNS and the plasma, implying that high blood levels must be achieved in
order to reach appropriate concentrations in the cerebral spinal fluid (CSF). These difficulties can be bypassed by delivering the medication directly in the CSF, i.e. by intrathecal
administration.
Intrathecal drug delivery (ITDD) has been used since the early 80’s [16]. The basic
technique has not changed much since, and ITDD has become an accepted method of
controlling severe pain due to cancer, or chronic disease [49]. The doses required to obtain
a given clinical effect are much lower and the adverse effects are also attenuated. In
addition, intrathecal delivery permits the administration of drugs that cannot be given
systemically because of metabolic or other biochemical reasons. Successful treatment
requires that the drugs, often containing morphine, reach the nerves inside the spinal
cord responsible for the pain signals. The action of the drugs stops or attenuates the
transmission of the pain signals to the brain.
Technically, access to the CNS requires invasive procedures that are expensive and are
associated with higher risks than conventional drug therapy. In concrete terms, a catheter
must be placed close to the spinal cord, into the CSF, and connected to a subcutaneous
pump. The catheter runs from the point of entry in the spinal canal (typically in the lower
lumbar region) up to the specific level of the spinal cord the clinician wants to target. The
entire system is implanted under the skin and the pump can be programmed according to
the patientŠs needs, for example by changing the flow rate delivered by the device. The
continuous injection rate of the pump is usually less than 1 milliliter per day. Some pumps
allow patients to self-administer a small bolus injection at the rate of several milliliters
per hours during a few minutes.
Although intrathecal drug delivery devices are commonly used in routine pain management, their utilization is considered only when conventional pharmacotherapy fails, either
because of lack of efficacy or intractable side effects. Hence, the number of patients for
whom these techniques are required is small.
1
2
Chapter 1. Introduction to Intrathecal Drug Delivery
1.2
Literature on ITDD
Unfortunately, the spread of the drug and the efficacy of intrathecal treatment have been
rather unpredictable. Medical research related to ITDD has been reviewed recently by
Hocking and Wildsmith [36]. They conclude that the drug distribution depends on a large
number of variables related to the characteristics of the injected solution, the clinical technique, and patient characteristics, but ultimately cannot explain the variance in patient
response. In 2004 Buchser et al. [11] have published a clinical observation that suggests
that using a higher flow rate can be used to obtain a clinically significant pain reduction.
This observation has since then been largely confirmed in a clinical trial performed at
the Morges hospital, Switzerland, in parallel to this work, and we discuss the results in
chapter 2. Although clinical trials are justifiably considered as the gold standard of ITDD
research, results often suffer from a limited number of patients, patient variability, and
scattered response to treatment. Furthermore, ethical restrictions limit the scope of any
trial.
Much research is therefore done in live animal models such as sheep [34], dogs [79],
and rats [20]. These studies tend to focus on the toxicity and absorption of the drugs in
the surrounding tissues, and not so much on the actual dispersion of the drug. Recent
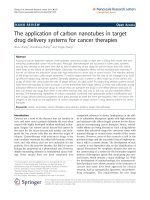
work by Allen et al. [2] suggests that the formation of granulomas, a mass of chronically
inflamed tissue that is usually associated with infected tissue, is directly linked to the
concentration of injected morphine. Granulomas are dangerous because they can lead to
spinal cord compression and even tissue necrosis. They are also associated with a decrease
in clinical effect (see for example Deer et al. [18]). These masses often appear near the
catheter tip, as is shown qualitatively with two examples in figure 1.1.
(a)
(b)
Catheter tip
Figure 1.1: Two examples of human granulomas from (a) Miele et al. [46], and (b) Cabbell
et al. [12] The granulomas (inside the white ellipses) are in the direct vicinity of the catheter
tip, which suggests that the concentration is highest near the catheter tip.
3
1.3. Research Questions
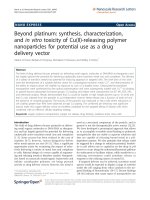
Bernards [6] recently published an article using a live pig model that focuses specifically
on the dispersion of drugs in the subarachnoid space. Based on real-time measurements
using dialysis probes and post-sacrifice observations of the spinal cord (see figure 1.2), he
concludes that the drug spread is limited O(cm) for all injection speeds, but slightly higher
for higher injection speeds. This suggests that Buchser’s previously mentioned observation
L ∼ 6 cm
(c)
(b)
(a)
Injection catheter position
Figure 1.2: The (a) posterior, (b) lateral, and (c) anterior view of a spinal cord of a small pig
after the injection of a contaminant dye using an (schematically shown) intrathecal catheter.
The dye remains relatively concentrated near the tip, and azimuthal spread is limited. Images
used with permission from Bernards [6].
is related to drug spread. The limited drug distribution increases the importance of
the position of the catheter to reach specific nerves, however this is difficult to control.
Furthermore, a limited spread leads to high local concentrations around the catheter tip
which, depending on the drug, may lead to the formation of granulomas. These factors
contribute to the increasing realization that limited drug spread is a fundamental problem
of ITDD.
Although animal models are very useful to determine the safety of the treatment
they offer little explanation for the fundamental processes affecting drug spread. For this
reason it is difficult to know exactly whether the drug distribution in the CSF is animal
independent, or whether they are representative for the human body. Several authors
have created complex in vitro models of the subarachnoid space aiming to understand drug
spread and related toxicity issues [53],[55], and [57]. These models, however, systematically
neglect important physiological parameters such as the oscillation of the CSF.
1.3
Research Questions
Clinical observations and animal models suggest that the limited spread of drugs in the
CSF during ITDD can cause potentially harmful side effects such as granulomas, and can
4
Chapter 1. Introduction to Intrathecal Drug Delivery
limit the clinical efficacy due to inaccurate positioning of the catheter. We therefore hypothesize that a larger spread should have a positive clinical effect. Given the fundamental
lack of understanding concerning the mechanisms of drug spread, the goal of this work is
therefore twofold:
1. Identify and study the fundamental mechanisms responsible for drug spread in
ITDD, i.e. from the moment the drug is injected to the moment where it is absorbed in the spinal cord or surrounding tissue.
2. Investigate how these mechanisms interact and how they can be successfully used to
increase the spread of the drug.
In order to experimentally study the dispersion of hydrophilic drugs in ITDD, we built
a simplified model of the subarachnoid space and used a fluorescent dye to simulate the
drug dispersion. We used laser induced fluorescence (LIF) measurements to quantify the
mixing process. We have also performed particle image velocimetry (PIV) measurements
to characterize the convective accelerations acting upon the dye. We note that a complete
analysis of the efficacy of ITDD for severe pain patients would additionally require intimate
knowledge of chronic pain mechanisms, pharmacology and complete pharmacokinetics1 ,
which goes beyond the scope of this work.
1.4
Scope
This thesis is composed of three parts. The remainder of the first part is composed of two
chapters. Chapter 2 describes the clinical trials performed at the Morges Hospital to test
the effect of a small but relatively fast bolus injection of local anesthetic. We attempt to
quantify the clinical effect in terms of experienced pain, cardiovascular, and neurological
changes. Intended as a confirmation of clinical observations, they are complementary to
the purely fluid mechanical work that is the backbone of this thesis. In chapter 3 we
discuss salient features of the subarachnoid space and provide a theoretical background of
the dispersion mechanisms involved in ITDD. In addition, we describe the experimental
setup that was used to study the mechanisms dispersing a drug, or local anesthetic.
The second part of the thesis specifically addresses the non-linear phenomenon of
steady streaming in relation to the geometry of the subarachnoid space. This dispersion is
related to convective accelerations in oscillatory flow. Chapter 6 provides a short historical
overview and describes an analytical model of the steady streaming in an annular gap
with a slowly varying cross section. In chapter 7 we present the results of an exploratory
numerical study that addresses 3D steady streaming related to the injection catheter
and the inside a realistic model of the subarachnoid space. We discuss the experimental
validation of the axi-symmetric model and the catheter generated steady streaming in
chapter 8.
The third and final part of this thesis concerns the quantitative study of dispersion
mechanisms using LIF. We use a high frequency laser scanning setup to obtain quasiinstantaneous cross sections of dye concentration. Besides a full calibration and error
1
Pharmacokinetic is defined as the action of drugs in the body, including the processes of absorption,
metabolism, transformation, distribution to tissues, and elimination.
1.4. Scope
5
analysis, we address the influence of laser scattering, absorption, and quenching on the LIF
technique in chapter 11. Finally, in chapter 12 we discuss the dispersion of the fluorescent
dye in our experimental model of the subarachnoid space. We specifically address the
influence of the injection catheter and its orientation, the varying cross section of the
annular gap, the frequency and amplitude of oscillation of the CSF, the injection speed,
and buoyancy on the dispersion of the dye. Where possible we use simple parametric
modeling to identify the most important factors influencing drug spread. The conclusions
of this thesis are presented in chapter 13.
6
Chapter 1. Introduction to Intrathecal Drug Delivery
Chapter 2
Clinical trial
2.1
Introduction
The administration of drugs directly into the cerebrospinal fluid (CSF) has become increasingly popular in the last two decades. The intrathecal (IT) route has clear advantages
that include the delivery of medication directly into the central nervous system (CNS),
close to its site of action on the neuronal receptors of the central nervous tissue. This
results in an increased effect even when only a fraction of the systemic dose is delivered. In addition, ITDD provides the possibility to use drugs such as local anaesthetics
that cannot be administered systemically. The magnitude of the analgesic effect increases
when the dose of an analgesic drug is raised. However, the appropriate dose escalation is
often limited by the occurrence of side effects. Therefore, one or more drugs, usually of
another class (i.e. with different mechanisms of action) must be co-administered in order
to improve analgesia and minimise the dose-dependent undesirable effects. While only a
very small number of drugs are approved for long-term IT administration, a survey [33]
has suggested that in routine clinical practice, more than half of the patients receive a
large variety of IT drugs. The most commonly used IT medication is morphine or one
of its derivatives, hydromorphone. Yet, because lack of efficacy remains a problem, the
adjunct of bupivacaine (a local anaesthetic (LA) drug) has been advocated to improve the
analgesic efficacy in specific conditions. Although most authors reported improved pain
relief as a result of the addition of bupivacaine, all but one study are uncontrolled and
non-randomised case series. A multi-centre, double blind randomised study has showed
that even substantial daily doses of bupivacaine administered with a continuous infusion
failed to produce significant pain relief [47]. Unpublished clinical experience from a number of centres as well as one documented case study [11] suggests that the clinical effect
of intrathecally administered drugs is significantly influenced by how the medication is
delivered. This observation cannot be explained only by pharmacokinetic and pharmacodynamic factors alone and considerations related to the distribution of the medication
in the CSF must be envisaged. The parameters as well as measurement schedule used in
this study were set to detect bupivacaine-related changes, which unlike the other drugs
that were co-administered, has a short onset and duration of action. Local anaesthetics
(i.e. bupivacaine) produce a non-specific, concentrationŰdependent and reversible blockade of nerve conduction. The clinical effects of intrathecally administered LA’s include a
decrease in blood pressure, followed by sensory and motor neurological changes. Because
the spinal cord has a somatotopic organisation, the site of delivery of LA is an important
determinant of the clinical response. LA administered at the thoracic or lumbar levels will
predominantly affect thoracic or lumbar nerve distributions, referred to as dermatomes.
The area affected by the action of LA is commonly assessed by the number and the lo7