Inelastic neutron scatiering and NEutron difractions studies
Bạn đang xem bản rút gọn của tài liệu. Xem và tải ngay bản đầy đủ của tài liệu tại đây (9.53 MB, 180 trang )
INELASTIC NEUTRON SCATTERING AND NEUTRON DIFFRACTION STUDIES
OF GAS HYDRATES
by
Kimberly Terri Tait
_________________________
A Dissertation Submitted to the Faculty of the
DEPARTMENT OF GEOSCIENCES
In Partial Fulfillment of the Requirements
For the Degree of
DOCTOR OF PHILOSOPHY
In the Graduate College
THE UNIVERSITY OF ARIZONA
2007
2
GRADUATE COLLEGE
As members of the Dissertation Committee, we certify that we have read the dissertation
prepared by Kimberly Terri Tait
entitled: INELASTIC NEUTRON SCATTERING AND NEUTRON DIFFRACTION
STUDIES OF GAS HYDRATES
and recommend that it be accepted as fulfilling the dissertation requirement for the
Degree of Doctor of Philosophy
_____________________________________________________ Date: March 20, 2007
Dr. Robert T. Downs
_____________________________________________________ Date: March 20, 2007
Dr. Roy Johnson
_____________________________________________________ Date: March 20, 2007
Dr. Eric Seedorff
_____________________________________________________ Date: March 20, 2007
Dr. Luke Daemen
_____________________________________________________ Date: March 20, 2007
Dr. Charles Prewitt
Final approval and acceptance of this dissertation is contingent upon the candidate’s
submission of the final copies of the dissertation to the Graduate College.
I hereby certify that I have read this dissertation prepared under my direction and
recommend that it be accepted as fulfilling the dissertation requirement.
_____________________________________________________ Date: March 20,
2007Dissertation Director: Dr. Robert T. Downs
3
STATEMENT BY AUTHOR
This dissertation has been submitted in partial fulfillment of requirements for an
advanced degree at The University of Arizona and is deposited in the University Library
to be made available to borrowers under rules of the Library.
Brief quotations from this dissertation are allowable without special permission,
provided that accurate acknowledgment of source is made. Requests for permission for
extended quotation from or reproduction of this manuscript in whole or in part may be
granted by the head of the major department or the Dean of the Graduate College when in
his or her judgment the proposed use of the material is in the interests of scholarship. In
all other instances, however, permission must be obtained from the author.
SIGNED: Kimberly Terri Tait
4
ACKNOWLEDGMENTS
I would like to thank my primary thesis advisor Dr. Robert T. Downs, although
we didn’t spend a lot of time together, the time we did I will cherish. I also would like to
thank my official mentor at the Los Alamos National Laboratory Yusheng Zhao, and all
of my unofficial mentors throughout the years at the Lujan Center that helped me out
because they truly cared.
I want to thank my committee members Luke Daemen, Charlie Prewitt, Roy
Johnson, and Eric Seedorff for their valuable input on my dissertation.
Everyone at the Los Alamos Neutron Scattering Center deserves a special
recognition, if I had the room; it didn’t matter if it was 3am on a Saturday night there was
always someone at the Lujan Center that was willing to help out, or drive back from
Santa Fe on the weekend to make sure my experiment would be as successful as possible.
I would especially like to thank Luke Daemen, Darrick Williams, Monika Hartl,Wendy
Mao, Leilani Conradson, Thomas Proffen, Frans Trouw, Alan Shapiro, Eric Larson, Brad
Shurter, Mark Taylor, Melvin Borrego, Tim Medina, Sven Vogel, Cristian Pantea, and on
and on!
The funding for stipend and my thesis work was in part funded by the LDRD-DR
"Clathrate hydrate science and technology" and then, "Stabilization of Hydrogen
Clathrates --- Engineering a Solution to Hydrogen Storage" as well as a generous
donation of money for the RRUFF project at the University of Arizona by Mike Scott.
Financial support for travel and expenses for my thesis were provided in part by P.E.O.
Scholar award Norah L. Wallace named grant, the International Centre for Diffraction
Data Ludo Frevel Scholarship, the Tucson Gem and Mineral Society scholarship and the
American Association of Petroleum Geologist Marta Sutton Weeks named grant.
I especially would like to thank my fiancé Sal Sena and my parents Alf and Peggy
Tait for their continued support.
5
TABLE OF CONTENTS
LIST OF FIGURES ......................................................................................................................... 8
LIST OF TABLES......................................................................................................................... 15
ABSTRACT................................................................................................................................... 16
Chapter 1 CLATHRATE HYDRATES......................................................................................... 17
1.1 Introduction to Clathrates .................................................................................................... 17
1.1.1 Structure I...................................................................................................................... 20
1.1.2 Structure II .................................................................................................................... 22
1.1.3 Structure H .................................................................................................................... 24
1.2 Filling the hydrate cages ...................................................................................................... 24
1.3 Natural gas hydrate samples ................................................................................................ 26
Chapter 2 GAS HYDRATE SYNTHESIS APPARATUS AND NEUTRON DIFFRACTION
RESULTS ...................................................................................................................................... 30
2.1 Motivation............................................................................................................................ 30
2.2 USGS gas hydrate synthesis apparatus ................................................................................ 30
2.3 Low-Temperature Scanning Electron Microscopy (LTSEM) ............................................. 38
2.4 Methane-ethane hydrate....................................................................................................... 40
2.5 Introduction to neutrons....................................................................................................... 42
2.6 Los Alamos Neutron Scattering Center (LANSCE) ............................................................ 43
2.7 Neutron scattering of pre-synthesized samples.................................................................... 45
2.7.1 HIPPO and ancillary equipment ................................................................................... 45
2.7.2 Results methane 77.93% ethane 22.07% (norm.) sample............................................. 48
2.7.3 Results methane 82.93% ethane 17.07% (norm.) sample............................................. 49
2.7.4 Results 50% methane, 50% ethane sample................................................................... 50
2.7.5 Results 100% Ethane gas hydrate sample..................................................................... 51
2.8 Los Alamos gas hydrate apparatus....................................................................................... 52
Chapter 3 INELASTIC NEUTRON STUDIES OF TETRAHYDROFURAN CLATHRATE
WITH HYDROGEN...................................................................................................................... 57
3.1 Introduction.......................................................................................................................... 57
3.2 Previous work ...................................................................................................................... 58
3.3 Motivation of experiment .................................................................................................... 65
6
TABLE OF CONTENTS - Continued
3.4 Experimental details- Introduction....................................................................................... 65
3.4.1 Pharos spectrometer ...................................................................................................... 66
3.4.2 Pharos experimental details .......................................................................................... 68
3.4.3 NIST Center for Neutron Research and DCS ............................................................... 72
3.4.4 Disk Chopper Spectrometer (DCS) experimental details ............................................. 72
Chapter 4 INELASTIC NEUTRON STUDIES OF ETHYLENE OXIDE CLATHRATE........... 74
4.1 Motivation............................................................................................................................ 74
4.2 Structure............................................................................................................................... 74
4.3 Dynamics: previous work .................................................................................................... 77
4.4 Dynamics: neutron scattering .............................................................................................. 82
4.4.1 The Filter Difference Spectrometer (FDS) ................................................................... 83
4.4.2 Synthesis of the deuterated ethylene oxide clathrate .................................................... 85
4.4.3 Ethylene oxide clathrate: Results.................................................................................. 87
4.4.4 Adding hydrogen .......................................................................................................... 93
4.5 Summary.............................................................................................................................. 96
Appendix A METHANOL- INHIBITOR OR PROMOTER OF THE FORMATION OF GAS
HYDRATES FROM DEUTERATED ICE? ................................................................................. 97
Abstract...................................................................................................................................... 98
Introduction................................................................................................................................ 99
Experimental Details................................................................................................................ 101
Results and Discussion ............................................................................................................ 104
Appendix B HIGH-P/LOW-T NEUTRON SCATTERING OF HYDROGEN INCLUSION
COMPOUNDS—PROGRESS AND PROSPECTS.................................................................... 121
Abstract.................................................................................................................................... 122
Introduction.............................................................................................................................. 124
Results and Discussion ............................................................................................................ 126
Experimental Techniques......................................................................................................... 140
Appendix C INELASTIC NEUTRON SCATTERING STUDY OF HYDROGEN IN D8THF/D2O ICE CLATHRATE...................................................................................................... 142
Abstract.................................................................................................................................... 143
Introduction.............................................................................................................................. 144
7
TABLE OF CONTENTS - Continued
Methods ................................................................................................................................... 145
Results...................................................................................................................................... 148
Discussion................................................................................................................................ 155
Conclusion ............................................................................................................................... 170
Acknowledgments.................................................................................................................... 171
REFERENCES ............................................................................................................................ 172
8
LIST OF FIGURES
Figure 1. The phase diagram of ice showing phases I – XI. Amorphous phases and Ice XII are not shown.
.............................................................................................................19
Figure 2. Global distribution of gas hydrates from:
........................................................................20
Figure 3a. 512 small cage (pink) and 51262 cage (blue) in the structure I clathrate structure; 3b. Ball and stick
diagram of the oxygen (blue) and hydrogen (grey) of the structure I 512 cage (left) and 51262 cage (right) with the
axes labeled. .........................................................................................................................................................22
Figure 4a. 512 small cage (pink) and 51264 cage (green) in the structure II clathrate structure; 4b. Ball and stick
diagram of the oxygen (blue) and hydrogen (grey) of the structure II cages........................................................23
Figure 5. 512 small cage (pink), the 435663 medium cage (purple) and the 51268 large cage (yellow). ..................24
Figure 6. Comparison of guest molecule sizes and cavities occupied as simple hydrates (Sloan, 1998a). ..........25
Figure 7. The inside of the sample preparation freezer at the USGS gas hydrate lab. Note the triply-distilled ice
for the starting materials in freezer bags, top left, blender for freezing in the bottom left, and two sieves center
and right-center.....................................................................................................................................................32
Figure 8. Photograph of the gas hydrate synthesis apparatus at the USGS. A conventional household freezer is
used to cool the fluid that surrounds the two suspended samples and the gas reservoir. A heating element under
the bath controls the temperature of the fluid. ......................................................................................................33
Figure 9a. Schematic drawing of the USGS gas hydrate synthesis apparatus (modified from Stern et al., 2000);
9b. Schematic drawing of the reaction between the ice and gas...........................................................................34
Figure 10a. P-T-t plot of a synthesis run of a 90% methane- 10% ethane (starting) gas hydrate at the USGS.
Note the thermal anomaly at 273K due to the supercooled water freezing abruptly with an error pointing out the
freezing anomaly. 10b. Fully converted gas hydrate from synthesis apparatus in indium sleeve (from Stern et
al., 2000)...............................................................................................................................................................35
Figure 11. Final gas concentrations of the second sample (methane/ethane) in a gas hydrate run at the USGS
Organic Geochemistry Mass Spectrography Laboratory......................................................................................37
Figure 12. Examples of dissociation features of the methane-ethane hydrate with the LTSEM; scale is shown in
bottom of the photos.............................................................................................................................................39
Figure13a. Cohesive methane-ethane hydrate sample with porosity; 13b. granular ethane hydrate with
individual crystal morphology shown. Scale of images shown on photos. .........................................................40
Figure 14. Predicted composition region for the structural transition to occur (Subramanian et al., 2000a)........41
Figure 15. Comparison of atomic number dependence vs. scattering length, b for X-rays and neutrons (Krawitz,
2001).....................................................................................................................................................................43
9
LIST OF FIGURES - Continued
Figure 16. Schematic diagram of the two experimental areas at the Lujan Center, experimental area-1 and -2
(ER-1 and ER-2), where 17 available flight paths surround the tungsten target (figure supplied by LANSCELujan Center)........................................................................................................................................................44
Figure 17. Schematic of the HIPPO chamber, denoting the beam path through the diffractometer, the sample
chamber, and the panels of detectors (figure supplied by LANSCE-Lujan Center).............................................45
Figure 18a) top-hat setup being craned into NPDF (photo courtesy of Thomas Proffen); 18b) typical closed
cycle refrigerator for neutron experiments used at LANSCE (from ......46
Figure 19a. Schematic general view (top left corner) and the enlarged section view of the setup designed for
high-pressure, low-temperature hydrostatic experiments at LANSCE (Lokshin and Zhao, 2005); 19b. photo of
internal cell at liquid nitrogen temperatures attached to the closed cycle cryostat (photo courtesy of K.A.
Lokshin). ..............................................................................................................................................................47
Figure 20. Rietveld LeBail fit (green line) of the three-phase methane-ethane gas hydrate diffraction pattern (red
marks) with the
2
= 3.24; ticks on the bottom of the figure show the d-spacing positions of the three phases:
structure II- black, ice- red, structure I- blue) and some of the major peaks have been identified with arrows for
ease of comparison. ..............................................................................................................................................49
Figure 21. Rietveld LeBail fit (green line) of the three-phase methane-ethane gas hydrate diffraction pattern (red
marks) with the
2
= 3.45; ticks on the bottom of the figure show the d-spacing positions of the three phases:
structure II- black, ice- red, structure I- blue) and some of the major peaks have been identified with arrows for
ease of comparison. ..............................................................................................................................................50
Figure 22. Rietveld fit (green line) of the 50:50 methane-ethane gas hydrate diffraction pattern (red marks);
ticks on the bottom of the figure show the d-spacing positions of the three phases: structure II- black, ice- red,
structure I- blue). Some of the major peaks have been identified with arrows for ease of comparison. .............51
Figure 23. Rietveld LeBail fit (green line) of the two-phase ethane gas hydrate diffraction pattern (red marks)
with the
2
= 2.22; ticks on the bottom of the figure show the d-spacing positions of the three phases: structure I-
black, ice- red) and some of the major peaks have been identified with arrows for ease of comparison. ............52
Figure 24. Early conceptual design of the gas hydrate gas handling system at the Los Alamos Neutron
Scattering Center. .................................................................................................................................................53
Figure 25. Schematic diagram of the gas hydrate synthesis apparatus with valve numbers and lengths of tubing.
..............................................................................................................................................................................55
Figure 26. Picture of gas hydrate synthesis apparatus at LANSCE, inset- schematic diagram of final gas hydrate
synthesis apparatus at LANSCE...........................................................................................................................55
Figure 27. LabVIEW front panel for gas hydrate syntheses at Los Alamos.........................................................56
10
LIST OF FIGURES - Continued
Figure 28. Volume of 4 kg of hydrogen compacted in different ways, with size relative to the size of a car
(Schlapbach and Zuttel, 2001)..............................................................................................................................58
Figure 29a) The sII crystal structure consisting of 51264 and 512 cages; b) the tetrahedral cluster of four hydrogen
molecules in the 51264 cage; c) a cluster of two hydrogen molecules oriented towards opposite pentagonal faces
in the 512 cage. ......................................................................................................................................................59
Figure 30. Temperature dependence of D2 occupancy in the large (diamond symbols) and small (circle symbols)
cages of the hydrogen clathrate hydrate structure. Open and filled symbols represent data obtained at ambient
and high (~ 2 kbar) pressures, respectively. Data points with no error bars represent the values, which were
fixed in the final refinements but were refined in the range 3.8(2) – 4.2(2) for the large cage and 0.9(1) –1.1(1)
for the small cage in the initial refinements. No significant correlation between large and small cage occupancy
parameters was observed (Lokshin et al., 2004)...................................................................................................60
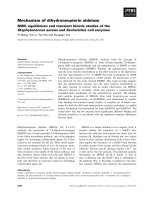
Figure 31. Sketch of a tetrahydrofuran molecule (C4H8O) the oxygen has two lone pairs of electrons sticking out
from the ring. These electron pairs represent a large electronic density and make it easy for THF to participate
intermolecular bonding, e.g., via hydrogen bonding. ...........................................................................................61
Figure 32. H2 gas content (wt %) as a function of THF concentration and a schematic diagram of H2 distribution
in the cages of THF + H2 hydrate (Lee et al., 2005).............................................................................................63
Figure 33a. Observed Fourier map of the THF-d8 system centered in the 51264 cavity at (3/8, 3/8, 3/8) with the
ring of density attributed to the THF-d8 molecule and the density contours on the edges due to the water
molecules. The map size is 10 Å, and the contours are drawn at 0.1 – 10 fm. 6b. Observed Fourier map of the
D2 + THF-d8 system centered in the 512 cavity at (0,0,0) with the single hydrogen molecule centered in the
picture and the other density contours attributed to portions of the water cage. The map size is 8 Å, and
contours are drawn at 0.2 – 2.0 fm. Both are figures from Hester et al., 2006. ...................................................64
Figure 34. Summary of hydrogen cage occupancies in gas hydrates
( ...............................................................66
Figure 35. Schematic of the High-Resolution Chopper Spectrometer, Pharos at LANSCE (supplied by
LANSCE-Lujan Center).......................................................................................................................................67
Figure 36a. Schematic of the gas hydrate cell designed at LANSCE for Pharos experiments; 9b. Cutaway view
of the internal structure of the cell- seven sample wells, split by 1/10” Al for safety concerns (supplied by M.
Taylor, designer from LANSCE). ........................................................................................................................68
Figure 37. Schematic of gas handling system (V = valve, and BD = burst disk) and picture of actual setup on top
of the Pharos instrument. ......................................................................................................................................71
Figure 38. Schematic of isotope substitution of experiments on THF + H2 on Pharos. .......................................71
Figure 39. ILL designed liquid helium bath orange cryostat................................................................................73
11
LIST OF FIGURES - Continued
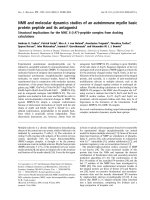
Figure 40. The ethylene oxide molecule. The molecule is significantly larger than methane and is highly polar
(dipole moment 1.88 Debye -virtually identical to that of water) owing to the large electron density on the
oxygen atom (figure from L. L. Daemen). ...........................................................................................................75
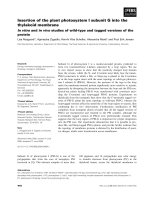
Figure 41. The crystal structure of C2H4O.6.86H2O as determined by McMullan and Jeffrey (1965) by single
crystal X-ray diffraction at 243 K. Ethylene oxide is not shown for clarity; each O-O bond shows two sites for
hydrogen. Each site has an average occupancy of 0.5 and two unit cells are shown. Two large cages
(tetrakaidecahedra) are clearly visible at the center of the figure. Dodecahedra appear at the center of each
cubic unit cell. ......................................................................................................................................................76
Figure 42. The 51262 structure I tetrakaidecahedron cage with only the oxygen atoms of the cage shown, with
two preferred orientations of the ethylene oxide molecule shown (McMullan and Jeffrey, 1965). .....................77
Figure 43. Frequency distributions at 30 K, 90 K and 214 K (Wegener et al., 1978). .........................................82
Figure 44. Schematic of the Filter Difference Spectrometer (FDS) at LANSCE (Supplied by LANSCE-Lujan
Center). .................................................................................................................................................................83
Figure 45. Setup for the synthesis of ethylene oxide clathrates. A carefully measured volume of D2O is placed
in a glass tube connected to valve C. The D2O is frozen with liquid nitrogen and with valves B, C, S, and V
open (A closed) the apparatus is evacuated. Subsequently V, S, and C are closed and with B open, A is opened
to fill the calibrated volume connected to valve B. Once the desired pressure of ethylene oxide is reached in the
calibrated volume, valve A and B are closed and the apparatus is again evacuated to remove residual ethylene
oxide in the apparatus. Valves B, C, and S are then opened to condense the ethylene oxide in the calibrated
volume into the glass tube containing D2O. When the pressure in the calibrated volume falls to zero, valve C
and S are closed and the sample tube is disconnected (between C and S) from the vacuum line. Its content is
allowed to warm up to room temperature. Gentle mechanical agitation then allows for thorough mixing of D2O
and ethylene oxide. The solution is then transferred to an aluminum sample holder (for neutron scattering) and
slowly cooled below its freezing point to form the clathrate................................................................................87
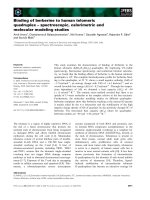
Figure 46. Neutron vibrational spectrum of ethylene oxide clathrate collected at 10 K on FDS. Peaks A, B, and
C are the librational modes of ethylene oxide. The labeling corresponds to that used by Wegener et al. (1978)
(see Figure 43). Peak D and the broad band E are discussed in the text. The arrows indicate two shoulders that
were not present in the Wegener et al. result........................................................................................................88
Figure 47. The high frequency portion of ethylene oxide clathrate. The solid line is a maximum entropy
reconstruction of the vibrational spectrum. ..........................................................................................................91
Figure 48. Neutron vibrational spectrum of hydrogen loaded in ethylene oxide clathrate, T=40 K. The spectrum
from the pure ethylene oxide clathrate was subtracted to highlight the contribution from hydrogen. Two large
12
LIST OF FIGURES - Continued
peaks are clearly visible at 126 and 150 cm-1. The solid line is the Maximum Entropy reconstruction of the
spectrum. ..............................................................................................................................................................95
Figure A-1. A schematic drawing of the aluminum pressure cell. The cell is approximately 76 mm long and has
an inside diameter of 8 mm. ...............................................................................................................................102
Figure A-2. Virtually real time monitoring (15 minutes per histogram) of the kinetics of formation of CO2
hydrate from polycrystalline ice by in situ neutron powder diffraction. (a) Beginning of the reaction—neutron
powder diffraction pattern of the D2O ice (hexagonal structure, space group P63/mmc) at 200 K with no
pressure; A-2b. Reaction in progress, system pressurized with either CO2 or CH4—neutron powder diffraction
pattern of the mixture of hexagonal D2O ice and type-I hydrate. This pattern can be viewed as a superposition
of patterns (a) and (c), with relative intensities corresponding to the mole fractions of the two phases,
respectively. A2-c. End of the reaction, i.e., all D2O ice converted in situ to hydrate—neutron powder
diffraction pattern type-I hydrate (primitive cubic structure, space group Pm-3n) at 200 K and 7 MPa He. The yaxis (not shown) represents the intensity in arbitrary units. ...............................................................................109
Figure A-3. Conversion of deuterated ice to carbon dioxide hydrate at 6 MPa at temperatures of 263 and 253 K
(filled symbols represent the fraction of hydrate, open symbols stand for the fraction of ice). Each data point
represents the mole fraction as refined from a 15 min histogram. Data from Henning et al. (2000), courtesy of
A. J. Schultz........................................................................................................................................................110
Figure A-4. In situ neutron powder diffraction patterns of a frozen D2O + CD3OD mixture at 220 K with no
pressure (a); and the corresponding patterns 20 minutes (b) and 40 minutes (c) after the system was pressurized
with CO2 at 250 K and 1.7 MPa. Due to the rapid conversion rates, the fractions of ice and hydrate could not be
accurately refined. The y-axis (not shown) represents the intensity in arbitrary units. .....................................112
Figure A-5. Comparison between the rate of conversion of deuterated ice to carbon dioxide hydrate at 6 MPa
and at 230 K and the rate of conversion of a mixture of deuterated ice and deuterated methanol to carbon
dioxide hydrate at the same pressure and at a temperature of 200 K..................................................................115
Figure A-6. In situ neutron powder diffraction patterns of a frozen D2O + CD3OD mixture at 200 K with no
pressure (a); and the corresponding pattern 90 minutes (b) after the system was pressurized with CH4 at 200 K
and 1.7 MPa. The higher background is due to the presence of H (large incoherent scattering cross-section).
The y-axis (not shown) represents the intensity in arbitrary units......................................................................118
Figure A-7. Fitted neutron diffraction pattern of a mixed methane-ethane sI clathrate (82.93 wt% methane +
17.07 wt% ethane) with minor sII phase and D2O ice. Data are shown as red plus signs, and the green curve is
the best fit to the data. Tick marks below the pattern show the positions of allowed reflections (blue – sI phase;
red – ice; black – sII phase). The insert shows neutron patterns of methane clathrate formed from ice and D2 in
13
LIST OF FIGURES - Continued
situ in the Al pressure cell. Note that formation of methane clathrate was not complete even after 10 h at 500
bar and 270 K, indicating sluggish formation kinetics compared with hydrogen clathrate (see below). ...........128
Figure A-8. Neutron diffraction patterns of deuterium clathrates produced from (A, B) water and (C) powdered
ice, at approximately the same P-T conditions (Lokshin & Zhao, 2005). Note that the formation kinetics of D2clathrates formed from ice powder is much faster than from water. ..................................................................131
Figure A-9. Structural view of D2 distribution in the large (top) and small (bottom) cages of deuterium clathrate
(Lokshin et al, 2004). Oxygen atoms are shown as red spheres, deuterium framework atoms–green, and guest
D2 molecules–yellow. Note that the D2···D2 separation is the distance between the centers of mass of the two D2
molecules. Below 50 K, the guest D2 molecules are localized (left). With increasing temperature, the D2
molecules can rotate more freely, yielding a nearly spherical D2 density distribution (right). ...........................131
Figure A-10 (A) Fitted neutron diffraction pattern of Cu3[Co(CN)6]2 at 40 K and 10 MPa of D2 pressure. Data
are shown as red plus signs, and the green curve is the best fit to the data. Tick marks below the pattern show
the positions of allowed reflections (first row – Al cell; second row – sample). The insert shows increased unitcell volume under 10 MPa of D2 pressure at 100 K. (B) Crystal structure of Cu3[Co(CN)6]2 9H2O at ambient
condition (brown – Cu; pink – Co; black – C; light blue – N; dark blue – water). (C) Crystal structure of
Cu3[Co(CN)6]2 nH2 (green – H2) showing H2 at the (¼, ¼, ¼) site (the relatively large green sphere illustrates
free-rotation of H2 molecules in the cages). (D,E) Difference Fourier nuclear maps showing that the
incorporated D2 molecules mainly occupy the original water site (¼, ¼, ¼) (D) with some possibly associated
with Cu (E). The residual intensities at the Co and Cu sites are due to the limited resolution of our data and the
strong scattering of Co and Cu. ..........................................................................................................................135
Figure A-11. Low frequency neutron vibrational spectrum of Cu3(BTC)2 with its crystal structure shown as an
insert. Cu3(BTC)2 has three H2 equivalents adsorbed at 40 K. The curve is a maximum entropy reconstruction
of the spectrum. It enhances some details that are present in the data (dots) but may be not easy to see..........136
Figure A-12. Structure diagram of a potential hybrid material of the metal-organic framework (MOF) with the
CH4(H2)4 molecular compound encapsulated into its cage. MOF consists of metal-oxygen clusters (tetrahedra)
on the vertices of the lattice and organic linker molecules (hexagons) along its edges, which largely define the
size and shape of the cage. Blue balls in CH4(H2)4 represent CH4, and red balls represent H2. ........................138
Figure A-13. Schematic general view (in the top-left corner) and the enlarged sectional view of the
experimental setup designed for in situ high-P low-T neutron diffraction at LANSCE (Lokshin & Zhao, 2005).
............................................................................................................................................................................140
Figure A-14: Diffraction pattern from ternary clathrate H2/d8-THF/D2O at 5 K measured on DCS with an
incident wavelength of 5.5 Å. The three shaded peaks are from residual ice in the sample..............................150
14
LIST OF FIGURES - Continued
Figure A-15: Inelastic scattering spectrum from THF-ice clathrate before and after the addition of hydrogen
measured at 8 K..................................................................................................................................................151
Figure A-16: Model fit using multiple Gaussians and a sloping background for the neutron energy gain data
measured on Pharos at 8 K. ................................................................................................................................151
Figure A-17: Model fit using multiple Gaussians and a sloping background for the neutron energy loss data
measured on Pharos at 8 K. ................................................................................................................................152
Figure A-18: Neutron energy gain peaks observed on DCS at 5 K (squares) and 50 K (triangles). ..................154
Figure A-19: Upper trace is H2/d-THF/D2O measured at 8 K using an incident energy of 70 meV on Pharos.
Lower curve is the equivalent spectrum measured for TDF/D2O at 8 K using an incident energy of 120 meV.
Both curves are a sum of S(Q,E) for Q=1-5 Å-1. ................................................................................................154
Figure A-20: Two Gaussian plus sloping background fit of the Pharos data measured at 8 K with 70 meV
incident neutrons. ...............................................................................................................................................156
Figure A-21: Comparison between the prediction from the 5D quantum theoretical model (line) and the data
measured on Pharos at 8 K. ................................................................................................................................161
Figure A-22: Comparison between prediction of particle in a box model (line) and the experimental data
measured at 8 K on Pharos. ................................................................................................................................164
Figure A-23: Comparison between prediction for particle in a sphere of radius 1.8 Å (line) and the data taken on
Pharos at 8 K. .....................................................................................................................................................165
Figure A-24: Comparison between the excitations expected for particle on the surface of a sphere with radii
1.05 and 1.1 Å, and the data taken on Pharos at 8 K. .........................................................................................167
Figure A-25: Debye-Waller plots from the DCS data, with the intensity summed over the neutron energy loss
range of +/-1 meV. .............................................................................................................................................168
Figure A-26: Temperature dependence of the hydrogen molecule Debye-Waller Factor (squares). Also shown
is the variation in the zero-Q intercept of the fits in Figure A-25 (triangles, arbitrary units). ............................170
15
LIST OF TABLES
Table 1. Ratio of molecular diameters to cavity diameters for natural gas hydrates formers (modified from
Sloan, 1998b). ___________________________________________________________________________28
Table 2. Comparison of molecular compounds with Department of Energy (DOE) hydrogen storage targets
(modified from Mao and Mao, 2004)._________________________________________________________61
Table 3. Mol % THF (starting solution) vs. H2:THF mole ratio in the hydrate vs. max wt% H2 in the hydrate for
the three regions as outlined by Lee et al. 2005. _________________________________________________62
Table 4. Summary of all runs performed over 44 days of beam time on Pharos, organized by the selected
incident energy of the experiment. ___________________________________________________________70
Table 5. Absorption peaks observed in the vibrational spectrum of C2H4O · 6.86D2O by Bertie et al. (1975) at
4.3 K. __________________________________________________________________________________78
Table 6. Librational frequencies of ethylene oxide in ethylene oxide clathrate. Comparison of infrared
absorption and inelastic neutron scattering measurement. _________________________________________89
Table 7. Internal modes of enclathrated ethylene oxide measured on FDS as well as in the gas phase. _______94
Table A-1: Results from fitting the H2 scattering data measured at 8 K.______________________________152
Table A-2: Energies of the translational quantum states of ortho- and para-hydrogen predicted by (Xu et al.,
2006), and the predicted neutron energy gain transitions from the ortho-hydrogen translational ground state. 160
16
ABSTRACT
Gas hydrates (clathrates) are elevated-pressure (P) and low-temperature (T) solid
phases in which gas molecule guests are physically incorporated into hydrogen-bonded,
cage-like ice host frameworks. Natural clathrates have been found worldwide in permafrost
and in ocean floor sediments, as well as in the outer solar system (comets, Mars, satellites of
the gas giant planets). Diffraction patterns have been collected of gas hydrates at various
methane and ethane compositions by preparing samples in an ex situ gas hydrate synthesis
apparatus, and CO2 gas hydrates were prepared in situ to look at the kinetics of formation.
Storage of hydrogen in molecular form within a clathrate framework has been one of
the suggested methods for storing hydrogen fuel safely, but pure hydrogen clathrates
H2(H2O)2 form at high pressures. It has been found that mixed clathrates (a stabilizer
molecule in the large cage) and hydrogen gas together can reduce the pressures and
temperatures at which these materials form.
In situ neutron inelastic scattering experiments on hydrogen adsorbed into a fully
deuterated tetrahydrofuran water ice clathrate show that the adsorbed hydrogen has three
rotational excitations (transitions between J = 0 and 1 states) at approximately 14 meV in
both energy gain and loss. These transitions could be unequivocally assigned the expected
slow conversion from ortho- to para-hydrogen resulted in a neutron energy gain signal at 14
meV, at a temperature of 5 K (kT= 0.48 meV). A doublet in neutron energy loss at
approximately 28.5 meV are interpreted as J = 1
2 transitions.
In situ neutron inelastic scattering experiments on hydrogen adsorbed into ethylene
oxide, a structure I former, were also carried out at the Los Alamos Neutron Scattering
Center (LANSCE). There is convincing evidence (shifted rotational mode of molecular
hydrogen) that hydrogen is capable of diffusing in the small cages of ethylene oxide
clathrate. Values are also obtained for the librational modes of enclathrated ethylene oxide
and several water translation modes. Also reported for the first time are the internal modes
(higher frequencies) of ethylene oxide in ethylene oxide clathrate as measured by inelastic
neutron scattering.
17
Chapter 1
CLATHRATE HYDRATES
1.1 Introduction to Clathrates
The Merriam-WebsterTM dictionary defines the word “clathrate” as “relating to or
being a compound formed by the inclusion of molecules of one kind in the cavities of the
crystal lattice of another.” The etymology of the word clathrate can be traced to the Latin
root clathratus for “furnished with a lattice,” or clathri (plural) for “lattice”; today, the word
clathrate is used to describe compounds that display a host-guest relationship. Tetrahedrally
bound silicon “cages,” with sodium atoms as the “guest” species have been described (e.g.
Kasper, 1965), as well as germanium and tin analogs (e.g. Gallmeier et al., 1969) and the
structurally related carbon-based fullerenes (e.g. Kroto et al., 1985). Clathrates in this thesis
will refer to the H2O-bonded (or D2O-bonded) cage structure with a variety of guest
molecules.
Ice is a remarkably complicated material that has fourteen currently known solid
phases, including three amorphous phases (Figure 1). Virtually all ice in the biosphere is ice
Ih (Space group P63/mmc) because it is stable at ambient temperatures down to 73 K and
exists at ambient pressures up to 0.2 GPa (or 29 Pa, Figure 1). Since all clathrate structures
consist of approximately 85% water on a molecular basis, many of the clathrate mechanical
properties resemble those of a hexagonal ice- ice Ih (Sloan, 1998a). Ice Ih is a quartz-like
layer structure, a tridymite lattice with a relatively loose packing, in which three-quarters of
the bonds are in a central-symmetrical arrangement and one-quarter is in a mirror-
18
symmetrical arrangement, and symmetrical cavities are formed between them. Each cavity is
surrounded by six water molecules at a distance of 2.94 Å from the center. Around each
water molecule there are six cavities at a distance of 3.47 Å that form uninterrupted channels.
In water, four valence electrons form two “lone-pair” orbitals; the hydrogen bond is caused
by the attraction of the positive pole on one molecule to a negative pole on the neighboring
water molecule (Sloan, 1998a). In ice and in hydrates, only one hydrogen (or proton) lies
between two oxygen atoms with a distance between oxygen nuclei of 2.76 Å. When polar or
slightly polar gas molecules come into contact with water near the freezing point of water, a
clathrate forms. This physical enclosing process, accompanied only by weak interactions,
take place between the host and guest constituents when the guest enters the cavities in the
host lattice. The guests are released from the cavities only when the host lattice breaks down
(Berecz and Balla-Achs, 1983). In principle, any gas molecule that is small enough to fit in
the cavity of the water lattice can form a gas hydrate.
The most common naturally occurring gas hydrate is methane hydrate, which forms
in permafrost, ocean floor sediment, as well as in the outer solar system (comets, Mars,
satellites of the gas giant planets). Clathrates in oceanic deposits have a great potential as an
energy resource for the future; some scientists have estimated that the global reserve of
methane in hydrate form contains more than twice the energy of all natural gas, petroleum,
and coal deposits combined (Figure 2) (Kvenvolden, 2000; Sloan, 1998a). In a fully
saturated structure I clathrate, 1 molecule of methane is present for every 5.75 molecules of
19
water. In principle, 1 m3 of methane hydrate can contain up to 164 m3 of methane gas at
standard pressure and temperature (Kvenvolden, 2000).
Figure 1. The phase diagram of ice showing phases I – XI. Amorphous phases and Ice XII
are not shown. />
Clathrates in oceanic deposits exist in rather delicate equilibrium conditions, and
certain perturbations, such as depressurization and/or warming, can cause decomposition into
methane gas and water. This reaction has significant implications for clathrate exploitation
because methane released to the atmosphere due to destabilization of ocean-floor hydrates
could exacerbate greenhouse effects and potentially contribute to global warming.
20
Clathrate hydrates exhibit three main crystal structures, denoted I, II and H. A
structure III has been reported, but it is a filled-ice structure, not a clathrate structure, and
will not be discussed here.
Figure 2. Global distribution of gas hydrates from:
/>1.1.1 Structure I
Structure I gas hydrates consist of 512 cages and 51262 cages that form a cubic Pm 3 n,
body-centered cell (a = 12 Å) with an ideal unit cell formula of 6X 2Y 46H2O (X and Y
refer to large 51262 cage and the 512, respectively).
Two spherical pentagonal-dodecahedral cavities (512 cage) are each surrounded by 20
water molecules at a distance of 4.2 Å from the center of the cavity (Berecz and Balla-Achs,
1983). The 14-sided cavity (tetrakaidecahedron) is called 51262 because it has 12 pentagonal
21
and two hexagonal faces (Figure 3). In the event of total occupation of the cavities, the
formula of the resulting gas hydrate is X 5.75 H2O (where X denotes the hydrate-forming
molecule). If the gas molecule is too large to be incorporated into the small cavity, only the
large cavities are occupied. The ideal composition would then be X 7.67 H2O.
There are three crystallographically nonequivalent oxygen atoms in the hydrate cage,
and six crystallographically nonequivalent deuterium or hydrogen atoms. In the 512 cage,
there is only 1.5o departure of the O-O-O angles from the tetrahedral angles of ice Ih and
only 3.5o departure from the free-water angle (Sloan, 1998a). There are twenty water
molecules on the surface of the cage with thirty bonds; ten water molecules have hydrogen
atoms pointing away from the cavity as potential points of attachment to other molecules or
cavities (Sloan, 1998a).
The 51262 cavity is the most non-spherical cavity in sI or sII. There are four
crystallographically different types of oxygen sites at 4.25 Å, 4.47 Å, 4.06 Å, and 4.64 Å
from the center of the cage, making the cage an oblate ellipsoid. This cavity also has the
largest O-O-O angle variation (5.1o) from the tetrahedral angle preferred by water (Sloan,
1998a).
22
A
a
B
b
c
a
Figure 3a. 512 small cage (pink) and 51262 cage (blue) in the structure I clathrate structure; 3b.
Ball and stick diagram of the oxygen (blue) and hydrogen (grey) of the structure I 512 cage
(left) and 51262 cage (right) with the axes labeled.
1.1.2 Structure II
The unit cell consists of 136 water molecules- 16 pentagonal-dodecahedral (512) and 8
hexakaidecahedral cavities (51264) to form a cubic diamond lattice Fd 3 m (a = ~17.3 Å)
(Berecz and Balla-Achs, 1983) (Figure 4). In this hydrate type, the composition of the
resulting hydrate when the small cages are occupied is X 5.66 H2O, or, if only the large
cavities are filled, the composition is X 17 H2O.
23
The 512 cage in the structure II clathrate is similar to the 512 cage in structure I; only
in structure I the average cage radius is 3.95 Å, and structure II is 3.91 Å, which plays a
slight role in certain gas molecules fitting in these small cages. The 51264 cavity can contain
molecules as large as 6.6 Å.
A
c
a
B
Figure 4a. 512 small cage (pink) and 51264 cage (green) in the structure II clathrate structure;
4b. Ball and stick diagram of the oxygen (blue) and hydrogen (grey) of the structure II cages.
24
1.1.3 Structure H
The structure H hydrates (Figure 5) form a hexagonal structure, P6/mmm with a =
12.3 Å and c = 10.17 Å (approximately) which can only have a small occupant (such as
methane, nitrogen, or carbon dioxide) in the small cage and a large occupant for the large
cage (up to 9 Å, e.g. ethylcyclohexane). There are three pentagonal-dodecahedral cavities
(512), two medium irregular dodecahedron cavities (435663) that have three-square faces and
three hexagonal faces, in addition to six pentagonal faces. The largest (51268) cavity has
twelve pentagonal faces, as well as a band of six hexagonal faces and a hexagonal face at the
cavity top and bottom (Sloan, 1998).
Figure 5. 512 small cage (pink), the 435663 medium cage (purple) and the 51268 large cage
(yellow).
1.2 Filling the hydrate cages
At ambient pressures the three main hydrate structures can generally only contain, at
most one guest molecule (except for some noble gases and hydrogen etc). Molecules smaller
than 3.5 Å are too small to stabilize any cavity, while above 7.5 Å are too large to fit into any
cavity in sI or sII (Sloan, 1998a). Some molecules can only stabilize the large cavity of a
structure, but if the molecule stabilizes the small cavities of the structure (in other words, is
25
physically small), it can also enter the large cavity of the structure (Sloan, 1998a) (Figure 6).
Of the more than 130 compounds that form clathrate hydrates with water molecules, all form
either a structure I (sI), structure II (sII), or structure H (sH), with very few exceptions
(Sloan, 1998a).
Figure 6. Comparison of guest molecule sizes and cavities occupied as simple hydrates
(Sloan, 1998a).