Statistical methods for signal processing
Bạn đang xem bản rút gọn của tài liệu. Xem và tải ngay bản đầy đủ của tài liệu tại đây (3.12 MB, 354 trang )
STATISTICAL METHODS FOR SIGNAL PROCESSING
Alfred O. Hero
August 25, 2008
This set of notes is the primary source material for the course EECS564 “Estimation, filtering and
detection” used over the period 1999-2007 at the University of Michigan Ann Arbor. The author
can be reached at
Dept. EECS, University of Michigan, Ann Arbor, MI 48109-2122
Tel: 734-763-0564.
email ;
/>
1
STATISTICAL METHODS FOR SIGNAL PROCESSING c Alfred Hero 1999
Contents
1
INTRODUCTION
1.1
STATISTICAL SIGNAL PROCESSING . . . . . . . . . . . . . . . . . . . . . . .
9
1.2
PERSPECTIVE ADOPTED IN THIS BOOK . . . . . . . . . . . . . . . . . . .
9
1.2.1
2
9
PREREQUISITES . . . . . . . . . . . . . . . . . . . . . . . . . . . . . . .
NOTATION, MATRIX ALGEBRA, SIGNALS AND SYSTEMS
11
12
2.1
NOTATION . . . . . . . . . . . . . . . . . . . . . . . . . . . . . . . . . . . . . .
12
2.2
VECTOR AND MATRIX BACKGROUND . . . . . . . . . . . . . . . . . . . . .
12
2.3
2.4
2.5
2.2.1
ROW AND COLUMN VECTORS . . . . . . . . . . . . . . . . . . . . . .
12
2.2.2
VECTOR/VECTOR MULTIPLICATION . . . . . . . . . . . . . . . . .
13
ORTHOGONAL VECTORS . . . . . . . . . . . . . . . . . . . . . . . . . . . . .
13
2.3.1
VECTOR/MATRIX MULTIPLICATION . . . . . . . . . . . . . . . . . .
14
2.3.2
THE LINEAR SPAN OF A SET OF VECTORS . . . . . . . . . . . . . .
14
2.3.3
RANK OF A MATRIX . . . . . . . . . . . . . . . . . . . . . . . . . . . .
14
2.3.4
MATRIX INVERSION . . . . . . . . . . . . . . . . . . . . . . . . . . . .
14
2.3.5
ORTHOGONAL AND UNITARY MATRICES . . . . . . . . . . . . . . .
15
2.3.6
GRAMM-SCHMIDT ORTHOGONALIZATION AND ORTHONORMALIZATION . . . . . . . . . . . . . . . . . . . . . . . . . . . . . . . . . . . . .
15
2.3.7
EIGENVALUES OF A SYMMETRIC MATRIX . . . . . . . . . . . . . .
16
2.3.8
MATRIX DIAGONALIZATION AND EIGENDECOMPOSITION . . . .
16
2.3.9
QUADRATIC FORMS AND NON-NEGATIVE DEFINITE MATRICES
17
POSITIVE DEFINITENESS OF SYMMETRIC PARTITIONED MATRICES .
17
2.4.1
DETERMINANT OF A MATRIX . . . . . . . . . . . . . . . . . . . . . .
18
2.4.2
TRACE OF A MATRIX . . . . . . . . . . . . . . . . . . . . . . . . . . .
18
2.4.3
VECTOR DIFFERENTIATION . . . . . . . . . . . . . . . . . . . . . . .
18
SIGNALS AND SYSTEMS BACKGROUND . . . . . . . . . . . . . . . . . . . .
19
2.5.1
GEOMETRIC SERIES . . . . . . . . . . . . . . . . . . . . . . . . . . . .
19
2.5.2
LAPLACE AND FOURIER TRANSFORMS OF FUNCTIONS OF A
CONTINUOUS VARIABLE . . . . . . . . . . . . . . . . . . . . . . . . . .
19
2.5.3
Z-TRANSFORM AND DISCRETE-TIME FOURIER TRANSFORM (DTFT) 19
2.5.4
CONVOLUTION: CONTINUOUS TIME . . . . . . . . . . . . . . . . . .
20
2.5.5
CONVOLUTION: DISCRETE TIME . . . . . . . . . . . . . . . . . . . .
20
2.5.6
CORRELATION: DISCRETE TIME . . . . . . . . . . . . . . . . . . . .
21
2.5.7
RELATION BETWEEN CORRELATION AND CONVOLUTION . . .
21
2.5.8
CONVOLUTION AS A MATRIX OPERATION . . . . . . . . . . . . . .
21
2.6
BACKGROUND REFERENCES . . . . . . . . . . . . . . . . . . . . . . . . . . .
21
2.7
EXERCISES . . . . . . . . . . . . . . . . . . . . . . . . . . . . . . . . . . . . . . .
22
2
STATISTICAL METHODS FOR SIGNAL PROCESSING c Alfred Hero 1999
3
STATISTICAL MODELS
3.1
4
24
THE GAUSSIAN DISTRIBUTION AND ITS RELATIVES . . . . . . . . . . . .
24
3.1.1
MULTIVARIATE GAUSSIAN DISTRIBUTION . . . . . . . . . . . . . .
26
3.1.2
CENTRAL LIMIT THEOREM . . . . . . . . . . . . . . . . . . . . . . .
27
3.1.3
CHI-SQUARE . . . . . . . . . . . . . . . . . . . . . . . . . . . . . . . . .
28
3.1.4
GAMMA . . . . . . . . . . . . . . . . . . . . . . . . . . . . . . . . . . . .
29
3.1.5
NON-CENTRAL CHI SQUARE . . . . . . . . . . . . . . . . . . . . . . .
29
3.1.6
CHI-SQUARE MIXTURE . . . . . . . . . . . . . . . . . . . . . . . . . .
30
3.1.7
STUDENT-T . . . . . . . . . . . . . . . . . . . . . . . . . . . . . . . . . .
30
3.1.8
FISHER-F . . . . . . . . . . . . . . . . . . . . . . . . . . . . . . . . . . .
30
3.1.9
CAUCHY . . . . . . . . . . . . . . . . . . . . . . . . . . . . . . . . . . . .
31
3.1.10
BETA . . . . . . . . . . . . . . . . . . . . . . . . . . . . . . . . . . . . . .
31
3.2
REPRODUCING DISTRIBUTIONS . . . . . . . . . . . . . . . . . . . . . . . . .
31
3.3
FISHER-COCHRAN THEOREM . . . . . . . . . . . . . . . . . . . . . . . . . .
32
3.4
SAMPLE MEAN AND SAMPLE VARIANCE . . . . . . . . . . . . . . . . . . .
32
3.5
SUFFICIENT STATISTICS . . . . . . . . . . . . . . . . . . . . . . . . . . . . .
34
3.5.1
SUFFICIENT STATISTICS AND THE REDUCTION RATIO . . . . . .
35
3.5.2
DEFINITION OF SUFFICIENCY . . . . . . . . . . . . . . . . . . . . . .
36
3.5.3
MINIMAL SUFFICIENCY . . . . . . . . . . . . . . . . . . . . . . . . . .
38
3.5.4
EXPONENTIAL FAMILY OF DISTRIBUTIONS . . . . . . . . . . . . .
41
3.5.5
CHECKING IF A DENSITY IS IN THE EXPONENTIAL FAMILY
. .
43
3.6
BACKGROUND REFERENCES . . . . . . . . . . . . . . . . . . . . . . . . . . .
43
3.7
EXERCISES . . . . . . . . . . . . . . . . . . . . . . . . . . . . . . . . . . . . . . .
43
FUNDAMENTALS OF PARAMETRIC ESTIMATION
46
4.1
ESTIMATION: MAIN INGREDIENTS . . . . . . . . . . . . . . . . . . . . . . .
46
4.2
ESTIMATION OF RANDOM SCALAR PARAMETERS . . . . . . . . . . . . .
47
4.3
4.4
4.2.1
MINIMUM MEAN SQUARED ERROR ESTIMATION . . . . . . . . . .
48
4.2.2
MINIMUM MEAN ABSOLUTE ERROR ESTIMATOR . . . . . . . . .
50
4.2.3
MINIMUM MEAN UNIFORM ERROR ESTIMATION . . . . . . . . . .
51
4.2.4
BAYES ESTIMATOR EXAMPLES . . . . . . . . . . . . . . . . . . . . .
53
ESTIMATION OF RANDOM VECTOR VALUED PARAMETERS . . . . . . .
63
4.3.1
VECTOR SQUARED ERROR . . . . . . . . . . . . . . . . . . . . . . . .
64
4.3.2
VECTOR UNIFORM ERROR . . . . . . . . . . . . . . . . . . . . . . . .
64
ESTIMATION OF NON-RANDOM PARAMETERS . . . . . . . . . . . . . . .
67
4.4.1
SCALAR ESTIMATION CRITERIA FOR NON-RANDOM PARAMETERS . . . . . . . . . . . . . . . . . . . . . . . . . . . . . . . . . . . . . . .
67
3
STATISTICAL METHODS FOR SIGNAL PROCESSING c Alfred Hero 1999
4.4.2
METHOD OF MOMENTS (MOM) SCALAR ESTIMATORS . . . . . .
4.4.3
MAXIMUM LIKELIHOOD (ML) SCALAR ESTIMATORS . . . . . . . 74
`
SCALAR CRAMER-RAO
BOUND (CRB) ON ESTIMATOR VARIANCE 77
4.4.4
4.5
5
70
ESTIMATION OF MULTIPLE NON-RANDOM PARAMETERS . . . . . . . .
`
4.5.1
MATRIX CRAMER-RAO
BOUND (CRB) ON COVARIANCE MATRIX
85
4.5.2
METHODS OF MOMENTS (MOM) VECTOR ESTIMATION . . . . .
88
4.5.3
MAXIMUM LIKELIHOOD (ML) VECTOR ESTIMATION . . . . . . .
89
4.6
HANDLING NUISANCE PARAMETERS . . . . . . . . . . . . . . . . . . . . .
93
4.7
BACKGROUND REFERENCES . . . . . . . . . . . . . . . . . . . . . . . . . . .
95
4.8
EXERCISES . . . . . . . . . . . . . . . . . . . . . . . . . . . . . . . . . . . . . . .
95
LINEAR ESTIMATION
5.1
84
105
MIN MSE CONSTANT, LINEAR, AND AFFINE ESTIMATION . . . . . . . . 105
5.1.1
BEST CONSTANT ESTIMATOR OF A SCALAR RANDOM PARAMETER . . . . . . . . . . . . . . . . . . . . . . . . . . . . . . . . . . . . . . . 106
5.2
BEST LINEAR ESTIMATOR OF A SCALAR RANDOM PARAMETER . . . 106
5.3
BEST AFFINE ESTIMATOR OF A SCALAR R.V. θ . . . . . . . . . . . . . . . 107
5.3.1
5.4
5.5
SUPERPOSITION PROPERTY OF LINEAR/AFFINE ESTIMATORS
109
GEOMETRIC INTERPRETATION: ORTHOGONALITY CONDITION AND
PROJECTION THEOREM . . . . . . . . . . . . . . . . . . . . . . . . . . . . . . . 109
5.4.1
LINEAR MINIMUM MSE ESTIMATION REVISITED . . . . . . . . . . 109
5.4.2
AFFINE MINIMUM MSE ESTIMATION . . . . . . . . . . . . . . . . . 111
5.4.3
OPTIMALITY OF AFFINE ESTIMATOR FOR LINEAR GAUSSIAN
MODEL . . . . . . . . . . . . . . . . . . . . . . . . . . . . . . . . . . . . . . 111
BEST AFFINE ESTIMATION OF A VECTOR . . . . . . . . . . . . . . . . . . 112
5.5.1
LINEAR ESTIMATION EXAMPLES . . . . . . . . . . . . . . . . . . . . 113
5.6
NONSTATISTICAL LEAST SQUARES (LINEAR REGRESSION) . . . . . . . 115
5.7
LINEAR MINIMUM WEIGHTED LEAST SQUARES ESTIMATION . . . . . . 122
5.7.1
PROJECTION OPERATOR FORM OF LMWLS PREDICTOR . . . . . 122
5.8
OPTIMALITY OF LMWMS IN THE GAUSSIAN MODEL . . . . . . . . . . . 125
5.9
BACKGROUND REFERENCES . . . . . . . . . . . . . . . . . . . . . . . . . . . 127
5.10
APPENDIX: VECTOR SPACES . . . . . . . . . . . . . . . . . . . . . . . . . . . 127
5.11 EXERCISES . . . . . . . . . . . . . . . . . . . . . . . . . . . . . . . . . . . . . . . 131
4
STATISTICAL METHODS FOR SIGNAL PROCESSING c Alfred Hero 1999
6
OPTIMAL LINEAR FILTERING AND PREDICTION
136
6.1
WIENER-HOPF EQUATIONS OF OPTIMAL FILTERING . . . . . . . . . . . 136
6.2
NON-CAUSAL ESTIMATION . . . . . . . . . . . . . . . . . . . . . . . . . . . . 138
6.3
CAUSAL ESTIMATION . . . . . . . . . . . . . . . . . . . . . . . . . . . . . . . 139
6.3.1
SPECIAL CASE OF WHITE NOISE MEASUREMENTS . . . . . . . . 140
6.3.2
GENERAL CASE OF NON-WHITE MEASUREMENTS . . . . . . . . . 141
6.4
CAUSAL PREWHITENING VIA SPECTRAL FACTORIZATION . . . . . . . 142
6.5
CAUSAL WIENER FILTERING . . . . . . . . . . . . . . . . . . . . . . . . . . . 144
6.6
CAUSAL FINITE MEMORY TIME VARYING ESTIMATION . . . . . . . . . 149
6.7
6.8
6.6.1
SPECIAL CASE OF UNCORRELATED MEASUREMENTS . . . . . . 149
6.6.2
CORRELATED MEASUREMENTS: THE INNOVATIONS FILTER . . 150
6.6.3
INNOVATIONS AND CHOLESKY DECOMPOSITION . . . . . . . . . 151
TIME VARYING ESTIMATION/PREDICTION VIA THE KALMAN FILTER
153
6.7.1
DYNAMICAL MODEL . . . . . . . . . . . . . . . . . . . . . . . . . . . . 153
6.7.2
KALMAN FILTER: ALGORITHM DEFINITION . . . . . . . . . . . . . 154
6.7.3
KALMAN FILTER: DERIVATIONS . . . . . . . . . . . . . . . . . . . . 155
KALMAN FILTERING: SPECIAL CASES . . . . . . . . . . . . . . . . . . . . . 161
6.8.1
KALMAN PREDICTION . . . . . . . . . . . . . . . . . . . . . . . . . . 161
6.8.2
KALMAN FILTERING . . . . . . . . . . . . . . . . . . . . . . . . . . . . 162
6.9
KALMAN FILTER FOR SPECIAL CASE OF GAUSSIAN STATE AND NOISE 162
6.10
STEADY STATE KALMAN FILTER AND WIENER FILTER . . . . . . . . . 162
6.11
SUMMARY OF STATISTICAL PROPERTIES OF THE INNOVATIONS
6.12
BACKGROUND REFERENCES . . . . . . . . . . . . . . . . . . . . . . . . . . . 164
6.13
APPENDIX: POWER SPECTRAL DENSITIES . . . . . . . . . . . . . . . . . . 165
. . . 164
6.13.1
ACF AND CCF . . . . . . . . . . . . . . . . . . . . . . . . . . . . . . . . 165
6.13.2
REAL VALUED WIDE SENSE STATIONARY SEQUENCES . . . . . . 165
6.13.3
Z-DOMAIN PSD AND CPSD . . . . . . . . . . . . . . . . . . . . . . . . 166
6.14 EXERCISES . . . . . . . . . . . . . . . . . . . . . . . . . . . . . . . . . . . . . . . 167
7
FUNDAMENTALS OF DETECTION
7.1
7.2
176
THE GENERAL DETECTION PROBLEM . . . . . . . . . . . . . . . . . . . . 181
7.1.1
SIMPLE VS COMPOSITE HYPOTHESES . . . . . . . . . . . . . . . . . 182
7.1.2
THE DECISION FUNCTION . . . . . . . . . . . . . . . . . . . . . . . . 182
BAYES APPROACH TO DETECTION . . . . . . . . . . . . . . . . . . . . . . 183
7.2.1
ASSIGNING PRIOR PROBABILITIES . . . . . . . . . . . . . . . . . . . 184
7.2.2
MINIMIZATION OF AVERAGE RISK . . . . . . . . . . . . . . . . . . . 184
7.2.3
OPTIMAL BAYES TEST MINIMIZES E[C] . . . . . . . . . . . . . . . . 185
5
STATISTICAL METHODS FOR SIGNAL PROCESSING c Alfred Hero 1999
7.3
7.4
7.2.4
MINIMUM PROBABILITY OF ERROR TEST . . . . . . . . . . . . . . 186
7.2.5
PERFORMANCE OF BAYES LIKELIHOOD RATIO TEST . . . . . . . 186
7.2.6
MIN-MAX BAYES DETECTOR . . . . . . . . . . . . . . . . . . . . . . 187
7.2.7
EXAMPLES . . . . . . . . . . . . . . . . . . . . . . . . . . . . . . . . . . 188
TESTING MULTIPLE HYPOTHESES . . . . . . . . . . . . . . . . . . . . . . . 191
7.3.1
PRIOR PROBABILITIES . . . . . . . . . . . . . . . . . . . . . . . . . . 193
7.3.2
MINIMIZE AVERAGE RISK . . . . . . . . . . . . . . . . . . . . . . . . 193
7.3.3
DEFICIENCIES OF BAYES APPROACH . . . . . . . . . . . . . . . . . 196
FREQUENTIST APPROACH TO DETECTION . . . . . . . . . . . . . . . . . 196
7.4.1
8
CASE OF SIMPLE HYPOTHESES: θ ∈ {θ0 , θ1 } . . . . . . . . . . . . . . 197
7.5
ROC CURVES FOR THRESHOLD TESTS . . . . . . . . . . . . . . . . . . . . 201
7.6
BACKGROUND AND REFERENCES . . . . . . . . . . . . . . . . . . . . . . . 211
7.7
EXERCISES . . . . . . . . . . . . . . . . . . . . . . . . . . . . . . . . . . . . . . . 211
DETECTION STRATEGIES FOR COMPOSITE HYPOTHESES
215
8.1
UNIFORMLY MOST POWERFUL (UMP) TESTS . . . . . . . . . . . . . . . . 215
8.2
GENERAL CONDITION FOR UMP TESTS: MONOTONE LIKELIHOOD RATIO . . . . . . . . . . . . . . . . . . . . . . . . . . . . . . . . . . . . . . . . . . . . 230
8.3
COMPOSITE HYPOTHESIS DETECTION STRATEGIES . . . . . . . . . . . 231
8.4
MINIMAX TESTS . . . . . . . . . . . . . . . . . . . . . . . . . . . . . . . . . . . 231
8.5
LOCALLY MOST POWERFUL (LMP) SINGLE SIDED TEST . . . . . . . . . 234
8.6
MOST POWERFUL UNBIASED (MPU) TESTS . . . . . . . . . . . . . . . . . 241
8.7
LOCALLY MOST POWERFUL UNBIASED DOUBLE SIDED TEST . . . . . 241
8.8
CFAR DETECTION . . . . . . . . . . . . . . . . . . . . . . . . . . . . . . . . . 247
8.9
INVARIANT TESTS . . . . . . . . . . . . . . . . . . . . . . . . . . . . . . . . . 247
8.10
GENERALIZED LIKELIHOOD RATIO TEST . . . . . . . . . . . . . . . . . . . 248
8.10.1
8.11
PROPERTIES OF GLRT . . . . . . . . . . . . . . . . . . . . . . . . . . . 248
BACKGROUND REFERENCES . . . . . . . . . . . . . . . . . . . . . . . . . . . 249
8.12 EXERCISES . . . . . . . . . . . . . . . . . . . . . . . . . . . . . . . . . . . . . . . 249
9
COMPOSITE HYPOTHESES IN THE UNIVARIATE GAUSSIAN MODEL256
9.1
TESTS ON THE MEAN: σ 2 KNOWN . . . . . . . . . . . . . . . . . . . . . . . 256
9.1.1
9.2
CASE III: H0 : μ = μo , H1 : μ = μo . . . . . . . . . . . . . . . . . . . . . 256
TESTS ON THE MEAN: σ 2 UNKNOWN
σ2
. . . . . . . . . . . . . . . . . . . . . 258
> 0, H1 : μ > μo , σ 2 > 0 . . . . . . . . . . . . . 258
9.2.1
CASE I: H0 : μ = μo ,
9.2.2
CASE II: H0 : μ ≤ μo , σ 2 > 0, H1 : μ > μo , σ 2 > 0 . . . . . . . . . . . . . 260
9.2.3
CASE III: H0 : μ = μo , σ 2 > 0, H1 : μ = μo , σ 2 > 0 . . . . . . . . . . . . 261
6
STATISTICAL METHODS FOR SIGNAL PROCESSING c Alfred Hero 1999
9.3
TESTS ON VARIANCE: KNOWN MEAN . . . . . . . . . . . . . . . . . . . . . 261
9.3.1
CASE I: H0 : σ 2 = σo2 , H1 : σ 2 > σo2 . . . . . . . . . . . . . . . . . . . . . 261
9.3.2
CASE II: H0 : σ 2 ≤ σo2 , H1 : σ 2 > σo2
9.3.3
9.4
9.6
9.7
10
=
σo2 ,
H1 :
σ2
=
σo2
. . . . . . . . . . . . . . . . . . . . 263
. . . . . . . . . . . . . . . . . . . . 265
TESTS ON VARIANCE: UNKNOWN MEAN . . . . . . . . . . . . . . . . . . . 266
9.4.1
CASE I: H0 : σ 2 = σo2 , H1 : σ 2 > σo2 . . . . . . . . . . . . . . . . . . . . . 267
9.4.2
CASE II: H0 : σ 2 < σo2 , μ ∈ IR, H1 : σ 2 > σo2 , μ ∈ IR
9.4.3
9.5
CASE III: H0 :
σ2
CASE III: H0 :
σ2
=
σo2 ,
μ ∈ IR, H1 :
σ2
=
σo2
. . . . . . . . . . . 267
μ ∈ IR . . . . . . . . . . . . 268
TESTS ON EQUALITY OF MEANS: UNKNOWN COMMON VARIANCE . . 268
9.5.1
CASE I: H0 : μx = μy , σ 2 > 0, H1 : μx = μy , σ 2 > 0 . . . . . . . . . . . . 268
9.5.2
CASE II: H0 : μy ≤ μx , σ 2 > 0, H1 : μy > μx , σ 2 > 0 . . . . . . . . . . . 270
TESTS ON EQUALITY OF VARIANCES . . . . . . . . . . . . . . . . . . . . . 271
9.6.1
CASE I: H0 : σx2 = σy2 , H1 : σx2 = σy2 . . . . . . . . . . . . . . . . . . . . . 271
9.6.2
CASE II: H0 : σx2 = σy2 , H1 : σy2 > σx2 . . . . . . . . . . . . . . . . . . . . . 272
TESTS ON CORRELATION . . . . . . . . . . . . . . . . . . . . . . . . . . . . . 273
9.7.1
CASE I: H0 : ρ = ρo , H1 : ρ = ρo . . . . . . . . . . . . . . . . . . . . . . . 274
9.7.2
CASE II: H0 : ρ = 0, H1 : ρ > 0 . . . . . . . . . . . . . . . . . . . . . . . 275
9.8
BACKGROUND REFERENCES . . . . . . . . . . . . . . . . . . . . . . . . . . . 275
9.9
EXERCISES . . . . . . . . . . . . . . . . . . . . . . . . . . . . . . . . . . . . . . . 276
STATISTICAL CONFIDENCE INTERVALS
277
10.1
DEFINITION OF A CONFIDENCE INTERVAL . . . . . . . . . . . . . . . . . 277
10.2
CONFIDENCE ON MEAN: KNOWN VAR . . . . . . . . . . . . . . . . . . . . . 278
10.3
CONFIDENCE ON MEAN: UNKNOWN VAR . . . . . . . . . . . . . . . . . . . 282
10.4
CONFIDENCE ON VARIANCE . . . . . . . . . . . . . . . . . . . . . . . . . . . 283
10.5
CONFIDENCE ON DIFFERENCE OF TWO MEANS . . . . . . . . . . . . . . 284
10.6
CONFIDENCE ON RATIO OF TWO VARIANCES . . . . . . . . . . . . . . . . 284
10.7
CONFIDENCE ON CORRELATION COEFFICIENT . . . . . . . . . . . . . . 285
10.8
BACKGROUND REFERENCES . . . . . . . . . . . . . . . . . . . . . . . . . . . 287
10.9 EXERCISES . . . . . . . . . . . . . . . . . . . . . . . . . . . . . . . . . . . . . . . 287
11
SIGNAL DETECTION IN THE MULTIVARIATE GAUSSIAN MODEL
11.1
11.2
OFFLINE METHODS
289
. . . . . . . . . . . . . . . . . . . . . . . . . . . . . . . . 289
11.1.1
GENERAL CHARACTERIZATION OF LRT DECISION REGIONS . . 291
11.1.2
CASE OF EQUAL COVARIANCES
11.1.3
CASE OF EQUAL MEANS, UNEQUAL COVARIANCES . . . . . . . . 310
. . . . . . . . . . . . . . . . . . . . 294
APPLICATION: DETECTION OF RANDOM SIGNALS . . . . . . . . . . . . . 314
7
STATISTICAL METHODS FOR SIGNAL PROCESSING c Alfred Hero 1999
11.3
DETECTION OF NON-ZERO MEAN NON-STATIONARY SIGNAL IN WHITE
NOISE . . . . . . . . . . . . . . . . . . . . . . . . . . . . . . . . . . . . . . . . . . . 323
11.4
ONLINE IMPLEMENTATIONS OF OPTIMAL DETECTORS . . . . . . . . . 324
11.4.1
ONLINE DETECTION FOR NON-STATIONARY SIGNALS . . . . . . 325
11.4.2
ONLINE DUAL KALMAN SIGNAL SELECTOR . . . . . . . . . . . . . 326
11.4.3
ONLINE SIGNAL DETECTOR VIA CHOLESKY . . . . . . . . . . . . 329
11.5
STEADY-STATE STATE-SPACE SIGNAL DETECTOR . . . . . . . . . . . . . 331
11.6
BACKGROUND REFERENCES . . . . . . . . . . . . . . . . . . . . . . . . . . . 333
11.7 EXERCISES . . . . . . . . . . . . . . . . . . . . . . . . . . . . . . . . . . . . . . . 333
12
COMPOSITE HYPOTHESES IN THE MULTIVARIATE GAUSSIAN MODEL337
12.1
MULTIVARIATE GAUSSIAN MATRICES . . . . . . . . . . . . . . . . . . . . . 338
12.2
DOUBLE SIDED TEST OF VECTOR MEAN . . . . . . . . . . . . . . . . . . . 338
12.3
TEST OF EQUALITY OF TWO MEAN VECTORS . . . . . . . . . . . . . . . 342
12.4
TEST OF INDEPENDENCE . . . . . . . . . . . . . . . . . . . . . . . . . . . . . 343
12.5
TEST OF WHITENESS . . . . . . . . . . . . . . . . . . . . . . . . . . . . . . . 344
12.6
CONFIDENCE REGIONS ON VECTOR MEAN . . . . . . . . . . . . . . . . . 345
12.7
EXAMPLES . . . . . . . . . . . . . . . . . . . . . . . . . . . . . . . . . . . . . . 347
12.8
BACKGROUND REFERENCES . . . . . . . . . . . . . . . . . . . . . . . . . . . 349
12.9 EXERCISES . . . . . . . . . . . . . . . . . . . . . . . . . . . . . . . . . . . . . . . 350
13
BIBLIOGRAPHY
351
8
STATISTICAL METHODS FOR SIGNAL PROCESSING c Alfred Hero 1999
1
1.1
INTRODUCTION
STATISTICAL SIGNAL PROCESSING
Many engineering applications require extraction of a signal or parameter of interest from degraded measurements. To accomplish this it is often useful to deploy fine-grained statistical
models; diverse sensors which acquire extra spatial, temporal, or polarization information; or
multi-dimensional signal representations, e.g. time-frequency or time-scale. When applied in combination these approaches can be used to develop highly sensitive signal estimation, detection, or
tracking algorithms which can exploit small but persistent differences between signals, interferences, and noise. Conversely, these approaches can be used to develop algorithms to identify a
channel or system producing a signal in additive noise and interference, even when the channel
input is unknown but has known statistical properties.
Broadly stated, statistical signal processing is concerned with the reliable estimation, detection
and classification of signals which are subject to random fluctuations. Statistical signal processing
has its roots in probability theory, mathematical statistics and, more recently, systems theory
and statistical communications theory. The practice of statistical signal processing involves: (1)
description of a mathematical and statistical model for measured data, including models for sensor, signal, and noise; (2) careful statistical analysis of the fundamental limitations of the data
including deriving benchmarks on performance, e.g. the Cram`er-Rao, Ziv-Zakai, Barankin, Rate
Distortion, Chernov, or other lower bounds on average estimator/detector error; (3) development
of mathematically optimal or suboptimal estimation/detection algorithms; (4) asymptotic analysis
of error performance establishing that the proposed algorithm comes close to reaching a benchmark
derived in (2); (5) simulations or experiments which compare algorithm performance to the lower
bound and to other competing algorithms. Depending on the specific application, the algorithm
may also have to be adaptive to changing signal and noise environments. This requires incorporating flexible statistical models, implementing low-complexity real-time estimation and filtering
algorithms, and on-line performance monitoring.
1.2
PERSPECTIVE ADOPTED IN THIS BOOK
This book is at the interface between mathematical statistics and signal processing. The idea
for the book arose in 1986 when I was preparing notes for the engineering course on detection,
estimation and filtering at the University of Michigan. There were then no textbooks available
which provided a firm background on relevant aspects of mathematical statistics and multivariate
analysis. These fields of statistics formed the backbone of this engineering field in the 1940’s
50’s and 60’s when statistical communication theory was first being developed. However, more
recent textbooks have downplayed the important role of statistics in signal processing in order to
accommodate coverage of technological issues of implementation and data acquisition for specific
engineering applications such as radar, sonar, and communications. The result is that students
finishing the course would have a good notion of how to solve focussed problems in these applications but would find it difficult either to extend the theory to a moderately different problem
or to apply the considerable power and generality of mathematical statistics to other applications
areas.
The technological viewpoint currently in vogue is certainly a useful one; it provides an essential
engineering backdrop to the subject which helps motivate the engineering students. However, the
disadvantage is that such a viewpoint can produce a disjointed presentation of the component
9
STATISTICAL METHODS FOR SIGNAL PROCESSING c Alfred Hero 1999
parts of statistical signal processing making it difficult to appreciate the commonalities between
detection, classification, estimation, filtering, pattern recognition, confidence intervals and other
useful tools. These commonalities are difficult to appreciate without adopting a proper statistical
perspective. This book strives to provide this perspective by more thoroughly covering elements of
mathematical statistics than other statistical signal processing textbooks. In particular we cover
point estimation, interval estimation, hypothesis testing, time series, and multivariate analysis.
In adopting a strong statistical perspective the book provides a unique viewpoint on the subject
which permits unification of many areas of statistical signal processing which are otherwise difficult
to treat in a single textbook.
The book is organized into chapters listed in the attached table of contents. After a quick review
of matrix algebra, systems theory, and probability, the book opens with chapters on fundamentals
of mathematical statistics, point estimation, hypothesis testing, and interval estimation in the
standard context of independent identically distributed observations. Specific topics in these
chapters include: least squares techniques; likelihood ratio tests of hypotheses; e.g. testing for
whiteness, independence, in single and multi-channel populations of measurements. These chapters
provide the conceptual backbone for the rest of the book. Each subtopic is introduced with a set
of one or two examples for illustration. Many of the topics here can be found in other graduate
textbooks on the subject, e.g. those by Van Trees, Kay, and Srinath etal. However, the coverage
here is broader with more depth and mathematical detail which is necessary for the sequel of the
textbook. For example in the section on hypothesis testing and interval estimation the full theory
of sampling distributions is used to derive the form and null distribution of the standard statistical
tests of shift in mean, variance and correlation in a Normal sample.
The second part of the text extends the theory in the previous chapters to non i.i.d. sampled
Gaussian waveforms. This group contains applications of detection and estimation theory to single and multiple channels. As before, special emphasis is placed on the sampling distributions of
the decision statistics. This group starts with offline methods; least squares and Wiener filtering;
and culminates in a compact introduction of on-line Kalman filtering methods. A feature not found
in other treatments is the separation principle of detection and estimation which is made explicit
via Kalman and Wiener filter implementations of the generalized likelihood ratio test for model
selection, reducing to a whiteness test of each the innovations produced by a bank of Kalman
filters. The book then turns to a set of concrete applications areas arising in radar, communications, acoustic and radar signal processing, imaging, and other areas of signal processing. Topics
include: testing for independence; parametric and non-parametric testing of a sample distribution;
extensions to complex valued and continuous time observations; optimal coherent and incoherent
receivers for digital and analog communications;
A future revision will contain chapters on performance analysis, including asymptotic analysis
and upper/lower bounds on estimators and detector performance; non-parametric and semiparametric methods of estimation; iterative implementation of estimators and detectors (Monte Carlo
Markov Chain simulation and the EM algorithm); classification, clustering, and sequential design of experiments. It may also have chapters on applications areas including: testing of binary
Markov sequences and applications to internet traffic monitoring; spatio-temporal signal processing with multi-sensor sensor arrays; CFAR (constant false alarm rate) detection strategies for
Electro-optical (EO) and Synthetic Aperture Radar (SAR) imaging; and channel equalization.
10
STATISTICAL METHODS FOR SIGNAL PROCESSING c Alfred Hero 1999
1.2.1
PREREQUISITES
Readers are expected to possess a background in basic probability and random processes at the
level of Stark&Woods [68], Ross [59] or Papoulis [54], exposure to undergraduate vector and matrix
algebra at the level of Noble and Daniel [52] or Shilov [64] , and basic undergraduate course on
signals and systems at the level of Oppenheim and Willsky [53]. These notes have evolved as
they have been used to teach a first year graduate level course (42 hours) in the Department of
Electrical Engineering and Computer Science at the University of Michigan from 1997 to 2008 and
a one week short course (40 hours) given at EG&G in Las Vegas in 1998.
The author would like to thank Hyung Soo Kim, Robby Gupta, and Mustafa Demirci for their help
with drafting the figures for these notes. He would also like to thank the numerous students at UM
whose comments led to an improvement of the presentation. Special thanks goes to Clayton Scott
of the University of Michigan, Raviv Raich of Oregon State University and Aaron Lanterman of
Georgia Tech who provided detailed comments and suggestions for improvement of earlier versions
of these notes. End of chapter
11
STATISTICAL METHODS FOR SIGNAL PROCESSING c Alfred Hero 1999
2
NOTATION, MATRIX ALGEBRA, SIGNALS AND SYSTEMS
Keywords: vector and matrix operations, matrix inverse identities, linear systems, transforms,
convolution, correlation.
Before launching into statistical signal processing we need to set the stage by defining our notation.
We then briefly review some elementary concepts in linear algebra and signals and systems. At
the end of the chapter you will find some useful references for this review material.
2.1
NOTATION
We attempt to stick with widespread notational conventions in this text. However inevitably
exceptions must sometimes be made for clarity.
In general upper case letters, e.g. X, Y, Z, from the end of the alphabet denote random variables,
i.e. functions on a sample space, and their lower case versions, e.g. x, denote realizations, i.e.
evaluations of these functions at a sample point, of these random variables. We reserve lower case
letters from the beginning of the alphabet, e.g. a, b, c, for constants and lower case letters in the
middle of the alphabet, e.g. i, j, k, l, m, n, for integer variables. Script and caligraphic characters,
e.g. S, I, Θ, and X , are used to denote sets of values. Exceptions are caligraphic upper case
letters which denote standard probability distributions, e.g. Gaussian, Cauchy, and Student-t
distributions N (x), C(v), T (t), respectively, and script notation for power spectral density P x .
Vector valued quantities, e.g. x, X, are denoted with an underscore and matrices, e.g. A, are
bold upper case letters from the beginning of the alphabet. An exception is the matrix R which
we use for the covariance matrix of a random vector. The elements of an m × n matrix A are
m,n
denoted generically {aij }m,n
i,j=1 and we also write A = (aij )i,j=1 when we need to spell out the
entries explicitly.
The letter f is reserved for a probability density function and p is reserved for a probability mass
function. Finally in many cases we deal with functions of two or more variables, e.g. the density
function f (x; θ) of a random variable X parameterized by a parameter θ. We use subscripts to
emphasize that we are fixing one of the variables, e.g. fθ (x) denotes the density function over
x in a sample space X ⊂ IR for a fixed θ in a parameter space Θ. However, when dealing with
multivariate densities for clarity we will prefer to explicitly subscript with the appropriate ordering
of the random variables, e.g. fX,Y (x, y; θ) or fX|Y (x|y; θ).
2.2
2.2.1
VECTOR AND MATRIX BACKGROUND
ROW AND COLUMN VECTORS
A vector is an ordered list of n values:
⎡
⎤
x1
⎢
⎥
x = ⎣ ... ⎦
xn
which resides in Rn .
Convention: in this course x is (almost) always a column vector. Its transpose is the row vector
12
STATISTICAL METHODS FOR SIGNAL PROCESSING c Alfred Hero 1999
xT =
x1 · · · xn
When the elements xi = u + jv are complex (u, v real valued, j =
is defined as
xH =
√
−1) the Hermitian transpose
x∗1 · · · x∗n
where x∗i = u − jv is the complex conjugate of xi .
Some common vectors we will see are the vector of all ones and the j-th elementary vector, which
is the j-th column of the identity matrix:
1 = [1, . . . , 1]T ,
ej = [0, . . . , 0, 1 , 0, . . . 0]T
j−th
2.2.2
VECTOR/VECTOR MULTIPLICATION
For 2 vectors x and y with the same number n of entries, their “inner product” is the scalar
n
xT y =
xi yi
i=1
The 2-norm x 2 of a vector x is its length and it is defined as (we drop the norm subscript when
there is no risk of confusion)
n
xT x
x =
x2i .
=
i=1
For 2 vectors x and y of possibly different lengths n, m their “outer product” is the n × m matrix
xy T
= (xi yj )n,m
i,j=1
= [xy1 , . . . , xym ]
⎤
x1 y1 · · · x1 ym
⎢
.. ⎥
..
= ⎣ ...
.
. ⎦
xn y1 · · · xn ym
⎡
2.3
ORTHOGONAL VECTORS
If xT y = 0 then x and y are said to be orthogonal. If in addition the lengths of x and y are equal
to one, x = 1 and y = 1, then x and y are said to be orthonormal vectors.
13
STATISTICAL METHODS FOR SIGNAL PROCESSING c Alfred Hero 1999
2.3.1
VECTOR/MATRIX MULTIPLICATION
Let A be an m × n matrix with columns a∗1 , . . . , a∗n and x be any n-element vector.
The (compatible) product Ax is a (column) vector composed of linear combinations of the columns
of A
n
Ax =
xj a∗j
j=1
For y an m-element vector the product y T A is a (row) vector composed of linear combinations of
the rows of A
m
T
y A=
yi ai∗ .
i=1
2.3.2
THE LINEAR SPAN OF A SET OF VECTORS
Let x1 , . . . , xn be a set of p dimensional (column) vectors and construct the p × n matrix
X = [x1 , . . . , xn ].
Let a = [a1 , . . . , an ]T be a vector of coefficients. Then y = ni=1 ai xi = Xa is another p dimensional
vector that is a linear combination of the columns of X. The linear span of the vectors x1 , . . . , xn ,
equivalently, the column space or range of X, is defined as the subspace of IRp that contains all
such linear combinations:
span{x1 , . . . , xn } = {y : y = Xa, a ∈ IRn }.
In other words, when we allow a to sweep over its entire domain IRn , y sweeps over the linear span
of x1 , . . . , xn .
2.3.3
RANK OF A MATRIX
The (column) rank of a matrix A is equal to the number its columns which are linearly independent.
The dimension of the column space of a rank p matrix A is equal to p.
If A has full rank then
xi a∗i ⇔ x = 0.
0 = Ax =
i
If in addition A is square then it is said to be non-singular.
2.3.4
MATRIX INVERSION
If A is non-singular square matrix then it has an inverse A−1 which satisfies the relation AA−1 = I.
In the special case of a 2 × 2 matrix the matrix inverse is given by (Cram`er’s formula)
a b
c d
−1
=
1
ad − bc
d −b
−c a
if
ad = bc
14
STATISTICAL METHODS FOR SIGNAL PROCESSING c Alfred Hero 1999
Sometimes when a matrix has special structure its inverse has a simple form. The books by Graybill
[21] and Golub and VanLoan [19] give many interesting and useful examples. Some results which
we will need in this text are: the Sherman-Morrison-Woodbury identity
[A + UVT ]−1 = A−1 − A−1 U[I + VT A−1 U]−1 VT A−1 ,
(1)
where A, U, V are compatible matrices, [A + UVT ]−1 and A−1 exist; and the partitioned matrix
inverse identity
A11 A12
A21 A22
−1
=
−1
[A11 − A12 A−1
22 A21 ]
−1
−1
−A22 A21 [A11 − A12 A22 A21 ]−1
−1
−1
−A−1
11 A12 [A22 − A21 A11 A12 ]
−1
−1
[A22 − A21 A11 A12 ]
, (2)
assuming that all the indicated inverses exist.
2.3.5
ORTHOGONAL AND UNITARY MATRICES
A real square matrix A is said to be orthogonal if all of its columns are orthonormal, i.e.,
AT A = I.
(3)
The generalization of orthogonality to complex matrices A is the property of being unitary,
AH A = I.
The relation (3) implies that if A is an orthogonal matrix it is invertible and has a very simple
inverse
A−1 = AT .
2.3.6
GRAMM-SCHMIDT ORTHOGONALIZATION AND ORTHONORMALIZATION
Let x1 , . . . , xn be a set of n linearly independent p dimensional column vectors (n ≤ p) whose
linear span is the subspace H. Gramm-Schmidt orthogonalization is an algorithm that can be
applied to this set of vectors to obtain a set of n orthogonal vectors y 1 , . . . , y n that spans the same
subspace. This algorithm proceeds as follows.
Step 1: select y 1 as an arbitrary starting point in H. For example, choose any coefficient vector
a1 = [a11 , . . . , a1n ]T and define y 1 = Xa1 where X = [x1 , . . . , xn ].
Step 2: construct the other n − 1 vectors y 2 , . . . , y n by the following recursive procedure:
For j = 2, . . . , n:
y j = xj −
j
i=1 Ki y i−1
where Kj = xTj y j−1 /y Tj−1 y j−1 .
The above Gramm-Schmidt procedure can be expressed in compact matrix form [60]
Y = HX,
where Y = [y 1 , . . . , y n ] and H is called the Gramm-Schmidt matrix.
If after each step j = 1, . . . , n of the procedure one maps normalizes the length of y j , i.e., y j ←
y˜j = y j / y j , the algorithm produces an orthonormal set of vectors. This is called Gram-Schmidt
15
STATISTICAL METHODS FOR SIGNAL PROCESSING c Alfred Hero 1999
˜ with orthonormal columns and identical column
orthonormalization and produces an matrix Y
span as that of X. The Gramm-Schmidt orthonormalization procedure is often used to generate
an orthonormal basis y 1 , . . . , y p ] for IRp starting from an arbitrarily selected initial vector y 1 . The
matrix formed from such a basis will have the structure
⎤
⎡
y1
⎢ v ⎥
⎢ 2 ⎥
Y=⎢ . ⎥
⎣ .. ⎦
vn
and
Y T Y = I.
In the above v 2 , . . . , v n are orthonormal vectors that are said to accomplish completion of the basis
with respect to the initial vector y 1 .
2.3.7
EIGENVALUES OF A SYMMETRIC MATRIX
If R is arbitrary n×n symmetric matrix, that is, RT = R, then there exist a set of n orthonormal
eigenvectors ν i ,
1, i = j
ν Ti ν j = Δij =
0, i = j
and a set of associated eigenvectors λi such that:
Rν i = λi ν i ,
i = 1, . . . , n.
These eigenvalues and eigenvectors satisfy:
ν Ti Rν i = λi
ν Ti Rν j
2.3.8
= 0, i = j.
MATRIX DIAGONALIZATION AND EIGENDECOMPOSITION
Let U = [ν 1 , . . . , ν n ] be the n × n matrix formed from the eigenvectors of a symmetric matrix R.
If R is real symmetric U is a real orthogonal matrix while if R is complex Hermitian symmetric
U is a complex unitary matrix:
UT U = I,
(U an orthogonal matrix)
H
U U = I,
(U a unitary matrix).
where as before H denotes Hermitian transpose. As the Hermitian transpose of a real matrix is
equal to its ordinary transpose, we will use the more general notation AH for any (real or complex)
matrix A.
The matrix U can be used to diagonalize R
UH RU = Λ,
(4)
16
STATISTICAL METHODS FOR SIGNAL PROCESSING c Alfred Hero 1999
17
In cases of both real and Hermitian symmetric R the
⎡
λ1
⎢ ..
Λ = diag(λi ) = ⎣ .
matrix Λ is diagonal and real valued
⎤
... 0
. ⎥
..
. .. ⎦ ,
0 . . . λn
where λi ’s are the eigenvalues of R.
The expression (4) implies that
R = UΛUH ,
which is called the eigendecomposition of R. As Λ is diagonal, an equivalent summation form for
this eigendecomposition is
n
λi ν i ν H
i .
R =
(5)
i=1
2.3.9
QUADRATIC FORMS AND NON-NEGATIVE DEFINITE MATRICES
For a square symmetric matrix R and a compatible vector x, a quadratic form is the scalar defined
by xT Rx. The matrix R is non-negative definite (nnd) if for any x
xT Rx ≥ 0.
(6)
R is positive definite (pd) if it is nnd and ”=” in (6) implies that x = 0, or more explicitly R is
pd if
xT Rx > 0, x = 0.
(7)
Examples of nnd (pd) matrices:
* R = BT B for arbitrary (pd) matrix B
* R symmetric with only non-negative (positive) eigenvalues
Rayleigh Theorem: If A is a nnd n × n matrix with eigenvalues {λi }ni=1 the quadratic form
min(λi ) ≤
uT Au
≤ max(λi )
uT u
where the lower bound is attained when u is the eigenvector of A associated with the minimum
eigenvalue of A and the upper bound is attained by the eigenvector associated with the maximum
eigenvalue of A.
2.4
POSITIVE DEFINITENESS OF SYMMETRIC PARTITIONED MATRICES
If A is a symmetric matrix with partition representation (2) then it is easily shown that
A=
A11 A12
A21 A22
=
I −A12 A−1
22
O
I
−1
T
A11 − A12 A−1
22 A21 O
O
A22
I
−A−1
22 A21
OT
I
−1
, (8)
as long as A−1
22 exists. Here O denotes a block of zeros. This implies: if A is positive definite the
matrices A11 − A12 A−1
22 A21 and A22 are pd. By using an analogous identity we can conclude that
A
and
A11 are also pd.
A22 − A21 A−1
12
11
STATISTICAL METHODS FOR SIGNAL PROCESSING c Alfred Hero 1999
2.4.1
DETERMINANT OF A MATRIX
If A is any square matrix its determinant is
|A| =
λi
i
Note: a square matrix is non-singular iff its determinint is non-zero.
−1
If A is partitioned as in (2) and A−1
11 and A22 exist then
−1
|A| = |A11 ||A22 − A21 A−1
11 A12 | = |A22 ||A11 − A12 A22 A21 |
(9)
This follows from the decomposition (8).
2.4.2
TRACE OF A MATRIX
For any square matrix A = ((aij )) the trace of A is defined as
aii =
trace{A} =
i
λi
i
One has an important identity: for compatible matrices A and B
trace{AB} = trace{BA}.
This has the following implication for quadratic forms:
xT Rx = trace{xxT R}.
2.4.3
VECTOR DIFFERENTIATION
Differentiation of functions of a vector variable often arise in signal processing and estimation
theory. If h = [h1 , . . . , hn ]T is an n × 1 vector and g(h) is a scalar function then the gradient of
g(h), denoted ∇g(h) or ∇h g(h) when necessary for conciseness, is defined as the (column) vector
of partials
∂g T
∂g
,...,
.
∇g =
∂h1
∂hn
In particular, if c is a constant
∇h c = 0,
if x = [x1 , . . . , xn ]T
∇h (hT x) = ∇h (xT h) = x,
and if B is an n × n matrix
∇h (h − x)T B(h − x) = 2B(h − x).
For a vector valued function g(h) = [g1 (h), . . . , gm (h)]T the gradient of g(h) is an m × n matrix.
In particular, for a scalar function g(h), the two applications of the gradient ∇(∇g)T gives the
n × n Hessian matrix of g, denoted as ∇2 g. This yields useful and natural identities such as:
∇2h (h − x)T B(h − x) = 2B.
For a more detailed discussion of vector differentiation the reader is referred to Kay [36].
18
STATISTICAL METHODS FOR SIGNAL PROCESSING c Alfred Hero 1999
2.5
SIGNALS AND SYSTEMS BACKGROUND
Here we review some of the principal results that will be useful for dealing with signals and systems
encountered in this book.
2.5.1
GEOMETRIC SERIES
One of the most useful formulas in discrete time signal and systems engineering is:
n
an =
i=0
1 − an+1
,
1−a
∞
an =
if a = 1;
i=0
1
,
1−a
if |a| < 1.
2.5.2
LAPLACE AND FOURIER TRANSFORMS OF FUNCTIONS OF A CONTINUOUS VARIABLE
If h(t), −∞ < t < ∞, a square integrable function of a continuous variable t (usually time) then
its Laplace and Fourier transforms are defined as follows.
The Laplace transform of h is
L{h} = H(s) =
∞
h(t)e−st dt
−∞
where s = σ + jω ∈ Cl is a complex variable.
The Fourier transform of h is
F{h} = H(ω) =
∞
h(t)e−jωt dt
−∞
Note: F{h} = L{h}|s=jω .
Example: if h(t) = e−at u(t), for a > 0, then the Laplace transform is
∞
e
H(s) =
0
2.5.3
−at −st
e
∞
dt =
−(a+s)t
e
0
−1 −(a+st)
e
dt =
a+s
∞
=
0
1
a+s
Z-TRANSFORM AND DISCRETE-TIME FOURIER TRANSFORM (DTFT)
If hk , k = . . . , −1, 0, 1, . . ., is a square summable function of a discrete variable then its Z-transform
and discrete-time Fourier transform (DTFT) are defined as follows.
The Z-transform is
∞
hk z −k
Z{h} = H(z) =
k=−∞
The DTFT is
∞
F{h} = H(ω) =
hk e−jωk
k=−∞
Note: H(ω) really means H(ejω ) and is an abuse of notation
19
STATISTICAL METHODS FOR SIGNAL PROCESSING c Alfred Hero 1999
• F{h} = Z{h}|z=ejω
• the DTFT is always periodic in ω with period 2π.
Example: if hk = a|k| , then for |az −1 | < 1 and |az| < 1, the Z-transform is
∞
H(z) =
k=−∞
∞
∞
(az) +
k=1
∞
a−k z −k +
k=−∞
k
=
−1
a|k| z −k =
(az −1 )k =
k=0
ak z −k
k=0
1
az
+
1 − az 1 − az −1
Likewise the DTFT is (for |a| < 1):
H(ω) = H(z)|z=ejω =
2.5.4
1 − a2
1 − 2a cos ω + a2
CONVOLUTION: CONTINUOUS TIME
If h(t) and x(t) are square integrable functions of a continuous variable t then the convolution of
x and h is defined as
∞
h(t − τ )x(τ ) dτ
(h ∗ x)(t) =
−∞
Note: The convolution of h and x is a waveform indexed by time t. (h ∗ x)(t) is this waveform
evaluated at time t and is frequently denoted h(t) ∗ x(t).
Example: h(t) = e−at u(t), for a > 0, (the filter) and x(t) = e−bt u(t), for b > 0, (the filter input)
then
(h ∗ x)(t) =
t
−at
−∞
e−a(t−τ ) e−bτ dτ
u(t)
0
dτ
−at
u(t) = e
0
2.5.5
t
e−a(t−τ ) e−bτ u(t − τ )u(τ ) dτ =
−(b−a)τ
e
=e
∞
−1 −(b−a)τ
e
b−a
t
u(t) =
0
CONVOLUTION: DISCRETE TIME
If hk and xk are square integrable sequences then
∞
hn ∗ xn =
∞
hj xn−j =
j=−∞
hn−j xj
j=−∞
hk is a called a “causal” filter if it is zero for negative indices:
hk = 0,
k<0
e−at − e−bt
u(t)
b−a
20
STATISTICAL METHODS FOR SIGNAL PROCESSING c Alfred Hero 1999
2.5.6
CORRELATION: DISCRETE TIME
For time sequences {xk }nk=1 and {yk }nk=1 their temporal correlation is
n
zn =
xk yk∗
j=1
2.5.7
RELATION BETWEEN CORRELATION AND CONVOLUTION
n
zn =
j=1
xk hn−k = hn xn
j=−∞
where
hk =
2.5.8
∞
xk yk∗ =
∗
, k = 1, . . . , n
yn−k
0,
o.w.
CONVOLUTION AS A MATRIX OPERATION
Let hk be a causal filter and let xk be an input starting at time k = 1. Arranging n outputs zk in
a vector z it is easy to see that
⎡
⎤
⎡
zn
⎢
⎥
⎢
z = ⎣ ... ⎦ = ⎣
z1
⎡
⎢
⎢
= ⎢
⎢
⎣
n
j=1 hn−j xj
⎥
..
⎦
.
n
j=1 h1−j xj
h0
0
..
.
0
2.6
⎤
⎤
· · · hn−1
⎤
⎡
xn
⎥
..
. hn−2 ⎥
h0
. ⎥
⎥ ⎢
⎥ ⎣ .. ⎦
..
. h0
h1 ⎦
x1
··· 0
h0
h1
BACKGROUND REFERENCES
There are many useful textbooks that cover areas of this chapter. I learned elementary linear
algebra from Noble and Daniel [52]. A more advanced book that is focused on computational linear
algebra is Golub and Van Loan [19] which covers many fast and numerically stable algorithms
arising in signal processing. Another nice book on linear algebra with emphasis on statistical
applications is Graybill [21] that contains lots of useful identities for multivariate Gaussian models.
For background on signals and systems Oppenheim and Willsky [53] and Proakis and Manolakis
[56] are good elementary textbooks. The encyclopedic book by Moon and Stirling [49] is a good
general resource for mathematical methods in signal processing.
21
STATISTICAL METHODS FOR SIGNAL PROCESSING c Alfred Hero 1999
2.7
EXERCISES
2.1 Let a, b be n × 1 vectors and let C be an invertible n × n matrix. Assuming α is not equal
to −1/(aT C−1 b) show the following identity
[C + αabT ]−1 = C−1 − C−1 abT C−1 α/(1 + αaT C−1 b).
2.2 A discrete time LTI filter h(k) is causal when h(k) = 0, k < 0 and anticausal when h(k) =
−k
0, k > 0. Show that if |h(k)| < ∞ for all k, the transfer function H(z) = ∞
k=−∞ h(k)z
of a causal LTI has no singularities outside the unit circle, i.e. |H(z)| < ∞, |z| > 1 while
an anticausal LTI has no singularities inside the unit circle, i.e. |H(z)| < ∞, |z| < 1. (Hint:
generalized triangle inequality | i ai | ≤ |ai |)
2.3 A discrete time LTI filter h(k) is said to be BIBO stable when ∞
k=−∞ |h(k)| < ∞. Define
−k , for z a complex variable.
h(k)z
the transfer function (Z-transform) H(z) = ∞
k=−∞
(a) Show that H(z) has no singularities on the unit circle, i.e |H(z)| < ∞, |z| = 1.
(b) Show that if a BIBO stable h(k) is causal then H(z) has all its singularities (poles)
strictly inside the unit circle, i.e |H(z)| < ∞, |z| ≥ 1.
(c) Show that if a BIBO stable h(k) is anticausal, i.e. h(k) = 0, k > 0, then H(z) has all its
singularities (poles) strictly outside the unit circle, i.e |H(z)| < ∞, |z| ≤ 1.
2.4 If you are only given the mathematical form of the transfer function H(z) of an LTI, and not
told whether it corresponds to an LTI which is causal, anticausal, or stable, then it is not
possible to uniquely specify the impulse response {hk }k . This simple example illustration this
fact. The regions {z : |z| > a} and {z : |z| ≤ a}, specified in (a) and (b) are called the regions
of convergence of the filter and specify whether the filter is stable, causal or anticausal.
Let H(z) be
1
H(z) =
1 − az −1
(a) Show that if the LTI is causal, then for |z| > |a| you can write H(z) as the convergent
series
∞
H(z) =
ak z −k ,
|z| > |a|
k=0
which corresponds to hk = ak , k = 0, 1, . . . and hk = 0, k < 0.
(b) Show that if the LTI is anticausal, then for |z| < |a| you can write H(z) as the convergent
series
∞
H(z) = −
a−k z k+1 ,
|z| < |a|
k=0
which corresponds to hk = −a−k , k = 1, 2 . . . and hk = 0, k ≥ 0.
(c) Show that if |a| < 1 then the causal LTI is BIBO stable while the anti-causal LTI is
BIBO unstable while if |a| > 1 then the reverse is true. What happens to stability when
|a| = 1?
2.5 An LTI has transfer function
H(z) =
3 − 4z −1
1 − 3.5z −1 + 1.5z −2
22
STATISTICAL METHODS FOR SIGNAL PROCESSING c Alfred Hero 1999
(a) If you are told that the LTI is stable specify the region of convergence (ROC) in
z-plane, i.e. specify the range of values of |z| for which |H(z)| < ∞, and specify
impulse response.
(b) If you are told that the LTI is causal specify the region of convergence (ROC) in
z-plane, and specify the impulse response.
(c) If you are told that the LTI is anticausal specify the region of convergence (ROC) in
z-plane, and specify the impulse response.
End of chapter
the
the
the
the
23
STATISTICAL METHODS FOR SIGNAL PROCESSING c Alfred Hero 1999
3
STATISTICAL MODELS
Keywords: sampling distributions, sufficient statistics, exponential families.
Estimation, detection and classification can be grouped under the broad heading of statistical
inference which is the process of inferring properties about the distribution of a random variable
X given a realization x, which is also called a data sample, a measurement, or an observation. A
key concept is that of the statistical model which is simply a hypothesized probability distribution
or density function f (x) for X. Broadly stated statistical inference explores the possibility of
fitting a given model to the data x. To simplify this task it is common to restrict f (x) to a class of
parameteric models {f (x; θ)}θ∈Θ , where f (x; •) is a known function and θ is a vector of unknown
parameters taking values in a parameter space Θ. In this special case statistical inference boils
down to inferring properties of the true value of θ parameterizing f (x; θ) that generated the data
sample x.
In this chapter we discuss several models that are related to the ubiquitous Gaussian distribution,
the more general class of exponential families of distributions, and the important concept of a
sufficient statistic for infering properties about θ.
3.1
THE GAUSSIAN DISTRIBUTION AND ITS RELATIVES
The Gaussian distribution and its close relatives play a major role in parameteric statistical inference due to the relative simplicity of the Gaussian model and its broad applicability (recall the
Central Limit Theorem!). Indeed, in engineering and science the Gaussian distribution is probably
the most commonly invoked distribution for random measurements. The Gaussian distribution is
also called the Normal distribution. The probability density function (pdf) of a Gaussian random
variable (rv) X is parameterized by two parameters, θ1 and θ2 , which are the location parameter,
denoted μ (μ ∈ IR), and the (squared) scale parameter, denoted σ 2 (σ 2 > 0). The pdf of this
Gaussian rv has the form
(x−μ)2
1
e− 2σ2 , −∞ < x < ∞
f (x; μ, σ 2 ) = √
2πσ
When μ = 0 and σ 2 = 1, X is said to be a standard Gaussian (Normal) rv. A Gaussian random
variable with location parameter μ and scale parameter σ > 0 can be represented by
X = σZ + μ,
(10)
where Z is a standard Gaussian rv.
The cumulative density function (cdf) of a standard Gaussian random variable Z is denoted N (z)
and is defined in the conventional manner
N (z) = P (Z ≤ z).
Equivalently,
N (z) =
z
−∞
v2
1
√ e− 2 dv.
2π
Using (10) the cdf of a non-standard Gaussian rv X with parameters μ and σ 2 can be expressed
in terms of the cdf N (z) of a standard Gaussian rv Z:
P (X ≤ x) = P ((X − μ)/σ ≤ (x − μ)/σ) = N
Z
x−μ
σ
24
STATISTICAL METHODS FOR SIGNAL PROCESSING c Alfred Hero 1999
The standard Normal cdf N (x) can be related to the error function or error integral [1]: erf(u) =
u −t2
√2
e dt, x ≥ 0, through the relation
π 0
√
[1 + erf(|x|/√ 2)] x ≥ 0
.
1 [1 − erf(|x|/
2)], x < 0
2
1
2
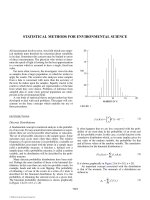
N (x) =
For positive integer order ν, the moments of a standard Gaussian random variable Z are [30, 13.3]
E[Z ν ] =
(ν − 1)(ν − 3) · · · 3 · 1, ν even
0,
ν odd
∞
where E[g(Z)] = −∞ g(z)f (z)dz denotes statistical expectation of the rv g(Z) under the pdf
f (z) for rv Z. These moment relations can easily be derived by looking at the coefficients of
(ju)k /k!, k = 1, 2, . . . in the power series expansion about ju = 0 of the characteristic function
2
ΦZ (u) = E[ejuZ ] = e−u /2 .
In particular, using (10), this implies that the first and second moments of a non-standard Gaussian
rv X are E[X] = μ and E[X 2 ] = μ2 + σ 2 , respectively. Thus for a Gaussian rv X we can identify
the (ensemble) mean E[X] = μ and variance var(X) = E[(X − E[X])2 ] = E[X 2 ] − E 2 [X] = σ 2
as the location and (squared) scale parameters, respectively, of the pdf f (x; μ, σ 2 ) of X. In the
sequel we will need the following expression for the (non-central) mean deviation E[|X + a|] for
Gaussian X [31, 29.6]:
2 −a2 /2
e
+ a(1 − 2N (−a)).
π
E[|X + a|] =
(11)
In referring to rv’s and operations on rv’s in this book the following compact notations are sometimes used:
* “X is distributed as a Gaussian random variable with mean μ and variance σ 2 ”
X ∼ N (μ, σ 2 )
(12)
* “X is equal to a scaled and shifted standard Gaussian random variable”
X = a
+b ⇔ X ∼ N (b, a2 )
Z
N (0,1)
or, in shorthand notation,
X = a N (0, 1) + b ⇔ X ∼ N (b, a2 ).
(13)
For example, in the following shorthand notation X1 , . . . , Xn are independent identically distributed (iid) N (0, 1) rv’s
n
n
N (0, 1) =
i=1
Xi .
i=1
Note that the above is an abuse of notation since N (0, 1) is being used to denote both a Gaussian
probability distribution in (12) and a Gaussian random variable in (13). As in all abuses of this
25