Using neural networks and genetic algorithms to predict stock market returns
Bạn đang xem bản rút gọn của tài liệu. Xem và tải ngay bản đầy đủ của tài liệu tại đây (1.08 MB, 166 trang )
USING NEURAL NETWORKS AND GENETIC
ALGORITHMS TO PREDICT STOCK MARKET RETURNS
A THESIS SUBMITTED TO THE UNIVERSITY OF MANCHESTER
FOR THE DEGREE OF MASTER OF SCIENCE
IN ADVANCED COMPUTER SCIENCE
IN THE FACULTY OF SCIENCE AND ENGINEERING
By
Efstathios Kalyvas
Department Of Computer Science
October 2001
C ontents
Abstract
6
Declaration
7
Copyright and Ownership
8
Acknowledgments
9
1
Introduction
11
1.1
Aims and Objectives........................................................................................ 11
1.2
Rationale......................................................................................................... 12
1.3
Stock Market Prediction.................................................................................. 12
1.4
Organization of the Study................................................................................ 13
2
Stock Markets and Prediction
2.1
15
The Stock Market ............................................................................................ 15
2.1.1 Investment Theories..................................................................................... 15
2.1.2 Data Related to the Market.......................................................................... 16
2.2
Prediction of the Market.................................................................................. 17
2.2.1 Defining the prediction task......................................................................... 17
2.2.2 Is the Market predictable?........................................................................... 18
2.2.3 Prediction Methods ..................................................................................... 19
2.2.3.1
Technical Analysis............................................................................... 20
2.2.3.2
Fundamental Analysis ......................................................................... 20
2
2.3
2.2.3.3
Traditional Time Series Prediction ...................................................... 21
2.2.3.4
Machine Learning Methods ................................................................. 23
2.2.3.4.1
Nearest Neighbor Techniques ...................................................... 24
2.2.3.4.2
Neural Networks .......................................................................... 24
Defining The Framework Of Our Prediction Task ........................................... 35
2.3.1 Prediction of the Market on daily Basis....................................................... 35
2.3.2 Defining the Exact Prediction Task ............................................................. 37
2.3.3 Model Selection........................................................................................... 38
2.3.4 Data Selection............................................................................................. 39
3
Data
3.1
41
Data Understanding........................................................................................ 41
3.1.1 Initial Data Collection................................................................................. 41
3.1.2 Data Description......................................................................................... 42
3.1.3 Data Quality ............................................................................................... 43
3.2
Data Preparation ............................................................................................ 44
3.2.1 Data Construction....................................................................................... 44
3.2.2 Data Formation........................................................................................... 46
3.3
Testing For Randomness ................................................................................. 47
3.3.1 Randomness ................................................................................................ 47
3.3.2 Run Test ...................................................................................................... 48
3.3.3 BDS Test ..................................................................................................... 51
4
4.1
Models
55
Traditional Time Series Forecasting ............................................................... 55
3
4.1.1 Univariate and Multivariate linear regression............................................. 55
4.1.2 Use of Information Criteria to define the optimum lag structure.................. 57
4.1.3 Evaluation of the AR model ......................................................................... 58
4.1.4 Checking the residuals for non-linear patters .............................................. 60
4.1.5 Software ...................................................................................................... 61
4.2
Artificial Neural Networks .............................................................................. 61
4.2.1 Description ................................................................................................. 61
4.2.1.1
Neurons............................................................................................... 62
4.2.1.2
Layers ................................................................................................. 62
4.2.1.3
Weights Adjustment ............................................................................. 63
4.2.2 Parameters Setting ...................................................................................... 72
4.2.2.1
Neurons............................................................................................... 72
4.2.2.2
Layers ................................................................................................. 72
4.2.2.3
Weights Adjustment ............................................................................. 73
4.2.3 Genetic Algorithms...................................................................................... 74
4.2.3.1
Description.......................................................................................... 74
4.2.3.2
A Conventional Genetic Algorithm ...................................................... 74
4.2.3.3
A GA that Defines the NN’s Structure .................................................. 77
4.2.4 Evaluation of the NN model......................................................................... 81
4.2.5 Software ...................................................................................................... 81
5
Experiments and Results
5.1
82
Experiment I: Prediction Using Autoregressive Models................................... 82
5.1.1 Description ................................................................................................. 82
5.1.2 Application of Akaike and Bayesian Information Criteria............................ 83
4
5.1.3 AR Model Adjustment.................................................................................. 84
5.1.4 Evaluation of the AR models........................................................................ 84
5.1.5 Investigating for Non-linear Residuals ........................................................ 86
5.2
Experiment II: Prediction Using Neural Networks .......................................... 88
5.2.1 Description ................................................................................................. 88
5.2.2 Search Using the Genetic Algorithm............................................................ 90
5.2.2.1
FTSE ................................................................................................... 92
5.2.2.2
S&P................................................................................................... 104
5.2.3 Selection of the fittest Networks................................................................. 109
5.2.4 Evaluation of the fittest Networks .............................................................. 112
5.2.5 Discussion of the outcomes of Experiment II ............................................. 114
5.3
6
Conclusions .................................................................................................. 115
Conclusion
118
6.1
Summary of Results....................................................................................... 118
6.2
Conclusions .................................................................................................. 119
6.3
Future Work.................................................................................................. 120
6.3.1 Input Data................................................................................................. 120
6.3.2 Pattern Detection ...................................................................................... 121
6.3.3 Noise Reduction ........................................................................................ 121
Appendix I
122
Appendix II
140
References
163
5
A bstract
In this study we attempt to predict the daily excess returns of FTSE 500 and S&P 500
indices over the respective Treasury Bill rate returns. Initially, we prove that the excess
returns time series do not fluctuate randomly. Furthermore we apply two different types
of prediction models: Autoregressive (AR) and feed forward Neural Networks (NN) to
predict the excess returns time series using lagged values. For the NN models a Genetic
Algorithm is constructed in order to choose the optimum topology. Finally we evaluate
the prediction models on four different metrics and conclude that they do not manage to
outperform significantly the prediction abilities of naï ve predictors.
6
D eclaration
No portion of the work referred to in the thesis has been submitted in support of an
application for another degree or qualification of this or any other university or other
institute of learning.
7
C opyright and O wnership
Copyright in text of this thesis rests with the Author. Copies (by any process) either in
full, or of extracts, may be made only in accordance with instructions given by the
Author and lodged in the John Rylands University Library of Manchester. Details may
be obtained from the librarian. This page must form part of any such copies made.
Further copies (by any process) of copies made in accordance with such instructions
may not be made without permission (in writing) of the Author.
The ownership of any intellectual property rights which may be described in this thesis
is vested in the University of Manchester, subject to any prior agreement to the
contrary, and may not be made available for use by third parties without written
permission of the University, which will prescribe the terms and conditions of any such
agreement.
Further information on the conditions under which disclosures and exploitation may
take place is available from the Head of the Department of Computer Science.
8
A cknowledgments
I would like to express my thanks and appreciation to my supervisor, Professor David S.
Brée, for his valuable advice and guidance, and my gratitude to senior Lecturer Nathan
L. Joseph, for his continuous support and assistance. I would also like to thank Rahim
Lakka (Ph.D. Student) for his help and enlightening comments.
I need as well to thank Archimandrite Nikiforo Asprogeraka for his psychological and
financial support. Last but not least I would like to thank my University teachers
Panagioti Rodogiani and Leonida Palio for their help and advice at the initial stage of
my postgraduate studies.
Without the help of all these people none of the current work would have been feasible.
«... åéò ôïõò ãïíåßò ìïõ ùöåßëù ôï æåßí åéò ôïõò äÜóêáëïõò ìïõ ôï åõ æåßí.»
9
D edication
To my parents Petros and Maria, who believed in me and stood by my side all the way
and my sister Sophia and brother Vassilis, my most precious friends.
To Myrto, who made every single moment unique.
10
C hapter 1
I ntroduction
It is nowadays a common notion that vast amounts of capital are traded through the
Stock Markets all around the world. National economies are strongly linked and heavily
influenced of the performance of their Stock Markets. Moreover, recently the Markets
have become a more accessible investment tool, not only for strategic investors but for
common people as well. Consequently they are not only related to macroeconomic
parameters, but they influence everyday life in a more direct way. Therefore they
constitute a mechanism which has important and direct social impacts.
The characteristic that all Stock Markets have in common is the uncertainty, which is
related with their short and long-term future state. This feature is undesirable for the
investor but it is also unavoidable whenever the Stock Market is selected as the
investment tool. The best that one can do is to try to reduce this uncertainty. Stock
Market Prediction (or Forecasting) is one of the instruments in this process.
1.1
Aims and Objectives
The aim of this study is to attempt to predict the short-term term future of the Stock
Market. More specifically prediction of the returns provided by the Stock Market on
daily basis is attempted. The Stock Markets indices that are under consideration are the
FTSE 500 and the S&P 500 of the London and New York market respectively.
11
The first objective of the study is to examine the feasibility of the prediction task and
provide evidence that the markets are not fluctuating randomly. The second objective is,
by reviewing the literature, to apply the most suitable prediction models and measure
their efficiency.
1.2
Rationale
There are several motivations for trying to predict the Stock Market. The most basic of
these is the financial gain. Furthermore there is the challenge of proving whether the
markets are predictable or not. The predictability of the market is an issue that has been
much discussed by researchers and academics. In finance a hypothesis has been
formulated, known as the Efficient Market Hypothesis (EMH), which implies that there
is no way to make profit by predicting the market, but so far there has been no
consensus on the validity of EMH [1].
1.3
Stock Market Prediction
The Stock Market prediction task divides researchers and academics into two groups
those who believe that we can devise mechanisms to predict the market and those who
believe that the market is efficient and whenever new information comes up the market
absorbs it by correcting itself, thus there is no space for prediction (EMH). Furthermore
they believe that the Stock Market follows a Random Walk, which implies that the best
prediction you can have about tomorrow’s value is today’s value.
In literature a number of different methods have been applied in order to predict Stock
Market returns. These methods can be grouped in four major categories: i) Technical
Analysis Methods, ii) Fundamental Analysis Methods, iii) Traditional Time Series
Forecasting and iv) Machine Learning Methods. Technical analysts, known as chartists,
attempt to predict the market by tracing patterns that come from the study of charts
which describe historic data of the market. Fundamental analysts study the intrinsic
value of an stock and they invest on it if they estimate that its current value is lower that
its intrinsic value. In Traditional Time Series forecasting an attempt to create linear
prediction models to trace patterns in historic data takes place. These linear models are
divided in two categories: the univariate and the multivariate regression models,
depending on whether they use one of more variables to approximate the Stock Market
12
time series. Finally a number of methods have been developed under the common label
Machine Learning these methods use a set of samples and try to trace patterns in it
(linear or non-linear) in order to approximate the underlying function that generated the
data.
The level of success of these methods varies from study to study and it is depended on
the underlying datasets and the way that these methods are applied each time. However
none of them has been proven to be the consistent prediction tool that the investor
would like to have. In this study our attention is concentrated to the last two categories
of prediction methods.
1.4
Organization of the Study
The complementation of the aims and objectives of this study as described earlier takes
place throughout five chapters. Here we present a brief outline of the content of each
chapter:
In Chapter 2, initially an attempt to define formally the prediction task takes place. In
order to be able to predict the market we have to be certain that it is not fluctuating
randomly. We search the relevant literature to find out whether there are studies, which
prove that the Stock Market does not fluctuate randomly and in order to see which are
the methods that other studies have used so far to predict the market as well as their
level of success and we present our findings. In the last part of this chapter we select,
based on our literature review, the prediction models and the type of data we will use to
predict the market on daily basis.
Chapter 3 presents in detail the datasets we will use: the FTSE 500 and S&P 500. Firstly
it presents the initial data sets we obtained and covers issues such as: source, descriptive
statistics, quality, etc. Secondly it describes the way that we integrate these datasets in
order to construct the time series under prediction (excess returns time series). In the
last part of Chapter 3 two distinct randomness tests are presented and applied to the
excess returns time series. The tests are: a) the Run and b) the BDS test.
In Chapter 4, we present in detail the models we will apply in this study: the
autoregressive (AR) and the feed-forward neural network (NN) models. For each
13
category of model firstly, a description of how they function is given; then the
parameters that influence their performance are presented and analysed. Additionally
we attempt to set these parameters in such a way that the resulting models will perform
optimally in the frame of our study. To accomplish this, we use the Akaike Information
Criterion (AIC) and the Bayesian Information Criterion (BIC) to define the lag structure
of the AR models; for the NN models we choose a number of the parameters based on
findings of other studies and use a Genetic Algorithm (GA) to find the optimum
topology. Finally we evaluate these models using four different metrics. Three of these
are benchmarks that compare the prediction abilities of our models with naï ve
prediction models, while the last one is the mean absolute prediction error.
In Chapter 5, two major experiments are reported. These experiments use the models
described in the previous chapter. Experiment I applies AIC and BIC and determines
the optimum lags, for the AR models. These models are applied to predict the excess
returns time series and then their performance is evaluated on all four metrics.
Experiment II initially applies the GA to find the optimum topology for the NNs
models. Then it evaluates the performance of the resulted NN models on all four
different metrics. For the adjustment of the parameters of both categories of models, as
well as for their evaluation, the same data sets are used to enable a comparison to be
made.
Chapter 6, summarizes the findings of this study as well as the conclusions we have
drawn. Finally it presents some of our suggestions for future work on the field of Stock
Market prediction.
14
C hapter 2
S tock M arkets and P rediction
This chapter attempts to give a brief overview of some of the theories and concepts that
are linked to stock markets and their prediction. Issues such as investment theories,
identification of available data related to the market, predictability of the market,
prediction methodologies applied so far and their level of success are some of the topics
covered. All these issues are examined under the ‘daily basis prediction’ point of view
with the objective of incorporating in our study the most appropriate features.
2.1 The Stock Market
2.1.1
Investment Theories
An investment theory suggests what parameters one should take into account before
placing his (or her) capital on the market. Traditionally the investment community
accepts two major theories: the Firm Foundation and the Castles in the Air [1].
Reference to these theories allows us to understand how the market is shaped, or in
other words how the investors think and react. It is this sequence of ‘thought and
reaction’ by the investors that defines the capital allocation and thus the level of the
market.
There is no doubt that the majority of the people related to stock markets is trying to
achieve profit. Profit comes by investing in stocks that have a good future (short or long
term future). Thus what they are trying to accomplish one way or the other is to predict
15
the future of the market. But what determines this future? The way that people invest
their money is the answer; and people invest money based on the information they hold.
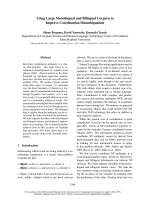
Therefore we have the following schema:
Information
Investor
Market Level
Figure 2.1: Investment procedure.
The factors that are under discussion on this schema are: the content of the
‘Information’ component and the way that the ‘Investor’ reacts when having this info.
According to the Firm Foundation theory the market is defined from the reaction of the
investors, which is triggered by information that is related with the ‘real value’ of firms.
The ‘real value’ or else the intrinsic value is determined by careful analysis of present
conditions and future prospects of a firm [1].
On the other hand, according to the Castles in the Air theory the investors are triggered
by information that is related to other investors’ behavior. So for this theory the only
concern that the investor should have is to buy today with the price of 20 and sell
tomorrow with the price of 30, no matter what the intrinsic value of the firm he (or she)
invests on is.
Therefore the Firm Foundation theory favors the view that the market is defined mostly
by logic, while the Castles in the Air theory supports that the market is defined mostly
by psychology.
2.1.2
Data Related to the Market
The information about the market comes from the study of relevant data. Here we are
trying to describe and group into categories the data that are related to the stock
markets. In the literature these data are divided in three major categories [2]:
•
Technical data: are all the data that are referred to stocks only. Technical data
include:
§
The price at the end of the day.
16
•
§
The highest and the lowest price of a trading day.
§
The volume of shares traded per day.
Fundamental data: are data related to the intrinsic value of a company or category
of companies as well as data related to the general economy. Fundamental data
include:
•
§
Inflation
§
Interest Rates
§
Trade Balance
§
Indexes of industries (e.g. heavy industry)
§
Prices of related commodities (e.g. oil, metals, currencies)
§
Net profit margin of a firm.
§
Prognoses of future profits of a firm
§
Etc.
Derived data: this type of data can be produced by transforming and combining
technical and/or fundamental data. Some commonly used examples are:
§
Returns: One-step returns R(t) is defined as the relative increase in price
since the previous point in a time series. Thus if y(t) is the value of a stock
on day t, R(t)=
§
y (t ) − y (t − 1)
.
y (t − 1)
Volatility: Describes the variability of a stock and is used as a way to
measure the risk of an investment.
The study (process) of these data permit us to understand the market and some of the
rules it follows. In our effort to predict the future of the market we have to study its past
and present and infer from them. It is this inference task that all prediction methods are
trying to accomplish. The way they do it and the different subsets of data they use is
what differentiates them.
2.2 Prediction of the Market
2.2.1
Defining the prediction task
Before having any further discussion about the prediction of the market we define the
task in a formal way.
17
“Given a sample of N examples {(xi, yi), i=1, …,N} where f(xi)= yi, ∀i,
return a function g that approximates f in the sense that the norm of the error
vector E=(e1,…,eN) is minimized. Each ei is defined as ei=e(g(xi), yi) where e
is an arbitrary error function”[2].
In other words the definition above indicates that in order to predict the market you
should search historic data and find relationships between these data and the value of
the market. Then try to exploit these relationships you have found on future situations.
This definition is based on the assumption that such relationships do exist. But do they?
Or do the markets fluctuate in a totally random way leaving us no space for prediction?
This is a question that has to be answered before any attempt for prediction is made.
2.2.2
Is the Market predictable?
The predictability of the market is an issue that has been discussed a lot by researchers
and academics. In finance a hypothesis has been formulated known as the Efficient
Market Hypothesis (EMH), which implies that there is no way to make profit by
predicting the market. The EMH states that all the information relevant to a market is
contained in the prices and each time that new information arises the market corrects
itself and absorbs it, in other words the market is efficient, therefore there is no space
for prediction. More specifically the EMH has got three forms [1]:
•
Weak: States that you cannot predict future stock prices on the basis of past stock
prices.
•
Semi-Strong: States that you cannot even utilize published information to predict
future prices.
•
Strong: Claims that you cannot predict the market no matter what information you
have available.
According to the above the market fluctuations are based on the ‘Random Walk’ model.
Which more formally stated is equivalent to:
y(t)=y(t-1) + rs
where y(t) is the value of the market on time t and rs is an Independent and Identically
Distributed (IID)1 variable. If we accept the validity of this model we imply that the
best prediction that you can have about tomorrow’s value is today’s value.
1
IID implies randomness.
18
Research has been done on the data of stock markets in order to prove that the market is
predictable. Hsieh (1991) proved for the S&P 500 that the weekly returns from 1962
until 1989, the daily returns from 1983 until 1989 and the 15 minutes returns during
1988 are not IDD [3]. Tsibouris and Zeidenberg (1996) tested the weak form of EMH
by using daily returns of stocks from U.S. stock market (from 1988 until 1990) and they
did manage to find evidence against it [4]. White (1993) did not manage to find enough
evidence to reject the EMH when he tried to predict the IBM stock returns on daily
basis using data from 1972 to 1980 [5].
The conclusion from the results of these studies is that there is no clear evidence
whether the market is predictable or not. We have an indication that the daily returns
(for the S&P 500) in which we are interested in are not randomly distributed (at least
from the period from 1983 until 1989). Therefore the methodology that we use in this
study is to test the time series that we are attempting to predict for randomness. If
proven non-random we will proceed with the implementation of prediction models. At
this point we have to make clear that non-randomness does not imply that no matter
what prediction model you will apply you will manage to predict the market
successfully; all it states is that the prediction task is not impossible.
2.2.3
Prediction Methods
The prediction of the market is without doubt an interesting task. In the literature there
are a number of methods applied to accomplish this task. These methods use various
approaches, ranging from highly informal ways (e.g. the study of a chart with the
fluctuation of the market) to more formal ways (e.g. linear or non-linear regressions).
We have categorized these techniques as follows:
•
Technical Analysis Methods,
•
Fundamental Analysis Methods,
•
Traditional Time Series Prediction Methods
•
and Machine Learning Methods.
The criterion to this categorization is the type of tools and the type of data that each
method is using in order to predict the market. What is common to these techniques is
that they are used to predict and thus benefit from the market’s future behavior. None of
them has proved to be the consistently correct prediction tool that the investor would
19
like to have. Furthermore many analysts question the usefulness of many of these
prediction techniques.
2.2.3.1
Technical Analysis
“Technical analysis is the method of predicting the appropriate time to buy or sell a
stock used by those believing in the castles-in-the-air view of stock pricing” (p. 119)
[1]. The idea behind technical analysis is that share prices move in trends dictated by the
constantly changing attributes of investors in response to different forces. Using
technical data such as price, volume, highest and lowest prices per trading period the
technical analyst uses charts to predict future stock movements. Price charts are used to
detect trends, these trends are assumed to be based on supply and demand issues which
often have cyclical or noticeable patterns. From the study of these charts trading rules
are extracted and used in the market environment. The technical analysts are known and
as ‘chartists’. Most chartists believe that the market is only 10 percent logical and 90
percent psychological [1]. The chartist’s belief is that a careful study of what the other
investors are doing will shed light on what the crowed is likely to do in the future.
This is a very popular approach used to predict the market, which has been heavily
criticized. The major point of criticism is that the extraction of trading rules from the
study of charts is highly subjective therefore different analysts might extract different
trading rules by studying the same charts. Although it is possible to use this
methodology to predict the market on daily basis we will not follow this approach on
this study due to its subjective character.
2.2.3.2
Fundamental Analysis
‘Fundamental analysis is the technique of applying the tenets of the firm foundation
theory to the selection of individual stocks”[1]. The analysts that use this method of
prediction use fundamental data in order to have a clear picture of the firm (industry or
market) they will choose to invest on. They are aiming to compute the ‘real’ value of
the asset that they will invest in and they determine this value by studying variables
such as the growth, the dividend payout, the interest rates, the risk of investment, the
sales level, the tax rates an so on. Their objective is to calculate the intrinsic value of an
asset (e.g. of a stock). Since they do so they apply a simple trading rule. If the intrinsic
20
value of the asset is higher than the value it holds in the market, invest in it. If not,
consider it a bad investment and avoid it. The fundamental analysts believe that the
market is defined 90 percent by logical and 10 percent by physiological factors.
This type of analysis is not possible to fit in the objectives of our study. The reason for
this is that the data it uses in order to determine the intrinsic value of an asset does not
change on daily basis. Therefore fundamental analysis is helpful for predicting the
market only in a long-term basis.
2.2.3.3
Traditional Time Series Prediction
The Traditional Time Series Prediction analyzes historic data and attempts to
approximate future values of a time series as a linear combination of these historic data.
In econometrics there are two basic types of time series forecasting: univariate (simple
regression) and multivariate (multivariate regression)[6].
These types of regression models are the most common tools used in econometrics to
predict time series. The way they are applied in practice is that firstly a set of factors
that influence (or more specific is assumed that influence) the series under prediction is
formed. These factors are the explanatory variables xi of the prediction model. Then a
mapping between their values xit and the values of the time series yt (y is the to-be
explained variable) is done, so that pairs {xit , yt} are formed. These pairs are used to
define the importance of each explanatory variable in the formulation of the to-be
explained variable. In other words the linear combination of xi that approximates in an
optimum way y is defined. Univariate models are based on one explanatory variable
(I=1) while multivariate models use more than one variable (I>1).
Regression models have been used to predict stock market time series. A good example
of the use of multivariate regression is the work of Pesaran and Timmermann (1994)
[7]. They attempted prediction of the excess returns time series of S&P 500 and the
Dow Jones on monthly, quarterly and annually basis. The data they used was from Jan
1954 until Dec 1990. Initially they used the subset from Jan 1954 until Dec 1959 to
adjust the coefficients of the explanatory variables of their models, and then applied the
models to predict the returns for the next year, quarter and month respectively.
21
Afterwards they adjusted their models again using the data from 1954 until 1959 plus
the data of the next year, quarter or month. This way as their predictions were shifting
in time the set that they used to adjust their models increased in size. The success of
their models in terms of correct predictions of the sign of the market (hit rate) are
presented in the next table:
Period from 1960-1990
S&P 500
Dow Jones
80.6%
71.0%
Annually
62.1%
62.1%
Quarterly
58.1%
57.3%
Monthly
Table 2.1: Percentage of correct predictions of the regression models.
Moreover, they applied these models in conjunction with the following trading rule: If
you hold stocks and the model predicts for the next period of time (either month, quarter
or year) negative excess returns sell the stocks and invest in bonds, else if the prediction
is for positive returns keep the stocks. In case you hold bonds a positive prediction
triggers a buying action while a negative prediction a hold action. Their study took into
consideration two scenarios one with and one without transaction costs. Finally they
compared the investment strategy which used their models with a buy and hold strategy.
The results they obtained (for the S&P500, for 1960 to 1990) are the following:
Change of profits compared to a buy/hold strategy
No Transaction Cost
High Transaction Cost
1.9%
1.5%
Annually
2.2%
1.1%
Quarterly
2.3%
-1.0%
Monthly
Table 2.2: Comparison of the profits of the regression models with those of a buy/hold strategy.
The results for Dow Jones were similar to those above.
Initially they used four explanatory variables the dividend yields, the inflation rate,
change in the industrial production, and the interest rates. They have computed the
coefficients of their models and after studying the residuals of those models they
discovered that they were not randomly distributed. This fact led them to add more
explanatory variables (lagged rates of changes in the business cycle). They did manage
to improve their models but still they had non-IID residuals. The final improvement
they made was that they have used non-linear explanatory variables (lagged values of
22
square returns) in an effort to capture non-linear patterns that might exist in the time
series data, the results they had (Table 2.2) indicated that the annual regression did not
improve while the quarterly and mostly the monthly regression did.
The conclusions we draw from this case study are the following:
•
In order to make profit out of the market a prediction model is not enough, what you
need is a prediction model in conjunction with a trading rule.
•
Transaction costs play a very important role in this procedure. From table 2.2 it is
clear that for the prediction on monthly basis presence of transaction costs cancel
the usefulness of their model. It is rational that in our case of daily prediction the
presence of the transaction cost will be more significant.
•
The improvement they managed to give to their models by adding non-linear
explanatory variables raises questions as to whether or not there are non-linear
patterns in the excess returns time series of the stock market. And more specifically
we observed that as the length of the prediction period was reduced (year, quarter,
month) these patterns seem to be more and more non-linear.
•
Finally we observe that as the prediction horizon they used was getting smaller the
hit rate of their models decreased. Thus in terms of hit rate the smaller the horizon
the worst the results.
To sum up, it is possible to apply this methodology to predict the market on a daily
basis. Additionally it is widely used by the economists and therefore it is a methodology
that we can use for the purposes of the present study.
2.2.3.4
Machine Learning Methods
Several methods for inductive learning have been developed under the common label
“Machine Learning”. All these methods use a set of samples to generate an
approximation of the underling function that generated the data. The aim is to draw
conclusions from these samples in such way that when unseen data are presented to a
model it is possible to infer the to-be explained variable from these data. The methods
we discuss here are: The Nearest Neighbor and the Neural Networks Techniques. Both
of these methods have been applied to market prediction; particularly for Neural
Networks there is a rich literature related to the forecast of the market on daily basis.
23
2.2.3.4.1
Nearest Neighbor Techniques
The nearest neighbor technique is suitable for classification tasks. It classifies unseen
data to bins by using their ‘distance’ from the k bin centroids. The ‘distance’ is usually
the Euclidean distance. In the frame of the stock market prediction this method can be
applied by creating three (or more) bins. One to classify the samples that indicate that
the market will rise. The second to classify the samples that indicate fall and the third
for the samples related with no change of the market.
Although this approach can be used to predict the market on daily basis we will not
attempt to apply it on this study. The main reason is that we will not attempt a
classification but a regression task. The classification task has the disadvantage that it
flattens the magnitude of the change (rise of fall). On the other hand it has the advantage
that as a task it is less noisy comparing to regression. Our intention is to see how well a
regression task can perform on the prediction of the market.
2.2.3.4.2
Neural Networks
‘A neural network may be considered as a data processing technique that maps, or
relates, some type of input stream of information to an output stream of data‘ [8].
Neural Networks (NNs) can be used to perform classification and regression tasks.
More specifically it has been proved by Cybenko (cited in Mitchel, 1997) that any
function can be approximated to arbitrary accuracy by a neural network [9].
NNs are consisted of neurons (or nodes) distributed across layers. The way these
neurons are distributed and the way they are linked with each other define the structure
of the network. Each of the links between the neurons is characterized by a weight
value. A neuron is a processing unit that takes a number of inputs and gives a distinct
output. Apart from the number of its inputs it is characterized by a function f known as
transfer function. The most commonly used transfer functions are: the hardlimit, the
pure linear, the sigmoid and the tansigmoid function2.
2
A more detailed description follows in Chapter 4.
24
There are three types of layers the input layer, the hidden layers, and the output layer.
Each network has exactly one input and one output layer. The number of hidden layers
can vary from 0 to any number. The input layer is the only layer that does not contain
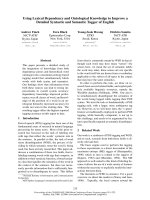
transfer functions. An example of a NN with two hidden layers is depicted in the next
figure [10].
Figure 2.2: NN structure with two hidden layers.
The architecture of this network is briefly described by the string: ‘R-S1-S2-S3’, which
implies that the input layer is consisted of R different inputs, there are two hidden layers
with S1 and S2 neurons respectively and the output layer has S3 neurons. In our study we
will use this notion each time that we want to refer to the architecture of a network.
Once the architecture and the transfer function of each neuron have been defined for a
network the values of its weights should be defined. The procedure of the adjustment of
weights is known as training of the NN. The training procedure ‘fits’ the network to a
set of samples (training set). The purpose of this fitting is that the fitted network will be
able to generalize on unseen samples and allow us to infer from them.
In literature NNs have been used in a variety of financial tasks such as [11]:
•
Credit Authorization screening
•
Mortgage risk assessment
•
Financial and economic forecasting
•
Risk rating of investments
•
Detection of regularities in security price movements.
25