Mối liên quan giữa Bệnh không lây với dịch vụ sức khỏe và các rào cản do xã hội ở người trung niên_ NCD related health services use and barrier differences by social locations of middle aged people in lao PDR
Bạn đang xem bản rút gọn của tài liệu. Xem và tải ngay bản đầy đủ của tài liệu tại đây (200.17 KB, 24 trang )
NCD related Health Services Use and Barrier Dif
erences by Social Locations of Middle Aged peop
le in Lao PDR
Gunjeong Lee, Kongmany Chaleunvong, Younhee Kang, Minah Kang, Harris Hyun-soo Kim, Kyungok Yi, Yuri Kim, Yookyung
Choi, Minjin Koo
September 26th- 27th , 2015
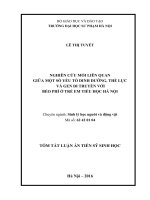
Gunjeong Lee, Ph.D.
Department of Global Health and Nursing, Ewha Womans University, Seoul, Ko
rea
Background
Non-communicable diseases (NCD) are on the rise to become one of the major cause of
morbidity and mortality of the people in Lao PDR.
Due to NCD’s deep impacts on economic and social burden, the importance of preventi
on and management of NCDs has been acknowledged widely.
Background
Limited researches on the need of NCD related health service use, the status of health se
rvice utilization, and barriers of service use.
This study analyzed the need, the use, and the barriers of NCD related health services in
relation of respondents’ social location.
Aims
1.
To examine the need of NCD related health service use
2.
To find out the methods and quantity of health service utilization
3.
To understand the barriers of needed health service use
4.
To investigate the differences of health service use by “social location”, such as gender,
age, financial status, and residential place.
Methods
Survey Study
Research Object : Middle aged people (40-59 years old)
Period : May 2th – June 3th, 2015
Randomly selected 25 urban villages in 2 district from Vientiane Capital and 25 rural vill
ages in 2 district from Vientiane Province.
Random selected 20 households from each village’s household list
Interviewed one member who is 40-59 years old
N=997 completed
removed 17 due to inappropriate or incomplete answers
Final N=979
Methods
Variables for this study
health service utilization
barriers of health service use
social locations such as gender, residential area, age, etc.
current health status and knowledge level of health
Statistical Analysis
Descriptive statistical methods and subgroup analyses by social location
Measure of NCD
Definition of NCD:
Diagnosed by Medical Doctor having Hypertension, Diabetes, Mellitus, Heart Disease,
Cerebro-vascualr Disease, or Cancer
Number (N)
Percent (%)
Diagnosed NCD
250
25.54%
No NCD
682
69.66%
Don’t know
47
4.80%
Total N
979
100%
Diagnosed NCD
Diagnosed NCD
N (Total N=250)
%
Hypertension
192
76.8%
Diabetes Mellitus
63
25.2%
52
20.8%
Cerebrovascular Disease (Stroke)
6
2.4%
Cancer
2
0.8%
Heart Disease
(Angina, Myocardial infarction, Heart rhythm problem,
etc.)
25people (10%) have more than one diagnosed NCDs
Diagnosed NCD
variable
NCD
No NCD
Don’ know
All
25.54%
69.66%
4.80%
Male (n=435)
21.38%
73.10%
5.52%
Female (n=544)
28.86%
66.91%
4.23%
40-49yr (n=510)
21.76%
74.51%
3.73%
50-59yr (n=469)
29.64%
64.39%
5.97%
Rural
25.66%
68.64%
5.70%
Urban
25.41%
70.70%
3.89%
Lao-tai
26.68%
69.42%
3.90%
Hmong-mien
16.05%
71.60%
12.35%
Others
22.45%
69.39%
8.16%
< primary
31.25%
57.95%
10.80%
Primary~ secondary shool
23.46%
73.46%
3.07%
≥ upper secondary school
25.58%
70.35%
4.07%
Literate
24.74%
71.31%
3.95%
Illiterate
31.36%
57.63%
11.02%
Unhealthy
37.62%
57.71%
4.67%
Healthy
16.15%
78.95%
4.90%
Employee
23.45%
71.72%
4.83%
Self-employee
25.83%
69.03%
5.14%
Others(Unemployed)
26.16%
70.35%
3.49%
(N=979)
sex
Age
Area
Ethnic-group
Education level
Literacy
0.024
0.002
0.402
0.003
0.000
0.000
Health status
Work status
P-value
0.000
0.877
Usual place for treatment
Variable
N
Total
Drug
Store
Clinic
Hospital
Community
Village
No
Health
Health
Place
Center
Volunteer
To go
Others
979
11.13%
13.59%
68.64%
2.25%
0.61%
1.33%
2.45%
NCD
250
7.20%
20.80%
68.40%
2.00%
0.00%
0.00%
1.60%
No NCD
682
11.00%
10.70%
70.97%
1.91%
0.88%
1.61%
2.93%
Male
435
14.48%
12.87%
64.83%
3.22%
0.23%
1.38%
2.99%
Female
544
8.46%
14.15%
71.69%
1.47%
0.92%
1.29%
2.02%
40-49
510
12.35%
13.92%
64.71%
3.33%
1.18%
1.57%
2.94%
50-59
469
9.81%
13.22%
72.92%
1.07%
0.00%
1.57%
2.94%
Lao-tai
847
10.51%
13.93%
69.89%
1.30%
0.71%
0.94%
2.72%
Hmong- Mien
81
17.28%
12.35%
56.79%
8.64%
0.00%
3.70%
1.23%
Others
49
8.16%
10.20%
69.39%
8.16%
0.00%
4.08%
0.00%
< Primary
176
15.91%
12.50%
63.64%
2.84%
0.57%
3.41%
1.14%
Primary- lower secondary
456
8.99%
13.38%
70.39%
2.85%
0.88%
1.10%
2.41%
≧ upper secondary
344
11.34%
14.53%
69.19%
1.16%
0.00%
0/58%
3.20%
Literacy
861
10.22%
14.05 %
69.57%
1.97%
0.46%
1.05%
2.67%
Illiteracy
118
17.80%
14.05 %
61.86%
4.24%
1.69%
3.99%
0.85%
Employee
115
8.28%
13.10%
75.86%
0.00%
0.69%
0.00%
2.07%
self-employee
662
12.24%
14.80%
65.56%
2.87%
0.60%
1.51%
2.42%
Unemployed
172
9.30%
9.30%
74.42%
1.74%
0.58%
1.74%
2.91%
Health
Unhealthy
428
10.98%
15.89%
67.99%
2.34%
0.47%
0.70%
1.64%
Status
Healthy
551
11.25%
11.80%
69.15%
2.18%
0.73%
1.81%
3.09%
NCD
P-value
0.000
Sex
0.014
Age
Ethnic
group
Education
0.011
Literacy
Work
0.000
0.0039
0.006
0.221
Status
0.266
Difficulty in getting medical care
Experience of difficulty in getting medical care
Yes
97
(9.92%)
No
882
(10.08%)
Reasons of Difficulty to get medical care
2
5
56
2
42
Health Service Use (during last 1yr)
Health Service
Total
NCD
No NCD
(N=979, % )
(N=250)
(N=682)
know
P-value
(N=47)
In-Patient
73
7.46%
13.6%
5.4%
4.3%
0.000
Emergency room
85
8.68%
12.8%
7.3%
6.4%
0.027
Out patient
208
21.25%
31.6%
18.2%
10.6%
0.000
Community health center
35
3.58%
6.4%
2.5%
4.3%
0.016
26
2.66%
3.2%
2.6%
0.0%
0.456
Traditional healer
77
7.87%
12.8%
6.6%
0.0%
0.001
Dental care
179
18.32%
18.8%
19.0%
6.4%
0.095
Village health care volunteer
Significant differences by subgroup analyses, more use on
•
•
•
•
•
•
•
Don’t
In-patient : Age(50-59 years old)
Emergency room : Sex(Female), Area(Urban)
Out-patient experiences b: Sex(Female)
Community health center services : Area(Rural)
Village health care volunteer(or worker) : Sex(Female), Age(40-49 years old), Area(Rural)
Traditional healer : Area(Rural)
Dental care : Sex(Female), Area(Urban)
Drug store use during last month
Total
NCD
No NCD
Don’t know
(N=979)
(n=250)
(n=682)
(n=47)
1-2 times per 1 month
30.75%
34.00%
29.47%
31.91%
Over 3 times per 1mon
17.77%
26.00%
14.96%
14.89%
Not used
51.48%
40.00%
55.57%
53.19%
Frequency of Drug store Use
Significant difference by subgroup analyses, more use for
•
•
Area -rural
Health status- Unhealthy
P-value
0.000
Medical insurance
Having insurance
All
NCD
No NCD
Don’t know
(N=979)
(n=250)
(n=682)
(n=47)
25.23%
29.72%
29.23%
17.02%
P-value
0.088
No Insurance
74.77%
70.28%
70.77%
80.98%
Among Having insurance
N=246
100%
Public Insurance
235
95.5%
Private Insurance
12
4.5%
Information about NCD
Total
N=979
NCD
No NCD
Don’t know
P
100%
(n=250)
(n=50)
(n=47)
-value
Received information
410
41.88%
64.40%
34.90%
23.40%
Not received information
527
53.8%
35.60%
78.13%
74.47%
Don’t know
2
0.2%
0.00%
50.00%
2.13%
Received Information about?
Hypertension
Diabetes mellitus
Both
404 (41.27%)
340 (34.73%)
331 (33.81%)
0.000
Medical check up
Total
NCD
No NCD
(n=250)
(n=682)
Don’t
know
(n=47)
N
%
Regular check up
277
28.3%
39.60%
25.07%
14.89%
Irregular check up
343
35.0%
49.60%
34.02%
25.53%
No medical check up
359
36.7%
20.80%
40.91%
59.57%
Pvalue
P<0.001
Logistic regression analysis
on Getting Regular Medical check up
Among NCD
Independent variable
OR (95% CI)
Among Non NCD
p-value
OR (95% CI)
p-value
Male
1.56 (0.79-3.06)
0.192
1.29 (0.93-1.78)
0.124
age
0.98 (0.93-1.04)
0.571
0.99 (0.14-2.05)
0.692
rural
0.51 (0.24-1.05)
0.067
0.89 (0.64-1.23)
0.473
2.67 (0.69-10.29)
0.154
2.44 (1.35-4.43)
0.003
Less than primary school
0.95 (0.30-2.99)
0.933
1.31 (0.76-2.25)
0.338
Illiteracy
1.27 (0.36-4.47)
0.706
1.92 (1.02-3.64)
0.043
Unhealthy
1.66 (0.86-3.20)
0.134
1.46 (1.05-2.02)
0.025
Unemployed
0.98 (0.93-1.04)
0.571
0.99 (0.14-2.05)
0.692
Hmong-mien
Difficulty in getting medical care
Total
NCD
No NCD
(n=250)
(n=682)
Don’t
know
(n=47)
N
%
Yes
96
28.3%
12.85%
8.06%
19.15%
No
877
35.0%
87.15%
91.20%
80.85%
Don’t Know
5
36.7%
0.00%
0.73%
0.00%
Pvalue
0.021
Logistic regression analysis
on difficulty in getting medical care
Among NCD
Independent variable
OR (95% CI)
Among Non NCD
p-value
OR (95% CI)
p-value
Male
0.38 (1.43-0.99)
0.047
0.84 (0.44-1.61)
0.606
age
1.00 (0.94-1.08)
0.886
0.96 (0.92-1.01)
0.139
rural
1.53 (0.65-3.57)
0.328
1.96 (0.99-3.85)
0.052
Hmong-mien
0.51 (0.63-3.57)
0.548
2.93 (1.23-7.01)
0.015
Less than primary school
0.63 (0.19-2.13)
0.456
1.59 (0.61-4.15)
0.340
Illiteracy
2.31 (0.64-8.32)
0.199
0.72 (0.24-2.19)
0.570
Unhealthy
1.39 (0.59-3.25)
0.449
3.76 (2.03-6.95)
0.000
Unemployed
0.98 (3.46-2.76)
0.964
1.49 (0.70-3.12)
0.296
Results
There were significant differences of NCD diagnose rate between sex group, age grou
p, ethnic group, education
NCD diagnosis, sex, age, ethnic group, education level
differences on usual
level, literacy or not and health status.
and literacy made significant
treatment place.
The highest two main reason on difficulty in getting
medical care were ‘cost’ an
d ‘transportation’.
NCD diagnosis made an significant differences on health service use in last 1 year suc
h as in-patient experience, emergency room use, out-patient experience, community
health care center use and traditional healer use.
Results
NCD diagnosis made an significant differences on Drug store use in last 30 days. Also,
area and health status
made such significant differences.
NCD diagnosis made an significant differences on
Hmong mien, the more illiterate, the more unhealthy and the more unemployed, the h
Information about NCD.
igher the rate of ‘no medical check up’.
Male, Hmong mien, the more unhealthy and the more
ate of ‘Experience of
unemployed, the higher the r
difficulty in getting medical care’.
Conclusion
By this survey, the gaps of medical service need and health service use are not big.
However, more researches are needed on the meaning of medical diagnosis, health serv
ice use, medical check-up, due to the low level of using medical facilities and
kn
owledge on NCDs.
There are significant differences on NCD related health
cial locations. Therefore
service use and barriers by so
political intervention is needed to improve health service a
ccessibility and affordability for the group with unmet
health service need.
References
Ali, M. K., Rabadán-Diehl, C., Flanigan, J., Blanchard, C., Narayan, K. M. V., & Engelgau, M. (2013). Systems and Capacity to Address Noncommunicable Diseases in Low- and Middle-Income Countries. Science Translational
Medicine, 5(181), 181cm184. doi: 10.1126/scitranslmed.3005121.
Atienza, A., & King, A. (2002). Community-based health intervention trials: an overview of methodological issues. Epidemiol Rev, 24(1), 72 - 79.
Beaglehole, R., Bonita, R., Alleyne, G., Horton, R., Li, L., Lincoln, P., Nishtar, S. (2011). UN High-Level Meeting on Non-Communicable Diseases: addressing four questions. Lancet, 378(9789), 449 - 455.
Beaglehole, R., Bonita, R., Horton, R., Adams, C., Alleyne, G., Asaria, P., Casswell, S. (2011). Priority actions for the non-communicable disease crisis. Lancet, 377(9775), 1438 - 1447.
Chongsuvivatwong, V., Phua, K., Yap, M., Pocock, N., Hashim, J., Chhem, R., . . . Lopez, A. (2011). Health and health-care systems in Southeast Asia: diversity and transitions. Lancet, 377(9763), 429 – 437.
Chu, Vang et al.(2010), Report on STEPS Survey on Non Communicable Diseases Risk Factors in Vientiane Capital city, Lao PDR, WHO.
Dans, A., Ng, N., Varghese, C., Tai, E., Firestone, R., & Bonita, R. (2011). The rise of chronic non-communicable diseases in Southeast Asia: time for action. Lancet, 377(9766), 680 - 689.
Health in Southeast Asia (2011), The rise of chronic non-communicable diseases in southeast Asia: time for action.
Loo KW, Gan SH: The burden of stroke in the Lao People's Democratic Republic. International Journal of Stroke 2013, 8(4):273-275.
Miranda, J., Kinra, S., Casas, J., Davey Smith, G., & Ebrahim, S. (2008). Non-communicable diseases in low- and middle-income countries: context, determinants and health policy. Trop Med Int Health, 13(10), 1225 - 1234.
Morgan, D. (1998). Practical strategies for combining qualitative and quantitative methods: applications to health research. Qual Health Res, 8(3), 362 - 376.
WHO(2011), Country Cooperation Strategy for the Lao People’s Democratic Republic.
WHO(2013), Lao People’s Democratic Republic: health Profile.
WHO(2014), NCD country profile: Lao PDR.
Q&A
Thank you.