bài giảng investment analysis and management chapter 10
Bạn đang xem bản rút gọn của tài liệu. Xem và tải ngay bản đầy đủ của tài liệu tại đây (108.85 KB, 25 trang )
Common Stock
Valuation
Chapter 10
Charles P. Jones, Investments: Analysis and
Management,
Tenth Edition, John Wiley & Sons
Prepared by
G.D. Koppenhaver, Iowa State University
10-1
Fundamental Analysis
Present value approach
Capitalization of expected income
Intrinsic value based on the discounted
value of the expected stream of cash flows
Multiple of earnings approach
Valuation relative to a financial performance
measure
Justified P/E ratio
10-2
Present Value Approach
Intrinsic value of a security is
n
Value of security = ∑
Cash Flows
t =1
( 1 + k)t
Estimated intrinsic value compared to
the current market price
What if market price is different than
estimated intrinsic value?
10-3
Required Inputs
Discount rate
Required rate of return: minimum expected
rate to induce purchase
The opportunity cost of dollars used for
investment
Expected cash flows
Stream of dividends or other cash payouts
over the life of the investment
10-4
Required Inputs
Expected cash flows
Dividends paid out of earnings
Earnings important in valuing stocks
Retained earnings enhance future earnings
and ultimately dividends
Retained earnings imply growth and future
dividends
Produces similar results as current dividends in
valuation of common shares
10-5
Dividend Discount Model
Current value of a share of stock is the
discounted value of all future dividends
Pcs =
D1
1
( 1 + kcs )
+
D2
( 1 + kcs )
∞
= ∑
t =1
2
+ ... +
D∞
( 1 + kcs )
Dt
( 1 + kcs )t
10-6
∞
Dividend Discount Model
Problems:
Need infinite stream of dividends
Dividend stream is uncertain
Must estimate future dividends
Dividends may be expected to grow over
time
Must model expected growth rate of dividends
and need not be constant
10-7
Dividend Discount Model
Assume no growth in dividends
Fixed dollar amount of dividends reduces
the security to a perpetuity
D0
P0 =
kcs
Similar to preferred stock because dividend
remains unchanged
10-8
Dividend Discount Model
Assume a constant growth in dividends
Dividends expected to grow at a constant
rate, g, over time
D1
P0 =
k −g
D1 is the expected dividend at end of the
first period
D1 =D0 × (1+g)
10-9
Dividend Discount Model
Implications of constant growth
Stock prices grow at the same rate as the
dividends
Stock total returns grow at the required rate
of return
Growth rate in price plus growth rate in dividends
equals k, the required rate of return
A lower required return or a higher
expected growth in dividends raises prices
10-10
Dividend Discount Model
Multiple growth rates: two or more
expected growth rates in dividends
Ultimately, growth rate must equal that of
the economy as a whole
Assume growth at a rapid rate for n periods
followed by steady growth
n
P0 = ∑
t =1
D0( 1 + g1 )
( 1 + k)
t
t
Dn( 1 + gc )
1
+
n
k-g
( 1 + k)
10-11
Dividend Discount Model
Multiple growth rates
First present value covers the period of
super-normal (or sub-normal) growth
Second present value covers the period of
stable growth
Expected price uses constant-growth model as of
the end of super- (sub-) normal period
Value at n must be discounted to time period zero
10-12
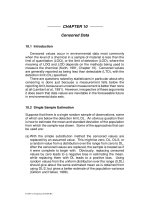
Example: Valuing equity with
growth of
30% for 3 years, then a long-run
constant growth of 6%
0 k=16% 1
2
3
g = 30% g = 30%
D0 = 4.00
4.48
5.02
5.63
59.68
74.81 = P0
5.20
g = 30%
6.76
4
g = 6%
8.788
9.315
P3 = 9.315
.10
What About Capital Gains?
Is the dividend discount model only
capable of handling dividends?
Capital gains are also important
Price received in future reflects
expectations of dividends from that
point forward
Discounting dividends or a combination of
dividends and price produces same results
10-14
Other Discounted Cash
Flows
Free Cash Flow to Equity (FCFE): What could
shareholders be paid?
Free Cash Flow to the Firm (FCFF): What cash
is available before any financing
considerations?
FCFE = Net Inc. + Depreciation – Change in
Noncash Working Capital – Capital Expend. – Debt
Repayments + Debt Issuance
FCFF = EBIT (1-tax rate) + Depreciation – Change in
Noncash Working Capital – Capital Expend.
Use per share measures instead of dividends
10-15
Intrinsic Value
“Fair” value based on the capitalization
of income process
The objective of fundamental analysis
If intrinsic value >(<) current market
price, hold or purchase (avoid or sell)
because the asset is undervalued
(overvalued)
Decision will always involve estimates
10-16
P/E Ratio or Earnings
Multiplier Approach
Alternative approach often used by
security analysts
P/E ratio is the strength with which
investors value earnings as expressed
in stock price
Divide the current market price of the stock
by the latest 12-month earnings
Price paid for each $1 of earnings
10-17
P/E Ratio Approach
To estimate share value
Po = estimated earnings
× justified P/E rati o = E1 × Po /E1
P/E ratio can be derived from
D1
D1/E1
Po =
or Po /E1 =
k-g
k-g
Indicates the factors that affect the
estimated P/E ratio
10-18
P/E Ratio Approach
The higher the payout ratio, the higher
the justified P/E
Payout ratio is the proportion of earnings
that are paid out as dividends
The higher the expected growth rate, g,
the higher the justified P/E
The higher the required rate of return,
k, the lower the justified P/E
10-19
Understanding the P/E
Ratio
Can firms increase payout ratio to increase
market price?
Does rapid growth affect the riskiness of
earnings?
Will future growth prospects be affected?
Will the required return be affected?
Are some growth factors more desirable than
others?
P/E ratios reflect expected growth and risk
10-20
P/E Ratios and Interest
Rates
A P/E ratio reflects investor optimism
and pessimism
Related to the required rate of return
As interest rates increase, required
rates of return on all securities
generally increase
P/E ratios and interest rates are
indirectly related
10-21
Which Approach Is Best?
Best estimate is probably the present
value of the (estimated) dividends
Can future dividends be estimated with
accuracy?
Investors like to focus on capital gains not
dividends
P/E multiplier remains popular for its
ease in use and the objections to the
dividend discount model
10-22
Which Approach Is Best?
Complementary approaches?
P/E ratio can be derived from the constantgrowth version of the dividend discount
model
Dividends are paid out of earnings
Using both increases the likelihood of
obtaining reasonable results
Dealing with uncertain future is always
subject to error
10-23
Other Multiples
Price-to-book value ratio
Ratio of share price to stockholder equity as
measured on the balance sheet
Price paid for each $1 of equity
Price-to-sales ratio
Ratio of a company’s total market value
(price times number of shares) divided by
sales
Market valuation of a firm’s revenues
10-24
Copyright 2006 John Wiley & Sons, Inc. All rights reserved.
Reproduction or translation of this work beyond that
permitted in Section 117 of the 1976 United states
Copyright Act without the express written permission of
the copyright owner is unlawful. Request for further
information should be addressed to the Permissions
department, John Wiley & Sons, Inc. The purchaser may
make back-up copies for his/her own use only and not for
distribution or resale. The Publisher assumes no
responsibility for errors, omissions, or damages, caused
by the use of these programs or from the use of the
information contained herein.
10-25