ielts SAMPLES OF BAR+ LINE GRAPHS
Bạn đang xem bản rút gọn của tài liệu. Xem và tải ngay bản đầy đủ của tài liệu tại đây (253.93 KB, 2 trang )
WRITTEN BY MS LE NA
TIMING: 5 MINUTES
TO MY BELOVED STUDENTS
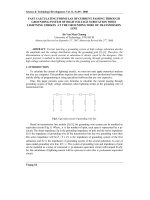
The chart indicates the amount of money per week spent on fast foods
in Britain and trends in consumption of fast-foods
To illustrate, hamburger was the favorite option in the high income
and average income groups with above 30% while it was only the
second popular dish of the lowest income group.
By comparison, fish and chips were the most common choice of low
income having 17%. However, they turned out to be the least favored
by high income people.
Meanwhile, pizza, although being still more consumed than the
former by high income group, was placed at the bottom of average
income and low income people’s list with no more than 12%.
In the line graph, it is clear that hamburger and pizza enjoyed higher
consumption amounts over the years, increasing from a point of less
than 100 and ending with a level of above 280 grams. Yet, a contrasting
pattern was seen in fish and chips, falling from a high of approximately
300 in 1970 to around 200 grams in 1990.
In general, the higher income people had, the more food they
consumed.
Word count: 184 words