The Effects of NT Dollar Variations on Taiwan’s Trade Flows
Bạn đang xem bản rút gọn của tài liệu. Xem và tải ngay bản đầy đủ của tài liệu tại đây (508.38 KB, 35 trang )
This PDF is a selection from an out-of-print volume from the National Bureau
of Economic Research
Volume Title: Macroeconomic Linkage: Savings, Exchange Rates, and Capital
Flows, NBER-EASE Volume 3
Volume Author/Editor: Takatoshi Ito and Anne Krueger, editors
Volume Publisher: University of Chicago Press
Volume ISBN: 0-226-38669-4
Volume URL: />Conference Date: June 17-19, 1992
Publication Date: January 1994
Chapter Title: The Effects of NT Dollar Variations on Taiwan’s Trade
Flows
Chapter Author: San Gee
Chapter URL: />Chapter pages in book: (p. 89 - 122)
4
The Effects of NT Dollar
Variations on Taiwan’s
Trade Flows
San Gee
The vast appreciation of the New Taiwan (NT) dollar after the mid-1980s has
not only affected the external trade structure of Taiwan but has also had a
tremendous impact on internal industrial structural change in Taiwan. For instance, the NT dollar’s dramatic appreciation against the U.S. dollar has certainly imposed great difficulties on Taiwanese exporters attempting to sell their
products to the United States. In addition, the rising tide of protectionism in
the mid- 1980s created tremendous pressure for Taiwanese exporters to diversify their markets away from the United States. It is also important to note
that, while the NT dollar appreciated considerably against the U.S. dollar, the
German mark and Japanese yen appreciated against the U.S. dollar at an even
faster pace. As a result, the NT dollar has actually depreciated against the
German mark and Japanese yen, despite the fact that it has appreciated by more
than 30 percent over the period 1986-90. Furthermore, many Southeast Asian
currencies have actually depreciated against the U.S. dollar, which makes it
very difficult for Taiwan’s exporters to diversify their markets to this region.
Consequently, it is not difficult to see that Europe has become the natural and
best alternative for Taiwanese exporters to explore, and from the middle of the
1980s there has been a significant trade structure change in Taiwan.
To examine explicitly how the NT dollar appreciation affects Taiwan’s external trade structure we have divided this paper into five sections. In sections 4.1
and 4.2 we establish an empirical model to examine how NT dollar fluctuations
affect Taiwan’s external trade relations, and we report and discuss the model’s
empirical results. In section 4.3, instead of using the nominal exchange rate to
examine the effect of variations of the NT dollar on Taiwan’s external trade, we
shall calculate the real effective exchange rate (REER) for NT dollars and shall
San Gee is professor of economics at National Central University, Chung-Li, Taiwan.
89
90
SanGee
investigate what kind of REERs are more capable of indicating proper exchange rate levels for the NT dollar and how REERs can explain the export
and import behavior of Taiwan’s economy. Since REERs are less suitable for
explaining bilateral trade activities, in section 4.4 we calculate the pricecompetition index (PCI) for Taiwan’s major trading partners and examine the
relationship between PCIs and bilateral trade activities between Taiwan and
these partners. Finally, a brief summary of the main findings in this paper is
made in section 4.5.
4.1
The Empirical Model
Some studies, for instance, Miles (1979), have tried to determine how a devaluation affects the trade balance or balance of payments. In Miles’s model
the trade balance is affected by real factors such as the relative growth rate and
real output as well as by monetary factors such as the money supply and nominal exchange levels. Miles found that devaluations do not improve the trade
balance but do improve the balance of payments. However, Miles’s study was
criticized by Himarios (1985) for two major reasons: first, Miles uses only
nominal exchange rates in his model to examine the effect of exchange rate
variations on trade flow. However, as Krueger (1978) pointed out, following
devaluation it is the price of tradables relative to nontradables that matters.
Therefore, Himarios argued, it would be more appropriate to use the real exchange rate, rather than nominal rates, to examine the effect of exchange rate
variations on the trade balance. Second, Himarios argued that Miles imposes
a priori subtractive linear restrictions and that they produce biased estimates
of the coefficients. In light of these studies by Miles and Himarios, we shall
undertake a more detailed study by separating Taiwan’s trade balance into exports and imports and then examining how these two contrasting trade activities are affected by the nominal and real exchange rates. In addition, a linear,
rather than a subtractive linear restrictions, form is employed in order to avoid
bias in the estimates.
In light of the above discussion, we shall now specify our empirical model
of the effect of changes of the nominal exchange rate on Taiwan’s total export
(TEXT) as
TEXT = AINCOME, UST, WAGE, Q1 - 43,T), where
TEXT
INCOME:
UST
WAGE:
Taiwan’s total quarterly export value (in million U.S. dollars)
from the first quarter of 1972 to the fourth quarter of 1990.
the weighted average GNP of Taiwan’s five major export destination countrieshreas (the United States, Japan, Canada, Singapore, and Hong Kong). The weights are based on their share
of exports.
Exchange rate between one NT dollar and the U.S. dollar.
Relative real wage ratios between Taiwan’s real wages and the
91
The Effects of NT Dollar Variations on Taiwan’s Trade Flows
Q1 - 43:
T:
weighted average real wages of the above five major exporting
countriesh-egions. The weights are also determined by their
share of exports.
Quarterly dummies.
Time trend variable.
As for Taiwan’s total imports model, it is specified as
TIMT =f(TGNP, UST, WAGE, Q, - Q3,T), where
TIMT
INCOME:
WAGE:
Taiwan’s total quarterly import value (in million U.S. dollars)
from the first quarter of 1972 to the fourth quarter of 1990.
Taiwan’s quarterly GNP in billion U.S. dollars.
Relative real wage ratios between Taiwan’s real wages and the
weighted average real wages of Taiwan’s five major importsource countrieshegions (the United States, Japan, West Germany, Singapore, and Hong Kong).
In the above models we assume that Taiwan’s exports (imports) depend on
importing countries’ (Taiwan’s) income levels and terms of trade, which include relative real wages or productivity as well as exchange rates, seasonal
factors, and time trends. If we merely wish to examine Taiwan’s import and
export relationship with the United States, then INCOME will be U.S. GNP,
and WAGE will be the relative real wage ratio between Taiwan and the
United States.
4.2 Empirical Results for the Nominal Exchange Rate Model
Based on our empirical models of the equations for TEXT and TIMT, we
present our empirical results in table 4.1. From this table, we see that when
Taiwan’s income in terms of GNP value increases, INCOME significantly and
positively affects Taiwan’s total importing value (TIMT). As for exchange
rates, the first two equations of table 4.1 show that an appreciation in the NT
dollar (which will lead to an increase in UST by our definition) will lead to
an increase in Taiwan’s total import value, but this increase will not become
significant until after two to three quarters have elapsed. As for the relative real
wage ratio between Taiwan and the weighted average of Taiwan’s five major
import sources, the WAGE variables in equations ( 1 ) and ( 2 ) confirm that an
increase in Taiwan’s productivity relative to that of its import sources will lead
to a decline in Taiwan’s total importing value. Clearly the first two equations
of table 4.1 show that an increase in Taiwan’s income and/or an appreciation of
the NT dollar will lead to an increase in Taiwan’s total imports, while an increase in Taiwan’s productivity will result in more import substitution and will
reduce Taiwan’s total imports.
Equations (3) and (4) of table 4.1 report the empirical results for Taiwan’s
total export value (TEXT). Our empirical results show that an increase in the
92
SanGee
Table 4.1
Determination of Taiwan’s Total Exports (TEXT)and Imports
(TIMT) (absolute t-statistics)
TIMT
Variable
CONSTANT
INCOME
UST
USTI
UST2
(1)
-6.55 E-3
(2.68)***
171.52
(2.71)***
1.21 E-5
( 1.47)
7.34 E-4
( 1.28)
9.97 E-4
(1.80)*
UST3
WAGE
WAGE I
WAGE2
1225.19
(0.82)
-2450.52
(1.32)
- 5420.13
(3.44)***
WAGE3
Q1
Q2
Q3
T
R 2
D-W
N
- 157.30
(1.43)
182.71
(1.49)
56.82
(0.54)
61.57
(2.76)***
0.93
1.87
78
TEXT
(2)
-9.26 E-3
(3.60)***
1 16.49
(1.70)*
3.60 E-4
(0.41)
6.15 E-4
(1.18)
5.3.5 E-4
(1.01)
2.79 E-5
(3.63)***
-2103.83
(0.98)
-584 1.09
(2.53)**
-5151.16
(2.13)**
-321.52
(0.14)
-99.21
(0.99)
246.19
(2.17)**
92.98
(0.94)
86.79
(3.65)***
0.93
1.94
78
(3)
- 1.09 E-4
(9.15)***
4.76
(5.66)***
4.86 E-5
(8.19)***
-8.34 E-5
(1.38)
- 1.36 E-5
(2.36)**
2312.47
( 1.20)
2752.63
(1.2.5)
1628.40
(0.90)
-432.68
(3.77)***
141.89
(1.12)
228.91
(2.10)**
-70.40
( 1.60)
0.97
1.85
78
(4)
-1.11 E-4
(6.55)***
4.74
(5.69)***
5.21 E-5
(7.47)***
-7.64 E-4
(1.20)
- 1.04 E-5
(1.60)
-6.43 E-4
(0.70)
-2268.60
(0.82)
3582.72
(1.24)
924.07
(0.39)
- 1554.56
(0.66)
-464.24
(3.84)***
9 I .99
(0.67)
195.44
(1.65)
-66.68
(1.51)
0.98
1.81
78
Notes: Variable INCOME in TIMT equations is Taiwan’s GNP level, in TEXT equations, the
weighted average GNP of Taiwan’s five major export markets. In addition, consult text under eq.
(1) and (2) for definitions of WAGE in TIMT and in TEXT equations. USTI, UST2, UST3,
WAGEI, WAGE2, and WAGE3 are different time lag variables for variables UST and WAGE, respectively.
*Significant at 10 percent level
**Significant at 5 percent level
***Significant at I percent level
93
The Effects of NT Dollar Variations on Taiwan’s Trade Flows
weighted average GNP of Taiwan’s major export markets (INCOME) will lead
to an increase in Taiwan’s total exports; the income effect is thus quite clear.
As for exchange rates, equations (3) and (4) show that an appreciation in the
NT dollar will initially lead to an increase in Taiwan’s total exports but will
then have an adverse effect on Taiwan’s total exports. However, judging from
the empirical results in equation (4), this adverse effect may not be very significant. The main reason that an appreciation in the NT dollar will lead to an
increase in Taiwan’s total exports in the initial period may be that, in light of
possible further NT dollar appreciation, Taiwanese exporters are likely to deliver their shipments earlier than they had originally scheduled. Therefore Taiwan’s total export value will rise particularly in the initial period of NT appreciation. Although in equation (3) we have confirmed that an appreciation in the
NT dollar will adversely affect Taiwan’s total exports, this result is not supported by our findings in equation (4). One possible explanation for this may
be that an appreciation in the NT dollar against the U.S. dollar may adversely
affect Taiwanese exports to the U.S. market. However the NT dollar has actually depreciated against other vastly appreciated currencies such as the German mark and Japanese yen, which will certainly help Taiwan’s exporters diverr
sify their markets away from the United States to other major markets, in
particular the European market. Consequently, an appreciation in the NT dollar
may have no significant impact on Taiwan’s total export value.
To support the above argument, we can examine market share statistics in
table 4.2. Here, we list Taiwan’s export shares for the United States, Japan, and
European countries. The statistics show that Taiwan’s share of the U S . market
increased dramatically from 34 percent in 1980 to 48 percent in 1985. This is
due mainly to the undervaluation of the NT dollar accompanied by the rapid
Table 4.2
Taiwan Major Export Partners (TO)
~
Great
Year
United
States
Japan
Europe
Britain
1980
1981
1982
1983
1984
1985
1986
1987
1988
1989
1990
1991
34
36
39
45
49
48
48
44
39
36
32
29
11
11
11
10
10
11
11
13
14
14
12
12
16
13
12
2
3
2
2
2
2
2
1
1
1
3
3
3
3
3
1
2
2
2
2
2
2
2
2
3
3
11
10
10
12
15
16
17
18
18
France
Netherlands
1
2
2
1
2
1
I
1
1
1
West
Germany
5
4
4
3
3
3
3
4
4
4
5
5
Source: Monthly Statistics of Export and import in Taiwan Area of the ROC (Taipei: Ministry
of Finance).
94
SanGee
acceleration of the U.S. trade deficit from the early to the mid-1 980s. However,
as the NT dollar appreciated dramatically after the mid-1980s and as the tide
of protectionism in the United States rose, Taiwanese exporters swiftly shifted
their markets from the United States to Europe. As a result, Taiwan’s U.S. market share declined from 48 percent in 1985 to 32 percent in 1990 and 29 percent in 1991, while Taiwan’s European market share increased from 10 percent
in 1985 to 18 percent in 1990 and 1991. Clearly, there was a dramatic structural
change in Taiwan’s trade relationship with the United States and Europe in
the 1980s.
In table 4.3, we examine how changes in exchange rates and relative productivities affect Taiwan-U.S. trade. In the first two equations of this table we
present the empirical results for Taiwanese imports from the United States
(TIMUS). From equation (1) we see that Taiwanese GNP (represented by
INCOME) has a significant effect on U.S. exports to Taiwan, while an appreciation in the NT dollar against the U S . dollar (UST2) and an increase in Taiwan’s productivity relative to that of the United States (WAGE2) have significant positive and negative impacts, respectively, on Taiwan’s imports from the
United States six months later. In equation (2) of table 4.3, we introduce more
time lags for exchange rate (UST) and relative productivity (WAGE) variables
to examine factors relevant to Taiwanese imports from the United States. The
empirical results again confirm the result in equation (1) that an appreciation
in the NT dollar will lead to a reduction in import cost and induce more imports
from the United States. Conversely, an improvement in Taiwan’s productivity
relative to that of the United States will promote more import substitution and
will reduce Taiwanese imports from the United States.
We also examine relevant factors that affect Taiwanese exports to the United
States. The empirical results from equations (3) and (4) show that U S . GNP
levels (INCOME) positively affect Taiwanese exports to the United States. An
appreciation in the NT dollar against the U.S. dollar will adversely affect Taiwanese exports to the United States-though it may promote such exports in
the first period of NT appreciation. Contrary to our expectations, however,
equations (3) and (4) show that an improvement in Taiwan’s productivity relative to that of the United States will reduce Taiwanese exports to the United
States. This is illustrated by the many negative and highly significant regression coefficients for the WAGE variables. There are several possible explanations for this phenomenon. First, as Taiwan improves its productivity, more and
more Taiwanese exporters find it feasible to meet the higher standards demanded by European customers, and therefore an increase in Taiwan’s productivity may result in a structural shift in exports away from the U.S. to the European market. Second, the United States introduced more trade protection
clauses such as “301” or “super 301” into the U.S. Trade Act in the mid- to
late-gos, and this undoubtedly forced Taiwanese exporters to diversify their
export market away from the United States. These responses were, in turn,
negatively correlated with the faster-rising productivity trend (relative to the
95
The Effects of NT Dollar Variations on Taiwan’s Trade Flows
Table 4.3
Determination of Taiwan’s Total Exports (TEXUS) and Imports
(TIMUS) with the United States (absolute r-statistics)
TIMUS
(1)
CONSTANT
INCOME
-2.32 E-3
(3.90)***
35.82
(2.02)**
UST
USTl
UST2
9.67 E-4
(4.18)***
UST3
WAGE
WAGE I
WAGE2
--2325.61
(1.91)*
WAGE3
Q1
Q2
43
T
R 2
D-W
N
38.63
(0.75)
132.09
(2.29)**
67.87
(1.19)
18.61
(3.00)***
0.87
1.77
78
TEXUS
(2)
-4.30 E-3
(3.30)***
59.09
(1.39)
-7.93 E-4
(1.82)*
7.58 E-4
(2.52)**
5.30 E-4
(1.56)
1.51 E-5
(3.40)***
-1471.29
(0.90)
- 1459.32
(0.85)
-4526.07
(2.29)**
-3777.36
(2.12)* *
14.49
(0.27)
71.29
(1.17)
53.09
( 1.02)
30.48
(2.84)***
0.84
1.72
78
(3)
-3.67 E-3
(2.24)**
1.60
(2.26)**
2.19 E-5
(6.55)***
-3.60 E-4
(1.15)
-9.06 E-4
(2.58)***
-4493.74
(3.48)***
-2422.12
(1.80)*
1651.16
(1.34)
- 156.47
(2.95)***
141.56
(2.32)**
139.93
(2.72)***
-1.23
(0.17)
0.83
1.76
78
(4)
-5.64 E-3
(3.62)***
2.47
(5.06)***
2.98 E-5
(8.47)***
- 1.69 E-4
(0.51)
-6.67 E-4
(1.90)”
-5.73 E-4
(1.18)
-5514.88
(3.48)***
-2869.92
(1.54)
-914.55
(0.60)
-3644.38
(2.60)**
-2 14.71
(3.65)***
93.74
(1.38)
121.31
(2.11)**
-33.52
( 1.23)
0.95
1.74
78
Notes: Variable WAGE is relative real wages (productivities) between Taiwan and the United
States. Variable INCOME in TIMUS equations is Taiwan’s GNP level, in TEXUS equations, U.S.
GNP level.
*Significant at 10 percent level.
**Significant at 5 percent level.
***Significant at 1 percent level.
United States) in Taiwan. Third, beginning in the mid-1980s Taiwan’s outward
investment in Southeast Asian countries, as well as in mainland China, increased dramatically. The statistics from the investment authorities of Southeast Asian countries show that in 1989, in Thailand, Malaysia, and the Philippines, Taiwan ranked second only to Japan as the largest foreign direct
96
SanGee
investment (FDI) source country. Furthermore, it is estimated that the total
amount of Taiwanese investment in mainland China increased from $100 million (U.S.) in 1987 to more than $1 billion (U.S.) in 1989. These huge outward
investments may be due to such internal factors as the labor shortage together
with rising labor cost, the introduction of the Labor Standards Law in 1984 to
protect worker’s rights, which in turn boosted the cost of labor considerably,
the relaxation of foreign exchange control, and the appreciation of the NT dollar. More and more traditional labor-intensive industries have thus moved their
operations out of Taiwan. This, in turn, may actually increase Taiwan’s overall
competitiveness, but it will reduce Taiwanese exports to the United States.
Therefore, the negative relationship between a relative improvement in Taiwan’s labor productivity and a decline in its export to the United States, as we
found in table 4.3, may not be unreasonable at all. From the discussion above
we would like to point to the significant trade-structure shift from the United
States to Europe after the mid-l980s, which is, in fact, in accordance with the
appreciation of the NT dollar and industrial restructuring in Taiwan. To explore
this issue more carefully, we shall now turn to the model of Taiwan’s trade with
Europe in table 4.4.
In table 4.4 we present our empirical results for international trade between
Taiwan and Europe. From equations (1) and (2) of this table, we see that Taiwan’s income level is the most important factor in determining Taiwan’s total
import value from Europe. Furthermore, our empirical results also confirm that
an appreciation in the NT dollar will also increase Taiwan’s imports from Europe. However some possible negative effects also exist. From equations (1)
and (2) we also find that an increase in Taiwan’s productivity relative to that of
the European countries will lead initially to an increase in Taiwan’s imports
from Europe, but eventually to a decline in such imports. As for Taiwanese
exports to Europe, equation (3) in table 4.4 shows that an appreciation in the
NT dollar against the U.S. dollar will induce Taiwanese exports to Europe in
the initial period. This is likely due to the depreciation of the NT dollar relative
to the German mark. As for the relative productivity factor between Taiwan
and the European countries, equation (3) suggests that an increase in Taiwan’s
productivity might induce more Taiwanese exports to Europe (the t-statistic for
WAGE1 is 1.77). However, the Durbin-Watson (D-W) statistic for equation (3)
is still too weak for us to make a strong assertion. In equation (4) we present
the empirical results for Taiwanese exports to Europe without correcting for
serial correlation. Again, we do find empirical evidence that increased Taiwanese productivity has enhanced Taiwan’s diversification to the European market.
However the poor D-W statistic keeps us from making any further arguments.
Perhaps the basic problem in identifying such a trade structure change is that
the relevant change may have occurred only in recent years, too recent to undergo rigorous statistical testing.
In this section of the paper we adopted quarterly data from 1972 to 1990 to
examine how a fluctuation in the NT dol1arKJ.S. dollar exchange rate affects
97
The Effects of NT Dollar Variations on Taiwan’s Trade Flows
Table 4.4
CONSTANT
INCOME
UST
USTl
UST2
Determination of Taiwan’s Total Export to (TEXE) and Import from
(TIME) Europe (absolute t-statistics)
-486.87
(2.59)**
30.63
(6.01)***
2.45 E-4
(2.52)**
- 1.99 E-4
(1.82)*
1.56 E-4
(1.69)
UST3
WAGE
WAGE1
WAGE2
741.30
(3.14)***
-115.55
(0.52)
-769.77
(3.37)***
WAGE3
Q1
Q2
43
T
82
D-W
N
-32.25
(13)
20.44
(0.99)
18.09
(0.94)
-0.77
(0.45)
0.97
1.99
78
-545.08
(2.62)**
29.72
(5.35)***
2.42 E-4
(2.10)**
- I .92 E-4
( 1.74)
6.58 E-3
(0.59)
1.15 E-4
(1.01)
690.26
(2.41)**
-346.89
(1.26)
-796.82
(3.09)***
156.16
(0.57)
-28.11
(1.34)
29.33
(1.33)
27.34
(1.32)
-0.34
(0.17)
0.97
1.99
78
-
1100.48
(2.18)**
0.07
(0.31)
2.33 E-4
(2.61)***
1.02 E-4
(1.17)
1.32 E-3
(0.15)
157.94
(0.62)
559.51
(1.77)*
236.05
(0.94)
-26.40
(l.81)*
- 16.67
(1.01)
7.32
(0.52)
15.84
.w
(1
0.49
1S O
78
- 1644.43
(7.63)***
0.37
(3.85)***
6.32 E-4
(4.91)***
-5.09 E-3
(0.31)
2.96 E-3
(0.17)
-1.71 E-4
( 1.07)
210.52
(0.44)
825.53
(1.72)*
814.55
(2.07)**
802.50
(1.91)**
-19.18
(0.62)
-5.35
(0.17)
7.87
(0.25)
- 10.32
(2.02)**
0.98
0.88
78
Notes: Variable INCOME in TIME equations is Taiwan’s GNP level, in TEXE equations, the
weighted average GNP of major European countries. Variable WAGE is relative real wages (productivities) between Taiwan and weighted average of major European countries.
*Significant at the 10 percent level.
**Significant at the 5 percent level.
***Significant at the 1 percent level.
Taiwan’s overall international trade, Taiwan’s trade with the United States, and
Taiwan’s trade with European countries. Our empirical results suggest that
among various factors affecting international trade, changes in the importing
countries’ income level is one of the most important in determining Taiwanese
exports. Similarly, changes in Taiwan’s own income level will also significantly
98
San Gee
affect Taiwan’s import value. Besides income levels, this study also confirms
that an appreciation in the NT dollar will increase Taiwan’s imports from the
United States and Europe as well as Taiwan’s overall import value. However,
there is a time lag of roughly four quarters for such a stimulation.
Contrary to popular perceptions, we find that an increase in Taiwan’s productivity relative to that of importing countries will not have any significant effect
on Taiwan’s overall level of exports. In addition, this increase in Taiwan’s relative productivity may actually reduce Taiwan’s exports to the United States.
One possible explanation for such a phenomenon is that as Taiwan’s productivity improves relative to that of the United States, Taiwanese exporters are more
likely and more able to diversify their markets away from the United States to
European countries, either because of rising protectionism starting in the midto late 1980s in the United States, or because of the depreciation of the NT
dollar relative to the German mark, or because of both. As a result, we observe
that the share of the U.S. market held by Taiwan’s total exports dropped from
48 percent in 1985 to 29 percent in 1991, whereas that share of the European
market increased from 10 percent in 1985 to 18 percent in 1991. In this study
we also found some empirical evidence for our argument that an increase in
Taiwan’s productivity relative to that of the European countries will increase
Taiwanese exports to those countries. However, because these structural
changes have been observed in more recent years, further empirical testing
using a longer series of data is needed in order to identify the cause for such
changes.
Generally speaking, the role of the NT dol1arKJ.S. dollar exchange rate is
critical to Taiwan’s export performance. We find that an appreciation in the NT
dollar will adversely affect Taiwan’s exports to the United States but that it
may have a less adverse affect on Taiwan’s exports to Europe. Furthermore, our
empirical results show that as the NT dollar appreciates against the U.S. dollar
Taiwan’s exports are likely to increase, particularly in the initial period of NT
dollar appreciation. This is primarily because Taiwanese exporters are likely
to advance their delivery ahead of the original schedule in order to minimize
their loss from a continuing stronger NT dollar. In the above study, we also
found two contradictory results as to the effect of NT dollar appreciation on
Taiwan’s total exports: one empirical model shows that the vast appreciation of
the NT dollar may not necessarily have any significant effect on Taiwan’s overall export performance, and the factors discussed above could explain such
phenomena. On the other hand, our empirical study does find that NT dollar
appreciation can adversely affect Taiwan’s overall export performance. To reconcile these differences, further study through differential approaches to the
effect of exchange rates on compositional change in Taiwan’s overall trade activity is warranted. We turn to this in the next section.
99
The Effects of NT Dollar Variations on Taiwan’s Trade Flows
4.3 The Real Effective Exchange Rate and Taiwan’s External Trade
In the sections above, we utilized nominal exchange rates to evaluate Taiwan’s external trade. The direct advantages of using nominal rates are twofold:
namely, the U S . dollar is the most commonly used currency for international
trade, and the adoption of nominal exchange rates between the NT dollar and
the U.S. dollar merely reflects this fact. Second, the NT dollar has appreciated
considerably against the U.S. dollar since the mid-l980s, and the adoption of
nominal exchange rates will thus be able to capture the impact of this appreciation. However, as we discussed in the previous section, both Krueger (1978)
and Himarios (1985) argued that it is more appropriate to use the real exchange
rate rather than nominal rates to examine the effect of exchange rate variation
on trade balance. Furthermore, it is important to note that other major currencies such as the Japanese yen, French franc, and German mark also appreciated
considerably against the U.S. dollar in the mid- to late 1980s. In addition, the
relative price changes in major trading countries are important in determining
comparative advantage for Taiwan’s international trade. To properly take all of
these factors into consideration, we must evaluate Taiwan’s currency on its real
effective exchange rate base rather than its nominal value. For this, we shall
now try to calculate Taiwan’s real effective exchange rates (REER) and try to
examine how they will affect Taiwan’s external trade.
4.3,l
The Calculation of the Real Effective Exchange Rates
To properly evaluate the real value of the NT dollar, we calculate its real
effective exchange rates (REER) from its nominal effective exchange rates
(NEER). The formulas for the relevant calculations are:
NEER = nominal effective exchange rate for the NT dollar,
RT.,l = exchange rates between one NT dollar and country j S currency at
period t,
RT,o = exchange rate between one NT dollar and country j S currency at
period 0, and
= weights for country j at period f.
w,.,
real effective exchange rate of NT dollars,
= wholesale price index of country j at period t,
p 1.0
. = wholesale price index of country j at period 0,
PT.1 = wholesale price index of Taiwan (T) at period t,and
p.0 = wholesale price index of Taiwan (T) at period 0.
REER
=
100
SanGee
One may use either Taiwan’s bilateral trade value or Taiwan’s average export
value with countryj as the weight for countryj in the calculation of NEER and
REER. The formula for bilateral-trade weights is
WJ,l(bilateral trade) =
xT~
J=
1
+
MT,
+
3
MTJ)
where XTj = Taiwan’s seasonal export value to country j ,
MTrj= Taiwan’s seasonal import value from country j .
The formula for average-export-value weights is
W,,,(average export value) = 0.5 *
5+ 0.5 *
-
t ( x , - MT,i
,=I
where X j = country j’s seasonal total export value.
It is important to note that in calculating the above NT dollar exchange rate
indexes, we have adopted the volume quotation method by calculating the
value of country j’s currency for one NT dollar. Therefore, if the REER is
greater (smaller) than unity, it suggests that the NT dollar is overvalued (undervalued) and that the NT dollar should be devalued (appreciated) so that the
real value of the NT dollar is comparable to that in the base period.
In this study we have chosen 1979 and 1980-82 as the two base periods for
comparison. The underlying reasons for selecting these two periods are: first,
beginning in 1979 Taiwan adopted a floating exchange rate system, and the
resulting exchange rate levels are therefore closer to market equilibrium levels.
Second, Taiwan’s trade surplus in 1980 was only $7.7 million (U.S.), the closest
to actual balance over the entire period of the 1970s and 1980s. Consequently,
the period 1979-82 has already been adopted by the Central Bank, as well as
by many other economic and financial institutions in Taiwan, as the base period
for calculating effective exchange rates for the NT dollar.
The trading nations to be included in our calculation are the United States,
the United Kingdom, France, (West) Germany, Italy, the Netherlands, Canada,
Japan, Australia, Korea, Singapore, Malaysia, Indonesia, Thailand, and Hong
Kong. The 15 countrieshreas above accounted for 86 percent of Taiwan’s total
exports in 1991 and 84 percent over the period 1976-9 1. They also accounted
for 83 percent of Taiwan’s total trade value in 1991 and 81 percent over the
period 1976-9 1.
Now, we first present our calculations of REERs in table 4.5. From this table
it is clear that almost all trade balance statistics for TBUS, TBT, and TB15
are positive over the period 1975-90, which suggests that Taiwan enjoyed a
consistent trade surplus over this period. Naturally, the relevant question is
then, Does the level of the NT dollar have anything to do with the trade balance? From this table, we see that most of the RE802A statistics are smaller
than our base period (198O:l-1982:4) level of 100 except in 1985:l and
Real Effective Exchange Rates for the NT Dollar and Taiwan’s Trade Balance and
Foreign Exchange Reserve (FER) Statistics, 1975-90
Table 4.5
Real Effective Exchange Rate
Trade Balance
Year
and
Quarter
Rate”
RE802A
RE802B
RE79A
RE79B
1975 1
2
3
4
1976 1
2
3
4
1977 1
2
3
4
1978 1
2
3
4
1979 1
2
3
4
1980 1
2
3
4
38.00
38.00
38.00
38.00
38.00
38.00
38.00
38.00
38.00
38.00
38.00
38.00
38.00
38.00
36.00
36.00
35.95
36.10
36.03
36.03
36.06
36.01
35.93
36.01
95.39
97.37
99.48
98.50
97.96
97.94
96.89
96.01
94.47
93.30
92.30
89.40
86.48
86.15
88.96
89.72
90.38
92.11
92.09
93.29
96.41
98.40
97.03
99.61
99.71
101.92
102.91
101.81
101.17
100.73
99.33
98.86
97.01
95.66
94.62
91.23
88.70
87.59
89.71
91.37
92.97
95.37
95.85
98.18
101.18
102.11
100.39
101.66
103.23
105.36
107.64
106.59
105.87
105.85
104.70
103.76
102.08
100.81
99.74
96.61
93.54
93.18
96.23
97.05
97.89
99.77
99.74
101.04
104.31
106.47
104.99
107.78
104.05
106.36
107.40
106.25
105.30
104.84
103.39
102.89
100.63
99.23
98.15
94.63
92.23
91.07
93.27
95.00
96.87
99.38
99.87
102.30
105.42
106.38
104.59
105.91
(continued)
TBUSb
-
-
239
266
422
314
239
363
473
597
493
685
789
667
500
54 1
689
539
45 1
508
524
604
TBTb
-185
-93
- 179
-186
66
72
239
191
47
87
317
400
178
484
587
41 1
25 1
254
548
277
26
-246
29
327
~
TE3lSb
-
153
163
397
284
I26
138
372
525
277
505
663
568
381
335
696
442
414
254
303
712
FER‘
1.073
1.061
1.164
1.074
1.004
1.301
1.536
1.516
1.259
1.320
1.351
1.345
1.329
1.358
1.447
1.406
1.444
1.448
1.455
1.467
1.509
1.489
1.836
2.205
Table 4.5
(continued)
Year
and
Quarter
Real Effective Exchange Rate
Trade Balance
Rate”
RE802A
RE802B
RE79A
RE79B
TBUSb
TBTb
TBISh
FER’
1981 1
2
3
4
1982 1
2
3
4
1983 1
2
3
4
1984 1
2
3
4
1985 1
2
3
4
1986 1
2
36.35
36.36
37.91
37.84
38.13
39.39
39.87
39.91
40.04
40.20
40.19
40.27
39.92
39.63
39.18
39.47
39.54
40.00
40.40
39.83
38.77
38.09
100.81
102.74
102.01
98.19
97.60
95.81
95.42
95.79
92.94
94.23
95.93
94.92
94.93
95.75
98.31
98.5 1
100.52
96.17
92.43
89.38
87.87
88.45
101.26
102.49
101.27
98.41
97.78
96.11
95.58
95.87
92.67
93.81
94.98
93.50
93.42
94.24
96.20
95.92
97.10
94.05
9 1.30
88.7 1
87.76
88.53
108.52
110.60
109.81
105.70
105.00
103.08
102.66
103.06
99.85
101.24
103.06
101.98
101.76
102.64
105.38
105.60
107.92
103.25
99.23
95.97
94.89
95.52
105.22
106.50
105.23
102.26
101.59
99.85
99.30
99.61
96.00
97.18
98.40
96.87
96.55
97.40
99.43
99.14
100.38
97.23
94.39
91.71
91.07
91.87
309
683
1,303
1,104
702
1,160
1,150
1,184
1,031
1,795
2,044
1,818
2,001
2,843
2,689
2,293
2,020
2,723
2,790
2,493
2,781
3,380
-514
36
1,131
758
472
674
1,128
1,042
490
1,839
1,682
824
1,669
2,552
2,396
1,880
2,123
2,734
2,938
2,829
3,058
3,820
-21
516
1,248
1,217
787
914
1,048
1,287
98 1
1,827
2,048
1,484
2,083
2,875
2,637
2,267
2,461
3,006
3,130
3,002
3,208
3,599
2.665
3.339
5.216
7.235
7.71 1
7.525
7.897
8.532
9.585
10.443
11.446
11.859
12.910
13.765
14.571
15.664
17.614
18.557
20.001
22.556
26.027
30.851
3
4
1987 I
2
3
4
1988 1
2
3
4
1989 1
2
3
4
1990 1
2
3
4
-
36.72
36.29
34.26
3 1.08
30.09
28.55
28.64
28.89
28.93
28.17
27.17
25.91
25.60
27.17
26.41
27.20
27.30
27.11
89.29
89.84
90.59
95.30
97.61
97.98
94.97
94.18
97.14
96.55
101.32
105.30
104.76
96.11
96.82
94.22
92.29
85.34
89.9 1
90.93
92.31
96.86
99.06
100.03
96.64
95.63
97.60
97.37
101.64
105.48
105.27
97.42
99.86
98.02
96.18
88.56
96.42
97.02
98.06
103.15
105.65
106.05
102.71
101.87
105.06
104.43
109.46
113.75
113.17
103.82
104.91
102.10
100.01
92.48
93.30
94.36
96.18
100.91
103.21
104.22
100.92
99.86
101.91
101.68
106.24
110.26
110.03
101.82
104.62
102.70
100.76
92.79
3,720
3,710
3,625
4,312
4,555
3,539
1,965
2,111
3,306
3,078
2,446
3,104
3,521
2,962
1,870
2,172
2,920
2,173
4,209
4,597
4.23 1
4,889
5,772
3,762
1,341
3,220
3,082
3,351
2,773
3,449
4,288
3,528
1,811
3,130
4,361
3,196
3,977
4,215
4,012
4,610
5,602
4,118
1,938
3,079
3,201
3,423
2,785
3,799
4,456
3,705
2,200
3,180
4,524
3,688
38.205
46.310
54.505
60.717
64.903
76.748
74.756
70.326
69.005
73.897
75.156
74.348
73.801
73.224
69.761
63.631
68.090
72.441
Notes: In this table, we have reported four different REERs, which are calculated based on four different assumptions,
namely, RE802A-base period is 1980-82 and weights are average export values, RE802B-base period is 1980-82
and weights are total bilateral trade values, RE79A-base period is 1979 and weights are average export values, and
RE79B-base period is 1979 and weights are total bilateral trade values.
Trade balance columns report TBUS-Taiwan’s trade balance with the United States, TBT-Taiwan’s total trade
balance, and TB15-Taiwan’s trade balance with the 15 major trading countries that we included in the REER calculation. These seasonal trade balance statistics are defined as total seasonal exports minus the corresponding seasonal
imports. Therefore, a positive balance is a trade surplus for Taiwan.
Taiwan’s foreign exchange reserve statistics are reported as FER.
”Nominal exchange rate between 1 U.S. dollar and NT dollar.
million of US. dollars.
cIn billion U.S. dollars.
104
SanGee
1983:3-1989:3. This clearly suggests that the NT dollar was undervalued most
of the time, compared to the 1980-82 base period level, and should have been
appreciated in order to restore the trade balance situation. Contrary to those for
RE802A, however, the statistics of RE79A suggest that the NT was overvalued,
especially during the period 1979:4-1985:2, because most of the RE79A statistics are greater than the base level of 100 in 1979; therefore the RE79A
index suggests, although not conclusively, that the NT dollar should have been
depreciated in order to restore the trade balance. As for the remaining two
real exchange rate indexes-RE802B and RE79B, which utilize bilateral trade
values, not merely export values, as weights to calculate the real value of the
NT dollar-the statistics in table 4.5 show that these two indexes are perhaps
more reliable and more reasonable than RE802A and RE79A, discussed above.
One can see from table 4.5 that both the RE802B and RE79B indexes suggest
that NT dollars were undervalued (the indexes are less than 100) over the period 1982 to early 1987, which is consistent with the rapid growth of the trade
surplus as well as with the accumulation of foreign exchange reserves from the
early to mid-1980s. In particular, both RE802B and RE79B show that around
the first quarter of 1986, REERs of the NT dollar reached an all-time low point
(87.76 for RE802B and 91.07 for RE79B), which suggests that the nominal
exchange rate level of $1 (U.S.) for NT$38.77 in the first quarter of 1986 was
very low. This unbalanced situation persisted, and in the third quarter of 1987
the nominal exchange rate was $1 (US.) for NTS$30.09, while RE802B and
RE79B registered levels of 99.06 and 103.21, respectively. As a result, all the
trade balance statistics in table 4.5 reached high points at that time, namely,
$4,555, $5,772, and $5,602 million (U.S.) for TBUS, TBT, and TB15, respectively. Furthermore, the foreign exchange reserve (FER) also increased dramatically from $9.585 billion (U.S.) in the first quarter of 1983 to $64.903 billion
(U.S.) in the third quarter of 1987. Obviously, as suggested by both the
RE802B and RE79B indexes, the huge trade imbalance and vast accumulation
of foreign exchange reserves experienced by Taiwan during the critical 198087 period were really due to the consistent undervaluation of the NT dollar. To
dramatically cut the enormous accumulation of foreign exchange reserves, the
NT dollar began to appreciate sharply from 1987:l with a rate of $1 (U.S.) for
NT$34.26 to $1 (U.S.) for NT$25.60 in 1989:3-a 25.27 percent appreciation
within two years. As a result, not only did the RE802B and RE79B indexes
increase dramatically, but the accumulation of foreign exchange reserves
slowed.
In the discussion above, we found that RE802B and RE79B are more appropriate in explaining the trade balance and foreign exchange reserve problem in
Taiwan than the other REERs calculated. To examine the performance of the
four different REER indexes more carefully, one can actually compare the correlation coefficients between each of them and the trade balance statistics. As
we argued before, when an REER index increases above the base period level
of 100, it implies that the NT dollar is overvalued relative to the base period;
105
The Effects of NT Dollar Variations on Taiwan’s Trade Flows
this will reduce exports, encourage imports, and therefore worsen Taiwan’s
trade balance. In contrast, however, when an REER index declines below the
base period level of 100 the NT dollar is undervalued relative to the base penod; this will encourage exports, discourage imports, and subsequently improve Taiwan’s trade balance. Clearly, the correlation coefficient between Taiwan’s trade balance and the REER indexes, as defined above, should be
negative.
In table 4.6 we report correlation coefficients between different trade balance statistics and the four REER statistics. These results show that RE802B
generally has a negative relationship with trade balance statistics, which is in
accordance with our argument above. Furthermore, RE802B has larger correlation coefficients when we lag it by two (RE802(-2)) to four (RE803B(-4))
quarters. Similarly, we also find sizable correlation coefficients between various trade balance statistics and the RE79B(-2) and RE79B(-4) indexes. In
contrast, however, table 4.6 also clearly shows that the correlation coefficients
between trade balance statistics and RE802A or RE79A are very low. Consequently we may conclude that REER indexes weighted by bilateral trade values
are more capable of illustrating interaction between trade balance statistics and
the real value of the NT dollar.
To examine the relationship between REERs of the NT dollar and Taiwan’s
external trade activities more closely, in table 4.7 we present the regression
results of REER under various definitions and different time lags. For instance,
in equation (1) of table 4.7, the REER variable is represented by RE802A, and
our empirical results show an increase in REER, representing an overvaluation
of the NT dollar. This discouraged Taiwan’s total exports (TEXT) for RE802A,
and REER lagged by two quarters (REER2) is negative and highly significant
Table 4.6
Correlation Coefficients between Taiwan’s Trade Balance Statistics
and Real Effective Exchange Rate (REER) Statistics
Trade Balance Statistics
REER Statistics
TBUS
RE802B
RE802B(-2)
RE802B( -4)
RE79B
RE79B( -2)
RE79B(-4)
RE802A
RE802A(-2)
RE802A(-4)
RE79A
RE79A(-2)
RE79A(-4)
TBT
TB15
-0.02
-0.21
-0.22
-0.02
-0.21
-0.24
-0.12
-0.20
-0.16
-0.11
-0.19
-0.17
-0.02
-0.13
-0.14
-0.01
-0.01
-0.14
0.11
-0.03
0.02
0.11
-0.04
-0.002
-0.001
-0.03
0.07
-0.001
-0.04
0.05
0.07
0.02
0.09
0.08
0.01
0.07
106
Table 4.7
Variable
CONSTANT
INCOME
REER
REERI
REER2
REER3
WAGE
WAGE1
WAGE2
WAGE3
41
42
43
T
R2
D-W
N
SanGee
Real Effective Exchange Rate (REER) and Taiwan’s External Trade
(absolute r-statistics)
(1)
TEXT
(RE802A)
(2)
TIMT
(RE802B)
Equation (REER)
(3)
(4)
TEXUS
TIMUS
(RE79A)
(RE79B)
(5)
TEXE
(RE79A)
(6)
TIME
(RE802B)
-3.11 E-3
-5.69 E-3
- 1.69 E-3 297.05
19.04
-6.29 E-3
(0.77)
(0.07)
(1.30)
(0.45)
(1.30)
(1.29)
21.32
1.71
5.03
45.41
329.08
0.21
(2.53)***
(0.41)
(13.73)***
(4.89)***
(0.83)
(1.67)
100.01
-22.64
5.12
-31.77
-2.46
47.35
(1.50)
(0.78)
(3.92)***
(3.75)***
(1.33)
(1.04)
-26.96
13.69
-5.16
53.32
-1.32
-1.66
(1.20)
(2.11)**
(0.43)
(0.14)
(1.02)
(1.04)
-0.28
-72.01
2.12
11.33
-5.94
-34.31
(2.71)***
(2.87)***
(0.05)
(0.17)
(0.43)
(1.90)*
0.76
-7.74
19.83
48.37
-1.05
-0.26
(0.20)
(0.26)
(1.62)
(1.73)*
(0.30)
(0.02)
1.50 E-3
2.11 E-3
2.44 E-3
1.23 E-3
989.19
-2.63
(0.77)
(1.66)
(3.25)***
(0.58)
(2.76)***
(1.47)
-3.75 E-3
5.29 E-3
3.01
-3.06
1.62 E-3 -215.85
(1.27)
(2.47)***
( 1.48)
(1.70)*
(0.72)
(3.05)***
1.53 E-3 -956.42
705.70
-7.08 E-3
5.17 E-3
71.48
(0.34)
(2.04)**
(3.42)***
(2.62)***
(0.04)
(1.64)
-967.79
346.35
5.28 E-3 -514.38
207.93
1.26 E-3
(0.48)
(0.18)
(0.16)
(1.81)*
(0.68)
(2.38)***
-181.81
-43.06
-488.00
-36.77
-170.84
-35.64
(0.62)
(2.29)**
(3.11)***
(1.27)
(1.22)
(1.84)*
191.75
222.49
- 18.93
32.00
160.39
17.05
(0.39)
(2.14)**
(1.38)
(0.87)
(0.57)
(0.09)
212.83
27.80
175.06
19.67
99.27
2.45
(1.43)
(0.41)
(2.36)**
(0.72)
(0.13)
(0.69)
-2.92
24.58
-89.16
-6.07
10.56
5.33
(0.69)
(0.07)
(0.77)
(3.79)***
(0.69)
(0.16)
0.99
0.96
0.99
0.98
0.99
0.99
1.62
1.84
1.95
1.97
1.84
1.36
78
78
78
78
78
78
Nore: Consult tables 4.1,4.3, and 4.4 for definitions of variables INCOME and WAGE.
*Significant at the 10 percent level.
**Significant at the 5 percent level.
***Significant at the 1 percent level.
(the absolute t-statistic is 2.71). Clearly, the empirical results in equation (1)
reconfirm our previous result that an appreciation of the NT dollar effects Taiwan’s total exports and can actually reduce them. Similarly, for Taiwan’s total
imports (TIMT) model, equation (2) shows that when we use RE802B as the
index for REER we find empirical evidence that an increase in REER, or an
overvaluation of the NT dollar, will encourage Taiwan’s total imports. This is
107
The Effects of NT Dollar Variations on Taiwan’s Trade Flows
quite consistent with our empirical results in table 4.1. In equations (3) and (4)
we examine Taiwan-U.S. trade and our empirical results show that an increase
in RE79A can adversely affect TEXUS, because REER2 is negative and highly
significant, which is consistent with our empirical results in table 4.3. It is
worth noting that in this study we have tried all four REERs but were unable
to find one that had any significant impact on Taiwan’s imports from the United
States. By comparing our results here to those in table 4.3, one can see that
REERs are less sensitive than nominal exchange rates in explaining Taiwan’s
quarterly imports from the United States. In equations (5) and (6) we show the
results of how REER affects Taiwan’s imports from, and exports to, Europe.
We find empirical evidence that REER2 with specification RE79A can adversely affect Taiwan’s exports to Europe (TEXE). However, as in TIMUS
equation (4), we can find no REER index that had any significant effect on
Taiwan’s imports from Europe (TIME). Clearly, when we compare the empirical results in table 4.7 and table 4.4, we see that the nominal exchange rate
between the NT dollar and the U.S. dollar is also more sensitive to changes in
Taiwan’s trade with Europe than are the REERs.
Finally, it is interesting to note that in equation ( I ) of table 4.7 we find new
empirical evidence that an increase in Taiwan’s productivity relative to that of
other countries will enhance Taiwan’s export promotion drive, because WAGE1
and WAGE3 are positive and significant in equation (1). Furthermore, equation
(2) of table 4.7 reconfirms our earlier findings that an increase in Taiwan’s productivity relative to that of other countries enhances Taiwan’s importsubstitution capability, because WAGE2 is negative and highly significant. In
addition, similar to our empirical results in table 4.4, in equation (5) of table
4.7, we find empirical evidence that an increase in Taiwan’s labor productivity
will help local firms promote their sales in Europe, however, the D-W statistic
is still too low to permit us to make a strong assertion. Generally speaking,
when we compare the empirical results in sections 4.2 and 4.3, we may conclude that REER indexes seem to be more capable of affecting and explaining
Taiwan’s overall international trade activities than Taiwan’s bilateral trade activities with a specific country or with a specific region.
4.4 Price-CompetitionIndex and Bilateral ’Ikade between Taiwan and
Foreign Countries
We have seen that REER indexes are less capable of explaining bilateral
trade activities, while the simple nominal exchange rate fails to take into account changes in relative prices. The alternative to REERs for exploring explicitly how changes in exchange rates affect Taiwan’s bilateral trade with a specific
foreign country is the calculation of a price-competition index (PCI) between
the two countries, defined as
108
SanGee
e,,
e,,
=
P,,
=
P,,
=
=
exchange rate between $1 U.S. and NT dollar in period t,
exchange rate between $1 U.S. and country i’s currency in period t,
wholesale price index for Taiwan (the domestic country d ) in period
t, and
wholesale price index for foreign country i in period t.
It is clear from the above formula that the PCI is actually the exchange rate
between one unit of country i’s currency and the NT dollar (edf/eJ deflated
by the relative prices between Taiwan’s wholesale price index and country i’s
wholesale price index (p,,/p,,>.Therefore, one can easily see that when the NT
dollar depreciates with respect to the U S . dollar and/or Taiwan’s wholesale
price index decreases relative to that of foreign country i, this will induce an
increase in the PCI, which suggests stronger competitiveness or an exporting
advantage over foreign country i for Taiwan. In contrast, an appreciation of the
NT dollar with respect to the U.S. dollar and/or a relative increase in Taiwan’s
wholesale price index will lead to a decrease in the PCI, which suggests
weaker competitiveness or an exporting disadvantage compared to foreign
country i. In addition, due to our different definitions of exchange rate, there
is actually a reciprocal relationship between the PCI and REER. As a result,
an increase (decrease) in the PCI implies that the NT dollar is undervalued
(overvalued), which implies improving (worsening) competitiveness for Taiwan over foreign country i.
In the appendixes, we present the relevant PCIs of Taiwan’s 15 major trading
partners included in this study. In this section, however, we shall focus our
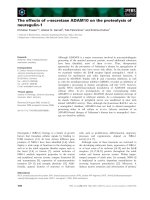
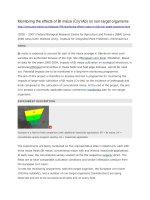
attention on selected results. In figure 4.1 we plot the Taiwan-U.S. PCI statistics against Taiwan’s trading statistics with the United States. From the figure
we can see that during 1980-81, the PCI was substantially lower than 100 and
was accompanied by a moderate trade surplus in favor of Taiwan. However
beginning in 1982, there was a dramatic increase in PCI until mid-1987. It was
during this critical period that a huge trade surplus in favor of Taiwan emerged.
As the NT dollar appreciated dramatically against the U S . dollar from 1987
to 1988, one can also observe a sharp decline in the PCI and in Taiwan’s competitiveness, which in turn led to a significant increase in Taiwan’s imports from
the United States. Although the PCI index after the end of 1988 is still substantially lower than the base period (1980-82) level of 100, its trend is unambiguously upward-sloping, which is certainly consistent with the continuously
growing trade surplus in favor of Taiwan after 1988.
One major result that we obtained in the previous section is that there was a
tremendous shift in Taiwan’s trade composition away from the U.S. to the European market after the mid-1980s. In this section we find that an increase in
PCI toward the European market could be one of the important factors that
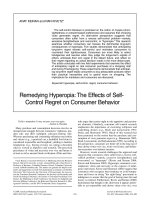
contributed to this structural shift. In figure 4.2, we plot PCIs for Taiwan and
Germany, Taiwan and France, Taiwan and the United Kingdom, and Taiwan
and the Netherlands. From this figure, it is clear that these PCIs after mid-
109
The Effects of NT Dollar Variations on Taiwan's Trade Flows
120
110
-
g
\
100
90
80 I 1 1 1 1 1 1 1 1 I 1 I I l I 1~1 1 1 1 1 1 1 1 1 1 1 1 1 1 1 1 1 1 1 1 l ~ l I 1 I l I l I 1 I 1I I I I I I
76 77 78 79 80 81 82 83 84 85 86 87 88 89 90
YEAR
YEAR
Fig. 4.1 Taiwan-U.S. price competition index (PCI) and trade statistics of
Taiwan's exports to (TEXUS) and imports from (TIMUS) the United States
(1976: 1-1990~4)
110
SanGee
8oL
7085
u
86
--
Germany
87
+ France
88
* UK
89
+
90
Netherlands
YEAR
Fig. 4.2 Price competition indexes (PCIs) between Taiwan and its major
European trading partners (1985:1-1990:3)
1985 are all substantially greater than 100, which implies stronger Taiwanese
competitiveness, and this naturally led to greater Taiwanese emphasis on the
European market. As for the basic reasons for an increase in the PCI toward
European countries after the mid-l980s, one can examine the data and find
that the wholesale price indexes for France, the United Kingdom, Germany,
and the Netherlands increased by 7.1, 28.4, 1.9, and 1.7 percent, respectively,
from early 1986 to late 1990, while Taiwan actually experienced deflation, and
its wholesale price index declined by 10.1 percent over the same period. In
addition, we find that the German mark, Dutch guilder, French franc, and British pound appreciated by 36.03, 36.08, 29.92, and 25.98 percent, respectively,
against the U.S. dollar from early 1986 to late 1990, while the NT dollar also
appreciated against the U.S. dollar by 30.07 percent over the same period. By
taking these price and exchange rate factors into consideration, it is clear that
Taiwan’s competitiveness over European countries after the mid- 1980s may
have been the result of slowed growth in its wholesale prices relative to those
of major European countries, or of a lesser degree of currency appreciation
against the U.S. dollar, or both. It is not surprising that this increase in Taiwan’s
competitiveness with European countries has already translated into a sizable
increase in the European share of Taiwan’s total exports as we saw in table 4.2.
111
The Effects of NT Dollar Variations on Taiwan’s Trade Flows
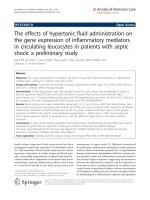
One phenomenon that the PCI index fails to explain is bilateral trade between Taiwan and Japan. From figure 4.3, we see that after the second quarter
of 1985 the PCI increased sharply in favor of Taiwan. However this increase in
Taiwan’s competitiveness did not help to improve the long-standing trade deficit problem between Taiwan and Japan. On the contrary, the trade deficit between Taiwan and Japan has been widening considerably since 1989. Actually,
when one examines figure 4.3 more closely, one can see that as the PCI increases during the period from mid-1985 to early 1988, there is also a considerable increase in Taiwan’s exports to Japan. However, Taiwan’s imports from
Japan also increased at an even faster pace during the same period, resulting in
a huge trade deficit problem for Taiwan. The trade imbalance problem between
Taiwan and Japan may be beyond factors such as exchange rates and relative
prices, which constitute the essence of the PCI. What then are the relevant
factors that can enable us to explain the growing trade imbalance between Taiwan and Japan? By examining figures 4.1 and 4.3 simultaneously, one can
easily see that there is a great similarity between the variations of TEXUS and
the variations of TIMJ. In fact, by calculating the correlation coefficient between TEXUS and TIMJ, we find that it is as high as 0.91125. Furthermore,
the correlation coefficients between TIMJ and Taiwan’s exports to (West) Germany, France, and the Netherlands are 0.971, 0.986, and 0.983, respectively.
Clearly, there is a very close relationship between Taiwan’s exports to the U.S.
and to Europe and Taiwan’s imports from Japan. By examining the relevant
customs statistics during this period, we see that machinery, parts, and intermediate industrial products are Taiwan’s major import items from Japan. Therefore, the empirical results above seem to suggest that in addition to foreign
exchange and other relevant factors, such as labor productivity, Taiwan’s international edge is built on its outward sourcing of Japanese industrial equipment
and intermediate industrial products. As a result, Taiwan’s huge trade deficit
with Japan goes hand in hand with Taiwan’s growing trade surplus with the
West.
Finally, it is interesting to note that the PCIs between Taiwan and Korea
and such major Association of Southeast Asian Nations (ASEAN) countries
as Thailand, Malaysia, Singapore, and Indonesia worsened substantially after
the middle of the 1980s. One of the major reasons for the worsening of PCIs
for Taiwan toward these countries is exchange rates. Statistics show that both
the Korean won and Thai baht appreciated against the U.S. dollar by 19.39
and 5.24 percent, respectively, between early 1986 and late 1990, while the
currencies of Malaysia, Indonesia, and Singapore actually depreciated against
the U.S. dollar by about 8.63, 66.16, and 14.79 percent, respectively, for the
same period. Clearly, these Asian currency changes are no comparison to the
NT dollar’s 30.07 percent appreciation against the U.S. dollar, which thus led
inevitably to a sharp decline in PCI for Taiwan toward these Asian markets.
112
SanGee
130
120
-
0
110
100
90 1 1 1 1 1 1 1 1 1 1 1 1 1 1 l l I I I I I I I l I 1 , I l ~I I 1 8 1 1 1 1 I 1 1 1 1 1 I I 1 1 I I I 1 1 I I l l
76 77 78 79 80 81 82 83 84 85 86 87 88 89 90
YEAR
76 77 78 79 80 81 82 83 84 85 86 87 88 89 90
+TEXJ
“-TlMJ
YEAR
Fig. 4.3 Taiwan-Japan price competition index (PCI) and statistics of Taiwan’s
exports to (TEXJ) and imports from (TIMJ) Japan (1976:l-1990:4)