Solution manual engineering economic analysis 9th edition ch13
Bạn đang xem bản rút gọn của tài liệu. Xem và tải ngay bản đầy đủ của tài liệu tại đây (108.15 KB, 23 trang )
Chapter 13: Replacement Analysis
13-1
For the Replacement Analysis Decision Map, the appropriate analysis method is a function
of the cash flows and assumptions made regarding the defender and challenger assets.
Thus, the answer would be the last it depends on the data and the assumptions
13-2
The replacement decision is a function of both the defender and the challenger.
The statement is false.
13-3
The book value of the equipment describes past actions or a sunk cost situation. The
answer is the last it should be ignored in this before-tax analysis.
13-4
With no resale value, and maintenance costs that are expected to be higher in the future,
EUAC would be a minimum for one year. (This is such a common situation that the early
versions of the MAPI replacement analysis model were based on a one year remaining life
for the defender.)
The answer is one year.
13-5
The EUAC of installed cost will decline as the service life increases. The EUAC of
maintenance is constant. Thus total EUAC is declining over time.
Answer: For minimum EUAC, keep the bottling machine indefinitely.
13-6
The value to use is the present market value of the defender equipment. (The book
indicates that trade-in value may be purposely inflated as a selling strategy, hence it may or
may not represent market value.)
13-7
(a)
Expected good performance, productivity, energy efficiency, safety, long service life.
Retraining in operation and maintenance may be required. High comfort of
operation. High purchase price. May not be immediately available. Sales taxes to
be paid. Can be depreciated. Supplier warranty and spare parts backup available.
(b)
All as in (a) except for lower price and probably faster delivery.
(c)
All as in (a) except for still lower cost, lost production during the rebuild period, and
that the rebuild costs can be expensed, at least partially. No sales tax applies.
(d)
Performance and productivity may not be as good as in option (c). Retraining in
operation and maintenance is not required. Production will be lost during the
rebuilding period. Cost may be substantially lower than in previous options. The
rebuild costs can be expensed. No sales tax applies.
(e)
Performance, productivity, service life, energy efficiency, safety, reliability may be
significantly lower than in the other options. Retraining in operation and
maintenance may be required if the new unit is different from the previous one. Cost
may be only 20-50% of the new equipment. Immediate delivery is a possibility. The
sales tax applies. Equipment can be depreciated.
13-8
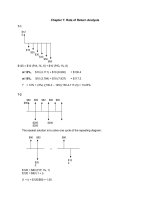
Looking at Figure 13-1: For this problem marginal cost data is available, and is not strictly
increasing. This would lead to the use of Replacement Analysis Technique #2. In this case
we compute the minimum cost life of the defender and compare the EUAC at that life
against the EUAC of the best available challenger. We chose the options with the smallest
EUAC.
13-9
EUAC of Capital Recovery
In this situation P = S = $15,000
So EUAC of Capital Recovery = $15,000 (0.15) = $2,250 for all useful lives.
EUAC of Maintenance
For a 1-year useful life
$2,000
$500
EUAC = $2,000 (1 + 0.15)1 + $500 = $2,800
For a 2-year useful life
$2,000
$1,000
$500
A
FWyr 2
A
= $2,000 (F/P, 15%, 2) + $500 (F/P, 15%, 1) + $1,000
= $4,220
A = $4,220 (A/F, 15%, 2)
EUAC
=A
= $1,963
= $1,963
For 3-year useful life
$2,000
$1,500
$1,000
$500
A
FWyr 3
A
EUAC
A
A
= $2,000 (F/P, 15%, 3) + $500 (F/P, 15%, 2) + $1,000 (F/P, 15%, 1)
+ 1,500
= $6,353
= $6,353 (A/F, 15%, 3)
= $1,829
=A
= $1,829
For a 4-year useful life
$2,000
$2,000
$1,500
$1,000
$500
A
FWyr 4
A
A
A
= $2,000 (F/P, 15%, 4) + $500 (P/G, 15%, 5) (F/P, 15%, 5)
= $9,305
A = $9,305 (A/F, 15%, 4) = $1,864
EUAC = A = $1,864
Alternate computation of maintenance in any year N:
EUACN = A = $2,000 (A/P, 15%, N) + $500 + $500 (A/G, 15%, N)
(a) Total EUAC
= $2,250 + EUAC of Maintenance
Therefore, to minimize Total EUAC, choose the alternative with minimum EUAC of
maintenance.
Economical life = 3 years
(b) The stainless steel tank will always be compared with the best available replacement
(the challenger). If the challenger is superior, then the defender tank probably will be
replaced.
It will cost a substantial amount of money to remove the existing tank from the plant, sell
it to someone else, and then buy and install another one. As a practical matter, it seems
unlikely that this will be economical.
13-10
Year
0
1
2
3
Salvage Value
P = $10,000
$3,000
$3,500
$4,000
Maintenance
$300
$300
$300
Year
4
5
6
7
Salvage Value
$4,500
$5,000
$5,500
$6,000
Maintenance
$600
$1,200
$2,400
$4,800
EUAC of Maintenance
EUAC1
EUAC4
EUAC5
EUAC6
EUAC7
= EUAC2
= EUAC3
= $300
= $300 + $300 (A/F, 15%, 4) = $360
= $300 + [$300 (F/P, 15%, 1) + $900] (A/F, 15%, 5) = $485
= $300 + [$300 (F/P, 15%, 2) + $900 (F/P, 15%, 1)
+ $2,100] (A/F, 15%, 6)
= $703
= $300 + [$300 (F/P, 15%, 3) + $900 (F/P, 15%, 2)
+ $2,100 (F/P, 15%, 1) + $4,500] (A/F, 15%, 7)
= $1,074
EUAC of Installed Cost
Year
(P – S) (A/P, i%, n) + (S) (i)
1
2
3
4
5
6
7
($10,000 - $3,000) (A/P, 15%, 1) + $3,000 (0.15)
($10,000 - $3,500) (A/P, 15%, 2) + $3,500 (0.15)
($10,000 - $4,000) (A/P, 15%, 3) + $4,000 (0.15)
($10,000 - $4,500) (A/P, 15%, 4) + $4,500 (0.15)
($10,000 - $5,000) (A/P, 15%, 5) + $5,000 (0.15)
($10,000 - $5,500) (A/P, 15%, 6) + $5,500 (0.15)
($10,000 - $6,000) (A/P, 15%, 7) + $6,000 (0.15)
= EUAC of
Installed Cost
= $8,500
= $4,523
= $3,228
= $2,602
= $2,242
= $2,014
= $1,862
Year
1
EUAC of Installed
Cost +
$8,500
EUAC of
Maintenance
$300
= Total
EUAC
= $8,800
2
$4,523
$300
= $4,823
3
$3,228
$300
= $3,528
4
$2,602
$360
= $2,962
5
$2,242
$485
= $2,727
6
$2,014
$703
= $2,717
7
$1,862
$1,074
= $2,936
The Economical Life is 6 years because this life has the smallest total EUAC.
13-11
For various lives, determine the EUAC for the challenger assuming it is retired at the end of
the period. The best useful life will be the one in which EUAC is a minimum.
Useful Life- 1 year
$12,000
EUAC = $12,000 (F/P, 10%, 1) = $13,200
Useful Life- 2 years
$12,000
EUAC = $12,000 (A/P, 10%, 2) = $6,914
Useful Life- 3 years
$12,000
EUAC = $12,000 (A/P, 10%, 3) = $4,825
Useful Life- 4 years
$12,000
$2,000 maintenance
EUAC = $12,000 (A/P, 10%, 4) + $2,000 (A/F, 10%, 4)
= $12,000 (0.3155) + $2,000 (0.2155)
= $4,217
Useful Life- 5 years
$12,000
$2,000 maintenance
EUAC = $12,000 (A/P, 10%, 5) + [$2,000 (1 + (F/P, 10%, 1)] (A/F, 10%, 5)
= $12,000 (0.2638) + [$2,000 (1 + (1.100)] (0.1638)
= $3,854
Useful Life- 6 years
$12,000
$2,000 $2,000 $4,500 maintenance
EUAC = [$12,000 (F/P, 10%, 5) + $2,000 (F/A, 10%, 3) + $2,500](A/F, 10%, 6)
= [$12,000 (1.772) + $2,000 (3.310) + $2,500](0.1296)
= $3,938
Summary
Useful Life
1 yr.
2 yr.
3 yr.
4 yr.
5 yr.
6 yr.
EUAC
$13,200
$6,914
$4,825
$4,217
$3,854 Best Useful Life is 5 years
$3,938
13-12
First Cost = $1,050,000
Salvage Value
= $225,000
Maintenance & Operating Cost = $235,000
Maintenance & Operating Gradient
= $75,000
MARR
= 10%
EUAB – EAUC
= $1,050,000 (A/P, 10%, n) + $225,000 (A/F, 10%, n)
- $235,000 - $75,000 (A/G, 10%, n)
Try n = 4 years:
EUAB – EAUC
= $331,275 + $48,488 - $235,000 - $103,575 = -$621,362
Try n = 5 years:
EUAB – EUAC
= -$276,990 + $36,855 - $235,000 - $135,750 = -$610,885
Try n = 6 years:
EUAB – EUAC
= -$241,080 + $29,160 - $235,000 - $166,800 = -$613,720
Thus, year 5 has the minimum EUAB – EUAC, hence the most economic life is 5 years.
13-13
A tabulation of the decline in resale value plus the maintenance is needed to solve the
problem.
Age
Value of Car
New
1 yr
2
3
4
5
6
7
$11,200
$8,400
$6,300
$4,725
$4,016
$3,414
$2,902
$2,466
Decline in
Value for
the Year
Maintenance for
the Year
Sum of Decline in
Value +
Maintenance
$2,800
$2,100
$1,575
$709
$602
$512
$536
$50
$150
$180
$200
$300
$390
$500
$2,850
$2,250
$1,755
$909
$902
$902
$936
From the table it appears that minimum cost would result from buying a 3-year-old car and
keeping it for three years.
13-14
Find: NPWOVERHAUL and NPWREPLACE
Note: All costs which occur before today are sunk costs and are irrelevant.
NPWOVERHAUL
NPWREPLACE
= -$1,800 - $800 (P/A, 5%, 2)
= -$1,800 - $800 (1.859) = -$3,287
= +$1,500 – ($2,500 + $300) (P/A, 5%, 2)
= +$1,500 - $2,800 (1.859) = -$3,705
Since the PW of Cost of the overhaul is less than the PW of Cost of the replacement car, the
decision is to overhaul the 1988 auto.
13-15
In a before-tax computation the data about depreciation is unneeded.
Year
0
1- 10
10
Sum
Reconditioned
Equipment
-$35,000
-$10,000
+$10,000
New
Equipment
-$85,000
New vs.
reconditioned
-$40,000
PW at 12%
PW at 15%
-$40,000
-$40,000
+$7,000
+$15,000
+$7,000
+$5,000
+$39,555
+$1,610
= +$1,165
$35,133
+$1,236
=-$3,631
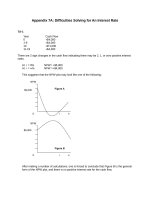
By linear interpolation, the incremental before-tax rate of return is 12.7%.
The 12.7% rate of return on the increment is unsatisfactory, so reject the increment and
recondition the old tank car.
13-16
(a) Before-Tax Analysis
Year
0
1
2
3
4
New Machine
BTCF
-$3,700
+$900
+$900
+$900
+$900
Existing Machine
BTCF
-$1,000
$0
$0
$0
$0
New Machine rather than
Existing Machine BTCF
-$2,700
+$900
+$900
+$900
+$900
Compute Rate of Return
PW of Cost = PW of Benefit
$2,700 = $900 (P/A, i%, 4)
(P/A, i%, 4) = $2,700/$900 = 3.0
Rate of return = 12.6%
(b) After-Tax Analysis
New Machine
Year
BTCF
0
1
2
3
4
-$3,700
+$900
+$900
+$900
+$900
SOYD
Deprec.
Taxable
Income
$1,480
$1,110
$740
$370
-$580
-$210
+$160
$530
40% Income ATCF
Taxes
-$3,705
+$232
+$1,132
+$84
+$984
-$64
+$836
-$212
+$688
SOYD Deprec
Sum = (4/2) (5)
= 10
1st Year SOYD = (4/10) ($3,700 - $0)
Annual Decline
= (1/10) ($3,700 - $0) - $370
Existing Machine
*
Year
BTCF
SL Deprec.
0
1
2
3
4
-$1,000
$0
$0
$0
$0
$500
$500
$500
$500
Taxable
Income
$1,000*
-$500
-$500
-$500
-$500
40% Income
Taxes
-$200**
+$200
+$200
+$200
+$200
Long term capital loss foregone by keeping machine:
$2,000 Book Value - $1,000 Selling price = $1,000 capital loss
ATCF
-$1,200
+$200
+$200
+$200
+$200
**
The $1,000 long term capital loss foregone would have offset $1,000 of long term
capital gains elsewhere in the firm. The result is a tax saving of 20% ($1,000) =
$200 is foregone.
New Machine rather than Existing Machine
Year
New Tool ATCF
0
1
2
3
4
-$3,705
+$1,132
+$984
+$836
+$688
∆ After-Tax rate of return
Existing
Tool ATCF
-$1,200
+$200
+$200
+$200
+$200
New- Existing
ATCF
-$2,500
$932
$784
$636
$488
Sum
PW AT 5%
PW AT 6%
-$2,500
$888
$711
$549
$400
= +$50
-$2,500
$879
$698
$534
$387
-$2
= 5.96%
13-17
Alternative I: Retire the 4 old machines and buy 6 new machines.
Initial Cost:
6 new machines at $32,000 each
Training Program at 6 x $700
Total
Savings:
Annual Labor Saving
Less Maintenance
Total
$192,000
+$4,200
= $196,200
$12,000
$3,600
$8,400
Compute Equivalent Uniform Annual Cost (EUAC)
Initial Cost: $196,000 (A/P, 9%, 8)
= $196,000 (0.1807) = $35,453
Less Salvage Value: (6 x $750) (A/F, 9%, 8)= $4,500 (0.0907) = -$408
Less Net Annual Benefit:
= -$8,400
EUAC = $26,645
Alternative II: Keep 4 old machines and buy 3 new ones
Initial Cost:
Value of 4 old machines 4 x $2,000 $8,000
3 new machines at $32,000 each$96,000
Training Program at 3 x $700
$2,100
Total
= $106,100
Annual Maintenance= 4 old x $1,500 + 3 new x $600 = $7,800 per year
Salvage Value 8 years hence= 4 old x $500 + 3 new x $750 = $4,250
Compute Equivalent Uniform Annual Cost (EUAC)
Initial Cost: $106,100 (A/P, 9%, 8)
= $106,100 (0.1807) = $19,172
Less Salvage Value: ($4,250) (A/F, 9%, 8)
Add Annual Maintenance:
= $4,250 (0.0907)
= -$385
= +$7,800
EUAC = $26,587
Decision: Choose Alternative II with its slightly lower EUAC.
13-18
For this problem we have marginal cost data for the defender, so we will check to see if that
data is strictly increasing.
Defender
Current Market Value
Year
0
1
2
3
4
5
6
7
8
9
10
= $25,000 (0.90)5
= $14,762
Time
Line
Market
Value (n)
Loss in
MV (n)
Annual
Costs
(n)
Lost
Interest
in (n)
Total
Marg.
Cost
-5
-4
-3
-2
-1
1
2
3
4
5
$25,000
$22,500
$20,250
$18,225
$16,403
$14,762
$13,286
$11,957
$10,762
$9,686
$8,717
$2,500
$2,250
$2,025
$1,823
$1,640
$1,476
$1,329
$1,196
$1,076
$969
$1,250
$1,750
$2,250
$2,750
$3,250
$3,750
$4,250
$4,750
$5,250
$5,750
$2,000
$1,800
$1,620
$1,458
$1,312
$1,181
$1,063
$957
$861
$775
$5,750
$5,800
$5,895
$6,031
$6,202
$6,407
$6,641
$6,902
$7,187
$7,493
We see that this data is strictly increasing from the Time Line of today onward (year 6 of
the original life). Thus we use Replacement Analysis Technique #1 and compare the
marginal cost data of the defender against the min. EUAC of the challenger. Let’s find the
Challenger’s min. EUAC at its 5-year life.
Challenger
Challenger’s min. cost life is given at 5 years in the problem.
EUAC
= $27,900 (A/P, 8%, 5)
= $6,989
From this we would recommend that we keep the Defender for three more years and then
replace it with the Challenger. This is because after three years the marginal costs of the
Defender become greater than the min. EUAC of the Challenger.
13-19
For this problem we have marginal cost data for the defender, so we will check to see if that
data is strictly increasing.
Defender:
Current Market Value
Year
Time
Market
= $25,000 (0.70)5
Loss in
= $4,202
Annual
Lost
Total
0
1
2
3
4
5
6
7
8
9
10
Line
Value (n)
MV (n)
Costs
(n)
Interest in
(n)
Marg.
Cost
-5
-4
-3
-2
-1
1
2
3
4
5
$25,000
$17,500
$12,250
$8,575
$6,003
$4,202
$2,941
$2,059
$1,441
$1,009
$706
$7,500
$5,250
$3,675
$2,573
$1,801
$1,261
$882
$618
$532
$303
$3,000
$3,300
$3,630
$3,993
$4,392
$4,832
$5,315
$5,846
$6,431
$7,074
$2,000
$1,400
$980
$686
$480
$336
$235
$165
$115
$81
$12,500
$9,950
$8,285
$7,252
$6,673
$6,428
$6,432
$6,629
$6,978
$7,457
Again here the marginal costs of the Defender are strictly increasing from the Time Line of
today onward (year 6 of the original life). Thus, we use Replacement Analysis Technique
#1 and compare the marginal cost data of the defender against the min. EUAC of the
challenger.
From the previous problem the Challenger’s min. EUAC at its 5-year life is:
EUAC = $27,900 (A/P, 8%, 5)
= $6,989
From this we would recommend that we keep the Defender for four more years and then
replace it with the Challenger. This is because after three years the marginal costs of the
Defender become greater than the min. EUAC of the Challenger.
13-20
Year
Time
Line
Salv.
Oper.
Insur.
Maint.
Lost
Interest
Lost MV
1
2
3
4
5
6
7
8
9
10
-5
-4
-3
-2
-1
1
2
3
4
5
$80,000
$78,000
$76,000
$74,000
$72,000
$70,000
$68,000
$66,000
$64,000
$62,000
$16,000
$20,000
$24,000
$28,000
$32,000
$36,000
$40,000
$44,000
$48,000
$52,000
$17,000
$16,000
$15,000
$14,000
$13,000
$12,000
$11,000
$10,000
$10,000
$10,000
$5,000
$10,000
$15,000
$20,000
$25,000
$30,000
$35,000
$40,000
$45,000
$50,000
$31,250
$20,000
$19,500
$19,000
$18,500
$18,000
$17,500
$17,000
$16,500
$16,000
$45,000
$2,000
$2,000
$2,000
$2,000
$2,000
$2,000
$2,000
$2,000
$2,000
Total
Marg.
Cost
$114,250
$68,000
$75,500
$83,000
$90,500
$98,000
$105,500
$113,000
$121,500
$130,000
(a) Total marginal cost for this previously implemented asset is given above.
(b) In looking at the table above one can see that the marginal cost data of the defender is
strictly increasing over the next five year period. Thus the Replacement Decision
Analysis Map would suggest that we use Replacement Analysis Technique #1. We
compare the defender marginal cost data against the challenger’s minimum EUAC.
We would keep the defender asset for two more years and then replace it with the new
automated shearing equipment. After two years the MC (def) > Min. EUAC (chal):
$113,000 > $110,000
13-21
In this case we first compute the total marginal costs of the defender asset. From Figure 131 the marginal cost data is available, and it is not strictly increasing (see Total MC column in
the table below). Thus, we use Replacement Analysis Technique #2, comparing minimum
EUAC defender against minimum EUAC of challenger. In the table below the minimum
EUAC is at year 5 for the old paver (five years from today), the value is $59,703. We
compare this value to the minimum EUAC for the challenger of $62,000. Thus, we
recommend keeping the defender for at least one more year and reviewing the data for
changes.
MARR%
First
Cost
20%
120000
YEAR
OPER
(n)
1
2
3
4
5
6
7
Cost
15000
15000
17000
20000
25000
30000
35000
MAIN
T
Cost
9000
10000
12000
18000
20000
25000
30000
MV in
(n)
85000
65000
50000
40000
35000
30000
25000
Lost
MV
(n)
35000
20000
15000
10000
5000
5000
5000
Lost
Int.
(n)
24000
7000
4000
3000
2000
1000
1000
Total
MC
(n)
83000
52000
48000
51000
52000
61000
71000
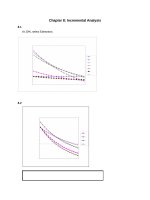
NPW
EUAC
(1-->n)
$69,166.67
$105,277.78
$133,055.56
$157,650.46
$178,548.10
$198,976.87
$218,791.67
(1-->n)
$83,000.00
$68,909.09
$63,164.84
$60,898.66
$59,702.86
$59,833.49
$60,698.04
13-22
(a)
The minimum cost life is where the EUAC of ownership is minimized for the number
of years held. This would occur at 4 years for the defender where EUAC = $4,400.
(b)
The minimum cost life of the challenger is 5 years where the EUAC = $6,200.
(c)
Using Replacement Analysis Technique #3:
Assuming that the defender and
challenger costs do not change over the next 4 years we should keep the defender
for four years and then reevaluate the costs with challengers at that time. Here we
are comparing the min. EUAC (def) vs. min. EUAC (challenger) and $4,400 < $6,200
thus we keep the defender.
13-23
(a)
The minimum cost life is where the EUAC of ownership is minimized for the number
of years held. This would occur at 1 year for the defender, where EUAC = $4,000.
(b)
The minimum cost life of the challenger is 4 years where the EUAC = $3,300.
(c)
Using Replacement Analysis Technique #3: Given these costs for the defender and
challenger we should replace the defender with the challenger asset now. This is
because the min. EUAC (def) > min. EUAC (challenger): $4,000 > $3,300.
13-24
Here we use Replacement Analysis Technique #3. Because the remaining life of the
defender and the life of the challenger are both 10 years we can use either the “opportunity
cost” or “cash flow” approach to setting the first cost of each option (keep defender or
replace with challenger). Let’s show each solution:
Opportunity Cost Approach
EUAC (def)
= 4 ($600) (A/P, 25%, 10)
= $672
EUAC (chal)
= $5,000 (A/P, 25%, 10) - $10,000 (0.075)
= $650
Cash Flow Cost Approach
EUAC (def)
= $0.00
EUAC (chal)
= ($5,000 - $2,400) (A/P, 255, 10) - $10,000 (0.075) = -$22
In either case we recommend that the new high efficiency machine be implemented today.
13-25
From the facts stated, we see that if the old forklift is retained the EUAC is minimum for a
one year useful life. The problem says the challenger economic life is 10 years. (Using the
data provided this fact could be verified, but that is not part of the problem.)
Annual Cash-Flow Analysis:
Keep Old Forklift Another Year
Year BTCF
Deprec.
0
1
$0
$400
$0
Taxable
Income
-$400
40% Income ATCF
Taxes
$0
+$160
-$240
EUAC for one more year with old forklift = $240
Buy New Forklift
Year BTCF
SL Deprec.
Taxable
Income
0
1- 10
$650
-$700
EUAC
-$6,500
-$50
40% Income ATCF
Taxes
-$6,500
+$280
+$230
= $6,500 (A/P, 8%, 10) - $230
= $6,500 (0.1490) - $230
= $738.50
Decision: Choose the alternative with the minimum EUAC. Keep the old forklift another
year.
13-26
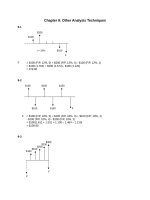
The problem, with a 7-year analysis period, may be solved in a variety of ways. A first step
is to compute an after-tax cash flow for each alternative.
Alternative A
Year
BTCF
0
1- 7
-$44,000
$0
Deprec.
Taxable
Income
-$44,000
$0
40% Income ATCF
Taxes
+$17,600
-$26,400
$0
Alternative B
This alternative is less desirable than Alternative D and may be immediately rejected.
Alternative C
Year
BTCF
0
1
2
3
4
5
6
7
-$56,000
$12,000
$12,000
$12,000
$12,000
$12,000
$12,000
$12,000
SOYD
Deprec.
Taxable
Income
$14,000
$12,000
$10,000
$8,000
$6,000
$4,000
$2,000
-$2,000
$0
$2,000
$4,000
$6,000
$8,000
$10,000
40% Income ATCF
Taxes
-$56,000
+$800
+$12,800
$0
+$12,000
-$800
+$11,200
-$1,600
+$10,400
-$2,400
+$9,600
-$3,200
+$8,800
-$4,000
+$8,000
Alternative D
Year
BTCF
Deprec.
Taxable
Income
0
1- 7
-$49,000
$7,000
$7,000
$0
40% Income ATCF
Taxes
-$49,000
$0
+$7,000
Alternative E (Do Nothing)
Year
BTCF
Deprec.
Taxable
Income
0
1- 7
$0
-$8,000
$0
-$8,000
40% Income ATCF
Taxes
$0
+$3,200
-$4,800
A NPW solution is probably easiest to compute:
NPWA
NPWC
NPWD
NPWE
= -$26,400
= -$56,000 + $12,800 (P/A, 10%, 7) - $800 (P/G, 10%, 7)
= -$56,000 + $12,800 (4.868) - $800 (12.763)
= -$3,900
= -$49,000 + $7,000 (P/A, 10%, 7)
= -$49,000 + $7,000 (4.868)
= -$14,924
= -$4,800 (P/A, 10%, 7)
= -$4,800 (4.868)
= -$23,366
Choose the solution that maximizes NPW. Choose Alternative C.
Rate of Return Solution
Alternative A rather than Alternative E (Do nothing)
Year
0
1- 7
Alt. A ATCF
-$26,400
$0
Alt. E ATCF
$0
-$4,800
(A- E) ATCF
-$26,400
+$4,800
∆ROR
= 6.4%
Reject Alternative A.
Alternative D rather than Alternative E
Year
0
1- 7
Alt. D ATCF
-$49,000
+$7,000
Alt. E ATCF
$0
-$4,800
(D- E) ATCF
-$49,000
+$11,800
∆ROR = 12.8%
Reject Alternative E.
Alternative C rather than Alternative D
Year
0
1
2
3
4
5
6
7
Alt. C ATCF
-$56,000
+$12,800
+$12,000
+$11,200
+$10,400
+$9,600
+$8,800
+$8,000
Alt. D ATCF
-$49,000
$7,000
$7,000
$7,000
$7,000
$7,000
$7,000
$7,000
(C- D) ATCF
-$7,000
$5,800
$5,000
$4,200
$3,400
$2,600
$1,800
$1,000
$7,000 = $5,800 (P/A, i%, 7) - $800 (P/G, i%, 7)
∆ROR > 60%
(Calculator Solution: ∆ROR = 65.9%)
Reject D.
Conclusion: Choose Alternative C.
13-27
Book value of Machine A now
= Cost – Depreciation to date
= $54,000 – (9/12) ($54,000 - $0)
= $13,500
Recaptured Deprec. If sold now = $30,000 - $13,500
= $16,500
Machine A annual depreciation = (P – S)/n
Machine B annual depreciation = (P – S)/n
= ($54,000 - $0)/12
= ($42,000 - $0)/12
Alternate 1: Keep A for 12 more years
Year BTCF
SL Deprec.
Taxable
Income
0
-$30,000*
-$16,500
1
$0
$4,500
-$4,500
2
$0
$4,500
-$4,500
3
$0
$4,500
-$4,500
4- 12 $0
$0
$0
* If A were sold the Year 0 entries would be:
Year BTCF
SL Deprec.
Taxable
Income
0
+$30,000
$16,500
If A is kept, the entries are just the reverse.
40% Income
Taxes
+$6,600
+$1,800
+$1,800
+$1,800
$0
= $4,500
= $3,500
ATCF
-$23,400
+$1,800
+$1,800
+$1,800
$0
40% Income ATCF
Taxes
-$6,600
+$23,400
After-Tax Annual Cost
= [$23,400 - $1,800 (P/A, 10%, 4)] (A/P, 10%, 12)
= [$23,400 - $1,800 (2.487)] (0.1468)
= $2,778
The cash flow in year 0 reflects the loss of income after Recaptured Depreciation tax from
not selling Machine A. This is the preferred way to handle the current market value of the
“defender.”
Alternate 2: Buy Machine B
Year BTCF
SL Deprec.
0
1- 12
-$42,000
+$2,500
$3,500
Taxable
Income
-$1,000
40% Income ATCF
Taxes
-$42,000
+$400
+$2,900
After-Tax Annual Cost
= $42,000 (A/P, 10%, 12) - $2,900
= $42,000 (0.1468) - $2,900
= $3,266
Choose the alternative with the smaller annual cost. Keep Machine A.
13-28
(a) SONAR
SOYD = (8/2) (9)
= 36
∆D/yr = (1/36) ($18,000 - $3,600)
Original
Year j
1
= $400
SOYD Deprec.
Book Value
$3,200
$14,800
Now
Orig.
Year
5
6
7
8
2
3
4
5
6
7
8
Analysis
Year
0
1
2
3
$2,800
$2,400
$2,000
$1,600
$1,200
$800
$400
BTCF
SOYD
Deprec.
-$7,000
$1,600
$1,200
$800
$400
$12,000
$9,600
$7,600
$6,000
$4,800
$4,000
$3,600
BV5
∆ Tax
Income
-$1,000*
-$1,200
-$800
-$400
$2,000**
∆ Tax
ATCF
+$400
+$480
+$320
+$160
+$800
-$6,600
+$480
+$320
+$2,560
* Foregone recaptured depreciation is $7,000 – BV5 = $1,000
** Loss is $1,600 – BV5 = -$2,000
(b)
Year
BTCF
($10,000)
$500
$500
$500
$4,000
0
1
2
3
CCA
Depreciation
(30%
$1,500
$2,550
$1,785
∆ Tax
Income
($1,000)
($2,050)
($1,285)
($400.0)
($820.0)
($514.0)
ATCF
(SHSS)
($10,000.0)
$900.0
$1,320.0
$1,014.0
($165)
($66.0)
$4,066.0
∆ Tax (40%)
Recaptured depreciation (loss) = SV-BV
BV(3)=
$4,165
(c)
Year
∆ATCF = ATCFSHSS – ATCFSonar
0
1
2
3
($3,400)
$420
$1,000
$2,520
(d) Compute the NPW of the difference between alternatives
NPW @ 20% = $897.22
ATCF
(Sonar)
($6,600)
$480
$320
$2,560
13-29
Here we use the Opportunity Cost Approach for finding the first costs.
(a) Problem as given
Defender:
SL depreciation
= ($50,000 - $15,000)/10
= $3,500 per year
= $30,000
MV today
Year
Sell
0
Keep 0
* TI
BTCF
$30,000
-$30,000
TI
$4,500*
-$4,500
IT
-$2,025
+$2,025
Year
0
0
= $25,500
= ($50,000 - $15,000)/10
= $30,000
BTCF
$30,000
-$30,000
* Recaptured Depr.
Challenger
Year BTCF
0
-$85,000
Depr.
TI
$0*
$0
Year
Sell
0
Keep 0
= $3,500 per year
IT
$0
$0
Depr.
BTCF
$30,000
-$30,000
TI
Depr.
* Loss = $18,000 – [$50,000 – 7 ($3,500)]
IT
+$8,500
ATCF
-$76,500
= $3,500 per year
TI
-$7,500*
+$7,500
IT
+$3,375
-$3,375
= -$7,500
Challenger
BTCF
-$85,000
ATCF
$30,000
-$30,000
= $25,500 – [$50,000 – 7 ($3,500)] = $0
(c) Defender Market Value
= $18,000
Defender: SL Depr = ($50,000 - $15,000)/10
MV (today)
= $18,000
Year
0
ATCF
$27,975
-$27,975
= Taxable Inc. = Recaptured Deprec.
= $30,000 – [$50,000 – 7 ($3,500)]
= $4,500
b) Defender Market value
Defender:
SL Depr
MV (today)
Sell
Keep
Depr.
Depr.
TI
IT
+$8,500
ATCF
-$76,500
ATCF
$33,375
-$33,375
13-30
Challenger
30%
Depr.
TI
($10,000)
($10,000)
($100)
$1,500
($1,600)
$560
$460
$390
2
($150)
$2,550
($2,700)
$945
$795
$571
3
($200)
$1,785
($1,985)
$695
$495
$301
4
($250)
$1,250
($1,500)
$525
$275
$142
5
($300)
$875
($1,175)
$411
$111
$49
6
($350)
$612
($962)
$337
($13)
($5)
6
$1,000
($429)
$150
$1,275
$472
NPV=
AW=
($8,080)
$2,310.26
Year
BTCF
0
($10,000)
1
BV(yr 6) =
$8,571
$1,429
d
CCA1 = P ( )
2
for n = 1
d
CCAn = Pd (1 − )(1 − d ) n−2 for n ≥ 2
2
d
UCC n = P (1 − )(1 − d ) n −1 for n ≥ 2
2
13-31
Solution three years into purchase:
15000
10000
-1000
1000
1000
35%
30%
25%
First
cost
Initial salvage
Salvage
gradient
Initial O&M
O&M gradient
Tax
Rate
CCA
rate
Interest rate
35%
IT
ATCF
18%
PV
Year
0
1
Capital
Cost
-15000
2
3
1
4
10000
2
5
9000
3
6
8000
4
7
7000
5
8
6000
6
9
5000
7
10
4000
8
11
3000
CCA
2250
$
3,825
$
2,678
$
1,874
$
1,312
$
918
$
643
$
450
$
315
$
221
$
154
Book
Value
$
8,925
$
6,248
$
4,373
$
3,061
$
2,143
$
1,500
$
1,050
$
735
$
515
$
360
AT
Salvage
$
8,031
$
6,921
$
5,950
$
5,075
$
4,268
$
3,507
$
2,780
$
2,076
O&M cash
flow
-1000
-2000
-3000
-4000
-5000
-6000
-7000
-8000
Taxable
Income
PW Sum
O&M tax
$
(2,874)
$
(3,312)
$
(3,918)
$
(4,643)
$
(5,450)
$
(6,315)
$
(7,221)
$
(8,154)
$
5
$
(533)
$
(1,367)
$
(2,340)
$
(3,353)
$
(4,347)
$
(5,285)
$
(6,148)
=NPV($A$8,$G$14:G22)-$A$6*NPV($A$8,$H$14:H22)
=PMT($A$8,A22,I22+
$C$11,F23)
Solution three years into purchase - 7 yr min EAC
EAC
$11,823
$8,143
$7,054
$6,602
$6,397
$6,308
$6,279
$6,353
13-32
125000
80000
-2000
35%
30%
25%
First cost
Initial
salvage
Salvage
gradient
Initial
O&M
O&M
gradient
Tax Rate
CCA rate
Interest
rate
Year
1
2
3
4
5
6
7
8
9
10
11
0
1
2
3
4
5
6
7
8
9
10
11
Capital
Cost
125000
80000
78000
76000
74000
72000
70000
68000
66000
64000
62000
60000
CCA
Book
Value
18750
31875
22313
15619
10933
7653
5357
3750
2625
1838
1286
125000
106250
74375
52063
36444
25511
17857
12500
8750
6125
4288
3001
AT
Salvage
Operating
89188
76731
67622
60855
55729
51750
48575
45963
43744
41801
40050
16000
20000
24000
28000
32000
36000
40000
44000
48000
52000
56000
Main.
5000
10000
15000
20000
25000
30000
35000
40000
45000
50000
55000
Insurance
17000
16000
15000
14000
13000
12000
11000
10000
10000
10000
10000
O&M
cash
-38000
-46000
-54000
-62000
-70000
-78000
-86000
-94000
-103000
-112000
-121000
Taxable
Income
-56750
-77875
-76313
-77619
-80933
-85653
-91357
-97750
-105625
-113838
-122286
PW Sum
O&M tax
-14510
-26506
-40479
-54747
-68402
-80991
-92320
-102351
-111214
-118962
-125679
EAC
$85,200
$71,110
$67,037
$65,557
$65,126
$65,197
$65,525
$65,980
$66,513
$67,070
$67,618