Solution manual engineering economic analysis 9th edition ch15
Bạn đang xem bản rút gọn của tài liệu. Xem và tải ngay bản đầy đủ của tài liệu tại đây (37.62 KB, 4 trang )
Chapter 15: Selection of a Minimum Attractive Rate of Return
15-1
The interest rates on these securities vary greatly over time, making it impossible to predict
rates. Three factors that distinguish the securities:
Bond Duration
20 years
20 years
Municipal Bond
Corporate Bond
Bond Safety
Safe
Less Safe
The importance of the non-taxable income feature usually makes the municipal bond the
one with the lowest interest rate. The corporate bond generally will have the highest interest
rate.
15-2
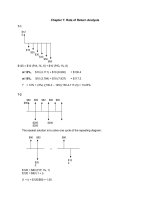
As this is a situation of “neither input nor output fixed,” incremental analysis is required.
∆ Cost
∆ Benefit
∆ Rate of Return
C- D
$25
$4
9.6%
B- C
$50
$6.31
4.5%
B- D
$75
$10.31
6.2%
D- A
$25
$5.96
20%
Using the incremental rates of return one may determine the preferred alternative at any
interest rate.
For interest rates between:
0%
4.5%
B
9.6%
C
20%
D
∞
A
The problem here concerns Alternative C. C is preferred for 4.5% < Interest Rate < 9.6%.
15-3
Lease: Pay $267 per month for 24 months.
Purchase:
A = $9,400 (A/P, 1%, 24)
= $9,400 (0.0471) = $442.74
Salvage (resale) value = $4,700
(a) Purchase Rather than Lease
∆Monthly payment = $442.71 - $267
= $175.74
∆Salvage value = $4,700 - $0 = $4,700
∆ Rate of Return
PW of Cost = PW of Benefit
$175.74 (P/A, i%, 24) = $4,700
(P/A, i%, 24) = $4,700/$175.74 = 26.74
i = 0.93% per month
Thus, the additional monthly payment of $175.74 would yield an 11.2% rate of return.
Leasing is therefore preferred at all interest rates above 11.2%.
(b) Items that might make leasing more desirable:
1. One does not have, or does not want to spend, the additional $175.74 per month.
2. One can make more than 11.2% rate of return in other investment.
3. One does not have to be concerned about the resale value of the car at the end of
two years.
15-4
Investment opportunities may include:
1.
Deposit of the money in a Bank.
2.
Purchase of common stock, US Treasury bonds, or corporate
bonds.
3.
Investment in a new business, or an existing business.
4.
(and so on.)
Assuming the student has a single investment in which more than $2,000 could be invested,
the MARR equals the projected rate of return for the investment.
15-5
Venture capital syndicates typically invest money in situations with a substantial amount of
risk. The process of identifying and selecting investments is a time-consuming (and hence
costly) process. The group would therefore only make a venture capital investment where
(they think) the rate of return will be high- probably 25% or more.
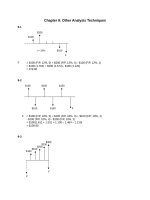
15-6
The IRR for each project is calculated using the Excel function = RATE (life, annual benefit,
-first cost, salvage value), and then the table is sorted with IRR as the key. Projects A and B
are the top two projects, which fully utilize the $100,000 capital budget. The opportunity cost
of capital is 12.0% if based on the first project rejected.
Project
IRR
First Cost
A
B
D
C
13.15%
12.41%
11.99%
10.66%
$50,000
$50,000
$50,000
$50,000
Annual
Benefits
$13,500
$9,000
$9,575
$13,250
Life
5 yrs
10 yrs
8 yrs
5 yrs
Salvage
Value
$5,000
$0
$6,000
$1,000
15-7
The IRR for each project is calculated using the Excel function = RATE (3, annual benefit,
-first cost) since N = 3 for all projects. Then the table is sorted with IRR as the key. Do
projects 3, 1 and 7 with a budget of $70,000. The opportunity cost of capital is 26.0% if
based on the first project rejected.
Project
IRR
3
1
7
5
4
2
6
36.31%
29.92%
26.67%
26.01%
20.71%
18.91%
18.91%
Cumulative
First Cost
$10,000
$30,000
$70,000
$95,000
$100,000
$130,000
$145,000
First Cost
$10,000
$20,000
$40,000
$25,000
$5,000
$30,000
$15,000
Annual
Benefit
$6,000
$11,000
$21,000
$13,000
$2,400
$14,000
$7,000
15-8
The IRR for each project is calculated using the Excel function = RATE (life, annual benefit, -first
cost, salvage value), and then the table is sorted with IRR as the key. With a budget of
$500,000, the opportunity cost of capital is 19.36% if based on the first project rejected.
Projects 3, 1, 4, and 6 should be done.
Project
IRR
3
1
4
6
2
7
5
28.65%
24.01%
21.41%
20.85%
19.36%
16.99%
15.24%
Cumulative
First Cost
$100,000
$300,000
$350,000
$500,000
$800,000
$1,200,000
$1,450,000
First Cost
$100,000
$200,000
$50,000
$150,000
$300,000
$400,000
$250,000
Annual
Benefit
$40,000
$50,000
$12,500
$32,000
$70,000
$125,000
$75,000
Life (years)
5
15
10
20
10
5
5
15-9
The IRR for each project is calculated using the Excel function = Rate (life, annual benefit,
-first cost), and then the table is sorted with IRR as the key. The top 6 projects required
$260K in capital funding, and the opportunity cost of capital based on the first rejected
project is 8.0%.
Project
IRR
E
H
C
G
I
B
15.00%
13.44%
12.00%
10.97%
10.00%
9.00%
Cumulative
First Cost
$40,000
$100,000
$130,000
$165,000
$240,000
$260,000
First Cost
$40,000
$60,000
$30,000
$35,000
$75,000
$20,000
Annual
Benefit
$11,933
$12,692
$9,878
$6,794
$14,058
$6,173
Life (years)
5
8
4
8
8
4
D
A
F
8.00%
7.01%
5.00$
$285,000
$300,000
$350,000
$25,000
$15,000
$50,000
$6,261
$4,429
$11,550
5
4
5
15-10
The IRR for each project is calculated using the Excel function = RATE (life, annual benefit,
-first cost, salvage value), and then the table is sorted with IRR as the key. With a budget of
$100,000, the top 5 projects should be done (6, 5, 4, 1, and 7). The opportunity cost of
capital based on the first rejected project is 16.41%.
Project
IRR
First Cost
6
5
4
1
7
3
2
26.16%
22.50%
21.25%
19.43%
19.26%
16.41%
16.00%
$20,000
$20,000
$20,000
$20,000
$20,000
$20,000
$20,000
Annual
Benefits
$5,800
$4,500
$4,500
$4,000
$4,000
$3,300
$3,200
Life (years)
10
25
15
20
15
30
20
Salvage
Value
$0
-$20,000
$0
$0
$10,000
$10,000
$20,000