SOLUTION MANUAL engineering economic analysis 9th edition
Bạn đang xem bản rút gọn của tài liệu. Xem và tải ngay bản đầy đủ của tài liệu tại đây (2.24 MB, 421 trang )
Uploaded by:
Ebooks Chemical Engineering
/>
For More Books, softwares & tutorials Related to Chemical Engineering
Join Us
@facebook: />@facebook: />@facebook: />
ADMIN:
I.W
Chapter 1: Making Economic Decisions
1-1
A survey of students answering this question indicated that they thought about 40% of their
decisions were conscious decisions.
1-2
(a)
Yes.
The choice of an engine has important money consequences so would be
suitable for engineering economic analysis.
(b)
Yes.
Important economic- and social- consequences. Some might argue the
social consequences are more important than the economics.
(c)
?
Probably there are a variety of considerations much more important than
the economics.
(d)
No.
Picking a career on an economic basis sounds terrible.
(e)
No.
Picking a wife on an economic basis sounds even worse.
1-3
Of the three alternatives, the $150,000 investment problem is most suitable for economic
analysis. There is not enough data to figure out how to proceed, but if the µdesirable interest
rate¶ were 9%, then foregoing it for one week would mean a loss of:
1
/52 (0.09) = 0.0017 = 0.17%
immediately. It would take over a year at 0.15% more to equal the 0.17% foregone now.
The chocolate bar problem is suitable for economic analysis. Compared to the investment
problem it is, of course, trivial.
Joe¶s problem is a real problem with serious economic consequences. The difficulty may be in
figuring out what one gains if he pays for the fender damage, instead of having the insurance
company pay for it.
1-4
Gambling, the stock market, drilling for oil, hunting for buried treasure²there are sure to be a lot
of interesting answers. Note that if you could double your money every day, then:
2x ($300) = $1,000,000
and x is less than 12 days.
1-5
Maybe their stock market µsystems¶ don¶t work!
1-6
It may look simple to the owner because he is not the one losing a job. For the three
machinists it represents a major event with major consequences.
1-7
For most high school seniors there probably are only a limited number of colleges and
universities that are feasible alternatives. Nevertheless, it is still a complex problem.
1-8
It really is not an economic problem solely ² it is a complex problem.
1-9
Since it takes time and effort to go to the bookstore, the minimum number of pads might be
related to the smallest saving worth bothering about. The maximum number of pads might
be the quantity needed over a reasonable period of time, like the rest of the academic year.
1-10
While there might be a lot of disagreement on the µcorrect¶ answer, only automobile
insurance represents a substantial amount of money and a situation where money might be
the primary basis for choosing between alternatives.
1-11
The overall problems are all complex. The student will have a hard time coming up with
examples that are truly simple or intermediate until he/she breaks them into smaller and
smaller sub-problems.
1-12
These questions will create disagreement. None of the situations represents rational
decision-making.
Choosing the same career as a friend might be OK, but it doesn¶t seem too rational.
Jill didn¶t consider all the alternatives.
Don thought he was minimizing cost, but it didn¶t work. Maybe rational decision-making
says one should buy better tools that will last.
1-13
Possible objectives for NASA can be stated in general terms of space exploration or the
generation of knowledge or they can be stated in very concrete terms. President Kennedy
used the latter approach with a year for landing a man on the moon to inspire employees.
Thus the following objectives as examples are concrete. No year is specified here, because
unlike President Kennedy we do not know what dates may be achievable.
Land a man safely on Mars and return him to earth by ______.
Establish a colony on the moon by ______.
Establish a permanent space station by ______.
Support private sector tourism in space by ______.
Maximize fundamental knowledge about science through x probes per year or for $y
per year.
Maximize applied knowledge about supporting man¶s activities in space through x
probes per year or for $y per year.
Choosing among these objectives involves technical decisions (some objectives may be
prerequisites for others), political decisions (balance between science and applied
knowledge for man¶s activities), and economic decisions (how many dollars per year can be
allocated to NASA).
However, our favorite is a colony on the moon, because a colony is intended to be
permanent and it would represent a new frontier for human ingenuity and opportunity.
Evaluation of alternatives would focus on costs, uncertainties, and schedules. Estimates of
these would rely on NASA¶s historical experience, expert judgment, and some of the
estimating tools discussed in Chapter 2.
1-14
This is a challenging question. One approach might be:
(a) Find out what percentage of the population is left-handed.
(b) What is the population of the selected hometown?
(c) Next, market research might be required. With some specific scissors (quality and price)
in mind, ask a random sample of people if they would purchase the scissors. Study the
responses of both left-handed and right-handed people.
(d) With only two hours available, this is probably all the information one could collect. From
the data, make an estimate.
A different approach might be to assume that the people interested in left handed scissors in
the future will be about the same as the number who bought them in the past.
(a) Telephone several sewing and department stores in the area. Ask two questions:
(i) How many pairs of scissors have you sold in one year (or six months or?).
(ii) What is the ratio of sales of left-handed scissors to regular scissor?
(b) From the data in (a), estimate the future demand for left-handed scissors.
Two items might be worth noting.
1. Lots of scissors are universal, and equally useful for left- and right-handed
people.
2. Many left-handed people probably never have heard of left-handed scissors.
1-15
Possible alternatives might include:
1. Live at home.
2. A room in a private home in return for work in the garden, etc.
3. Become a Resident Assistant in a University dormitory.
4. Live in a camper-or tent- in a nearby rural area.
5. Live in a trailer on a construction site in return for µkeeping an eye on the place.
1-16
A common situation is looking for a car where the car is purchased from either the first
dealer or the most promising alternative from the newspaper¶s classified section. This may
lead to an acceptable or even a good choice, but it is highly unlikely to lead to the best
choice. A better search would begin with Consumer Reports or some other source that
summarizes many models of vehicles. While reading about models, the car buyer can be
identifying alternatives and clarifying which features are important. With this in mind, several
car lots can be visited to see many of the choices. Then either a dealer or the classifieds
can be used to select the best alternative.
1-17
Choose the better of the undesirable alternatives.
1-18
(a)
(b)
(c)
(d)
Maximize the difference between output and input.
Minimize input.
Maximize the difference between output and input.
Minimize input.
1-19
(a)
(b)
(c)
(d)
Maximize the difference between output and input.
Maximize the difference between output and input.
Minimize input.
Minimize input.
1-20
Some possible answers:
1.
There are benefits to those who gain from the decision, but no one is harmed.
(Pareto Optimum)
2.
Benefits flow to those who need them most. (Welfware criterion)
3.
4.
5.
6.
7.
8.
Minimize air pollution or other specific item.
Maximize total employment on the project.
Maximize pay and benefits for some group (e.g., union members)
Most aesthetically pleasing result.
Fit into normal workweek to avoid overtime.
Maximize the use of the people already within the company.
1-21
Surely planners would like to use criterion (a). Unfortunately, people who are relocated
often feel harmed, no matter how much money, etc., they are given. Thus planners
consider criterion (a) unworkable and use criterion (b) instead.
1-22
In this kind of highway project, the benefits typically focus on better serving future demand
for travel measured in vehicles per day, lower accident rates, and time lost due to
congestion. In some cases, these projects are also used for urban renewal of decayed
residential or industrial areas, which introduces other benefits.
The costs of these projects include the money spent on the project, the time lost by travelers
due to construction caused congestion, and the lost residences and businesses of those
displaced. In some cases, the loss may be intangible as a road separates a neighborhood
into two pieces. In other cases, the loss may be due to living next to a source of air, noise,
and visual pollution.
1-23
The remaining costs for the year are:
Alternatives:
1.
To stay in the residence the rest of the year
Food: 8 months at $120/month
Total
2.
3.
To stay in the residence the balance of the first
semester; apartment for second semester
Housing: 4 ½ months x $80 apartment - $190 residence
Food: 3 ½ months x $120 + 4 ½ x $100
Total
Move into an apartment now
Housing: 8 mo x $80 apartment ± 8 x $30 residence
Food: 8 mo x $100
Total
= $960
= $170
= $870
= $1,040
= $400
= $800
= $1,200
Ironically, Jay had sufficient money to live in an apartment all year. He originally had $1,770
($1,050 + 1 mo residence food of $120 plus $600 residence contract cost). His cost for an
apartment for the year would have been 9 mo x ($80 + $100) = $1,620. Alternative 3 is not
possible because the cost exceeds Jay¶s $1,050. Jay appears to prefer Alternative 2, and
he has sufficient money to adopt it.
1-24
µIn decision-making the model is mathematical.
1-25
The situation is an example of the failure of a low-cost item that may have major
consequences in a production situation. While there are alternatives available, one appears
so obvious that that foreman discarded the rest and asks to proceed with the replacement.
One could argue that the foreman, or the plant manager, or both are making decisions.
There is no single µright¶ answer to this problem.
1-26
While everyone might not agree, the key decision seems to be in providing Bill¶s dad an
opportunity to judge between purposely-limited alternatives. Although suggested by the
clerk, it was Bill¶s decision.
(One of my students observed that his father would not fall for such a simple deception, and
surely would insist on the weird shirt as a subtle form of punishment.)
1-27
Plan A
Plan B
Plan C
Plan D
Profit
Profit
Profit
Profit
= Income ± Cost
= Income ± Cost
= Income ± Cost
= Income ± Cost
= $800 - $600
= $1,900 - $1,500
= $2,250 - $1,800
= $2,500 - $2,100
= $200/acre
= $400/acre
= $450/acre
= $400/acre
To maximize profit, choose Plan C.
1-28
Each student¶s answer will be unique, but there are likely to be common threads.
Alternatives to their current university program are likely to focus on other fields of
engineering and science, but answers are likely to be distributed over most fields offered by
the university. Outcomes include degree switches, courses taken, changing dates for
expected graduation, and probable future job opportunities.
At best criteria will focus on joy in the subject matter and a good match for the working
environment that pleases that particular student. Often economic criteria will be mentioned,
but these are more telling when comparing engineering with the liberal arts than when
comparing engineering fields. Other criteria may revolve around an inspirational teacher or
an influential friend or family member. In some cases, simple availability is a driver. What
degree programs are available at a campus or which programs will admit a student with a
2.xx GPA in first year engineering.
At best the process will follow the steps outlined in this chapter. At the other extreme, a
student¶s major may have been selected by the parent and may be completely mismatched
to the student¶s interests and abilities.
Students shouldn¶t lightly abandon a major, as changing majors represents real costs in
time, money, and effort and real risks that the new choice will be no better a fit.
Nevertheless, it is a large mistake to not change majors when a student now realizes the
major is not for them.
1-29
The most common large problem faced by undergraduate engineering students is where to
look for a job and which offer to accept. This problem seems ideal for listing student ideas
on the board or overhead transparencies. It is also a good opportunity for the instructor to
add more experienced comments.
1-30
Test marketing and pilot plant operation are situations where it is hoped that solving the subproblems gives a solution to the large overall problem. On the other hand, Example 3-1
(shipping department buying printing) is a situation where the sub-problem does not lead to
a proper complex problem solution.
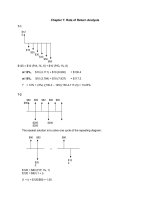
1-31
(a)
The suitable criterion is to maximize the difference between output and input. Or
simply, maximize net profit. The data from the graphs may be tabulated as follows:
Output
Units/Hour
50
100
150
200
250
Total Cost
Total Income
Net Profit
$300
$500
$700
$1,400
$2,000
$800
$1,000
$1,350
$1,600
$1,750
$500
$500
$650
$200
-$250
$2,000
Loss
$1,800
$1,600
$1,400
Cost
$1,200
$1,000
$800
Profit
Cost
$600
$400
$200
0
50
100
150
200
Output (units/hour)
250
(b) Minimum input is, of course, zero, and maximum output is 250 units/hr (based on the
graph). Since one cannot achieve maximum output with minimum input, the statement
makes no sense.
1-32
Itemized expenses: $0.14 x 29,000 km + $2,000
Based on Standard distance Rate: $0.20 x $29,000
= $6,060
= $5,800
Itemizing produces a larger reimbursement.
Breakeven: Let x = distance (km) at which both methods yield the same amount.
x
= $2,000/($0.20 - $0.14)
= 33,333 km
1-33
The fundamental concept here is that we will trade an hour of study in one subject for an
hour of study in another subject so long as we are improving the total results. The stated
criterion is to µget as high an average grade as possible in the combined classes.¶ (This is
the same as saying µget the highest combined total score.¶)
Since the data in the problem indicate that additional study always increases the grade, the
question is how to apportion the available 15 hours of study among the courses. One might
begin, for example, assuming five hours of study on each course. The combined total score
would be 190.
Decreasing the study of mathematics one hour reduces the math grade by 8 points (from 52
to 44). This hour could be used to increase the physics grade by 9 points (from 59 to 68).
The result would be:
Math
Physics
Engr. Econ.
Total
4 hours
6 hours
5 hours
15 hours
44
68
79
191
Further study would show that the best use of the time is:
Math
Physics
Engr. Econ.
Total
4 hours
7 hours
4 hours
15 hours
44
77
71
192
1-34
Saving = 2 [$185.00 + (2 x 150 km) ($0.375/km)]
= $595.00/week
1-35
Area A
Preparation Cost
= 2 x 10⁶ x $2.35 = $4,700,000
Area B
Difference in Haul
0.60 x 8 km
0.20 x -3 km
0.20 x 0
Total
= 4.8 km
= -0.6 km
= 0 km
= 4.2 km average additional haul
Cost of additonal haul/load
= 4.2 km/25 km/hr x $35/hr = $5.88
Since truck capacity is 20 m3:
Additional cost/cubic yard
= $5.88/20 m3 = $0.294/m3
For 14 million cubic meters:
Total Cost = 14 x 106 x $0.294 = $4,116,000
Area B with its lower total cost is preferred.
1-36
12,000 litre capacity
= 12 m3 capacity
Let:
L = tank length in m
d = tank diameter in m
The volume of a cylindrical tank equals the end area x length:
Volume = (Ȇ/4) d2L = 12 m3
L = (12 x 4)/( Ȇ d2)
The total surface area is the two end areas + the cylinder surface area:
S = 2 (Ȇ/4) d2 + Ȇ dL
Substitute in the equation for L:
S = (Ȇ/2) d2 + Ȇd [(12 x 4)/(Ȇd2)]
= (Ȇ/2)d2 + 48d-1
Take the first derivative and set it equal to zero:
dS/dd = Ȇd ± 48d-2 = 0
Ȇd = 48/d2
d3 = 48/Ȇ
= 15.28
d = 2.48 m
Subsitute back to find L:
L = (12 x 4)/(Ȇd2)
Tank diameter
Tank length
= 48/(Ȇ(2.48)2)
= 2.48 m
= 2.48 m ($2.5 m)
= 2.48 m ($2.5 m)
1-37
Quantity Sold per
week
300 packages
600
1,200
1,700
Selling Price Income Cost
Profit
$0.60
$0.45
$0.40
$0.33
$180
$270
$480
$561
2,500
$0.26
$598
$75
$60
$144
$136
$161
$138
$104
$210
$336
$425*
$400**
$460
* buy 1,700 packages at $0.25 each
** buy 2,000 packages at $0.20 each
Conclusion: Buy 2,000 packages at $0.20 each. Sell at $0.33 each.
1-38
Time period
0600- 0700
0700- 0800
0800- 0900
0900-1200
1200- 1500
1500- 1800
1800- 2100
2100- 2200
2200- 2300
Daily sales in
time period
$20
$40
$60
$200
$180
$300
$400
$100
$30
Cost of groceries Hourly Cost Hourly Profit
$14
$28
$42
$140
$126
$210
$280
$70
$21
$10
$10
$10
$30
$30
$30
$30
$10
$10
-$4
+$2
+$8
+$30
+$24
+$60
+$90
+$20
-$1
2300- 2400
2400- 0100
$60
$20
$42
$14
$10
$10
+$8
-$4
The first profitable operation is in 0700- 0800 time period. In the evening the 2200- 2300
time period is unprofitable, but next hour¶s profit more than makes up for it.
Conclusion: Open at 0700, close at 2400.
1-39
Alternative Price
1
2
3
4
5
6
7
8
$35
$42
$48
$54
$48
$54
$62
$68
Net Income
per Room
$23
$30
$36
$42
$36
$42
$50
$56
Outcome
Rate
No. Room
Net Income
100%
94%
80%
66%
70%
68%
66%
56%
50
47
40
33
35
34
33
28
$1,150
$1,410
$1,440
$1,386
$1,260
$1,428
$1,650
$1,568
To maximize net income, Jim should not advertise and charge $62 per night.
1-40
Profit
= Income- Cost
= PQ- C
where PQ
C
= 35Q ± 0.02Q2
= 4Q + 8,000
d(Profit)/dQ
= 31 ± 0.04Q = 0
Solve for Q
Q
= 31/0.04
= 775 units/year
d2 (Profit)/dQ2
= -0.04
The negative sign indicates that profit is maximum at Q equals 775 units/year.
Answer: Q = 775 units/year
1-41
Basis: 1,000 pieces
Individual Assembly:
Team Assembly:
$22.00 x 2.6 hours x 1,000 = $57,200
$57.20/unit
4 x $13.00 x 1.0 hrs x 1,000= $52,00 $52.00/unit
Team Assembly is less expensive.
1-42
Let t = time from the present (in weeks)
Volume of apples at any time
= (1,000 + 120t ± 20t)
Price at any time
= $3.00 - $0.15t
Total Cash Return (TCR) = (1,000 + 120t ± 20t) ($3.00 - $0.15t)
= $3,000 + $150t - $15t2
This is a minima-maxima problem.
Set the first derivative equal to zero and solve for t.
dTCR/dt
t
= $150 - $30t = 0
= $150/$30 = 5 wekes
d2TCR/dt2 = -10
(The negative sign indicates the function is a maximum for the critical value.)
At t = 5 weeks:
Total Cash Return (TCR)
= $3,000 + $150 (5) - $15 (25)
= $3,375
Chapter 2: Engineering Costs and Cost Estimating
2-1
This is an example of a µsunk cost.¶ The $4,000 is a past cost and should not be allowed to alter
a subsequent decision unless there is some real or perceived effect. Since either home is really
an individual plan selected by the homeowner, each should be judged in terms of value to the
homeowner vs. the cost. On this basis the stock plan house appears to be the preferred
alternative.
2-2
Unit Manufacturing Cost
(a) Daytime Shift = ($2,000,000 + $9,109,000)/23,000 = $483/unit
(b) Two Shifts
= [($2,400,000 + (1 + 1.25) ($9,109,000)]/46,000
= $497.72/unit
Second shift increases unit cost.
2-3
(a) Monthly Bill:
50 x 30
Total
= 1,500 kWh @ $0.086
= $129.00
= 1,300 kWh @ $0.066
= $85.80
= 2,800 kWh
= $214.80
Average Cost = $214.80/2,800
= $129.00
Marginal Cost (cost for the next kWh)
= $0.066 because the 2,801st kWh is in the
2nd bracket of the cost structure.
($0.066 for 1,501-to-3,000 kWh)
(b) Incremental cost of an additional 1,200 kWh/month:
200 kWh x $0.066
= $13.20
1,000 kWh x $0.040 = $40.00
1,200 kWh
$53.20
(c) New equipment:
Assuming the basic conditions are 30 HP and 2,800 kWh/month
Monthly bill with new equipment installed:
50 x 40
= 2,000 kWh at $0.086
= $172.00
900 kWh at $0.066 = $59.40
2,900 kWh
$231.40
Incremental cost of energy = $231.40 - $214.80 = $16.60
Incremental unit cost = $16.60/100
= $0.1660/kWh
2-4
x = no. of maps dispensed per year
(a)
(b)
(c)
(d)
(e)
Fixed Cost (I) = $1,000
Fixed Cost (II) = $5,000
Variable Costs (I)
= 0.800
Variable Costs (II)
= 0.160
Set Total Cost (I)
= Total Cost (II)
$1,000 + 0.90 x
= $5,000 + 0.10 x
thus x = 5,000 maps dispensed per year.
The student can visually verify this from the figure.
(f) System I is recommended if the annual need for maps is <5,000
(g) System II is recommended if the annual need for maps is >5,000
(h) Average Cost @ 3,000 maps:
TC(I) = (0.9) (3.0) + 1.0
= 3.7/3.0
= $1.23 per map
TC(II) = (0.1) (3.0) + 5.0
= 5.3/3.0
= $1.77 per map
Marginal Cost is the variable cost for each alternative, thus:
Marginal Cost (I)
= $0.90 per map
Marginal Cost (II)
= $0.10 per map
2-5
C = $3,000,000 - $18,000Q + $75Q2
Where C = Total cost per year
Q = Number of units produced per year
Set the first derivative equal to zero and solve for Q.
dC/dQ = -$18,000 + $150Q = 0
Q = $18,000/$150 = 120
Therefore total cost is a minimum at Q equal to 120. This indicates that production below
120 units per year is most undesirable, as it costs more to produce 110 units than to
produce 120 units.
Check the sign of the second derivative:
d2C/dQ2 = +$150
The + indicates the curve is concave upward, ensuring that Q = 120 is the point of a
minimum.
Average unit cost at Q = 120/year:
= [$3,000,000 - $18,000 (120) + $75 (120)2]/120
= $16,000
Average unit cost at Q = 110/year:
= [$3,000,000 - $18,000 (110) + $75 (120)2]/110
= $17,523
One must note, of course, that 120 units per year is not necessarily the optimal level of
production. Economists would remind us that the optimum point is where Marginal Cost =
Marginal Revenue, and Marginal Cost is increasing. Since we do not know the Selling
Price, we cannot know Marginal Revenue, and hence we cannot compute the optimum level
of output.
We can say, however, that if the firm is profitable at the 110 units/year level, then it will be
much more profitable at levels greater than 120 units.
2-6
x = number of campers
(a) Total Cost
= Fixed Cost + Variable Cost
= $48,000 + $80 (12) x
Total Revenue = $120 (12) x
(b) Break-even when Total Cost = Total Revenue
$48,000 + $960 x
= $1,440 x
$4,800
= $480 x
x = 100 campers to break-even
(c) capacity is 200 campers
80% of capacity is 160 campers
@ 160 campers x = 160
Total Cost
= $48,000 + $80 (12) (160) = $201,600
Total Revenue = $120 (12) (160)
= $230,400
Profit = Revenue ± Cost
= $230,400 - $201,600
= $28,800
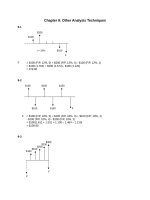
2-7
(a) x = number of visitors per year
Break-even when: Total Costs (Tugger) = Total Costs (Buzzer)
$10,000 + $2.5 x = $4,000 + $4.00 x
x = 400 visitors is the break-even quantity
(b) See the figure below:
X
0
4,000
8,000
Y1 (Tug)
10,000
20,000
30,000
Y2 (Buzz)
4,000
20,000
36,000
Y1 (Tug)
Y2 (Buzz)
$40,000
Y2 = 4,000 + 4x
$30,000
Y1 = 10,000 + 2.5x
$20,000
$10,000
Tug
Preferred
0
2,000
Buzz
Preferred
4,000
6,000
Visitors per year
8,000
2-8
x = annual production
(a) Total Revenue = ($200,000/1,000) x = $200 x
(b) Total Cost
= $100,000 + ($100,000/1,000)x
= $100,000 + $100 x
(c) Set Total Cost = Total Revenue
$200 x = $100,000 + $100 x
x = 1,000 units per year
The student can visually verify this from the figure.
(d) Total Revenue = $200 (1,500)
= $300,000
Total Cost
= $100,000 + $100 (150
= $250,000
Profit
= $300,000 - $250,000
= $50,000
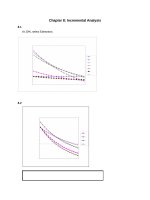
2-9
x = annual production
Let¶s look at the graphical solution first, where the cost equations are:
Total Cost (A) = $20 x + $100,000
Total Cost (B) = $5 x + $200,000
Total Cost (C) = $7.5 x + $150,000
[See graph below]
Quatro Hermanas wants to minimize costs over all ranges of x. From the graph we see that
there are three break-even points: A & B, B & C, and A & C. Only A & C and B & C are
necessary to determine the minimum cost alternative over x. Mathematically the break-even
points are:
A & C: $20 x + $100,000
B & C: $5 x + $200,000
= $7.5 x + $150,000
= $8.5 x + $150,000
x = 4,000
x = 20,000
Thus our recommendation is, if:
0 < x < 4,000
choose Alternative A
4,000 < x < 20,000
choose Alternative C
20,000 < x 30,000 choose Alternative B
X
0
10
20
30
A
100
300
500
700
B
200
250
300
350
C
150
225
300
375
A
B
C
$800
YA = 100,000 + 20x
$600
YC = 150,000 + 7.5x
$400
YB = 200,000 + 5x
$200
A
Best
0
5
B Preferred
BE = 25,000
C Preferred
BE = 100,000
10 15
20 25
30
Production Volume (1,000 units)
2-10
x
= annual production rate
(a) There are three break-even points for total costs for the three alternatives
A & B: $20.5 x + $100,000 = $10.5 x + $350,000
x = 25,000
B & C: $10.5 x + $350,000 = $8 x + $600,000
x = 100,000
A & C: $20 x + $100,000
x = 40,000
= $8 x + $600,000
We want to minimize costs over the range of x, thus the A & C break-even point is not of
interest. Sneaking a peak at the figure below we see that if:
0 < x < 25,000
choose A
25,000 < x < 80,000
choose B
80,000 < x < 100,000
choose C
(b) See graph below for Solution:
X
0
50
100
150
A
100
1,125
2,150
3,175
B
350
875
1,400
1,925
C
600
1,000
1,400
1,800
A
B
C
YA = 100,000 + 20.5x
$2,500
YB = 350,000 + 10.5x
$2,000
YC = 600,000 + 8x
$1,500
$1,000
$500
A
0
B Preferred
BE = 25,000
C Preferred
BE = 100,000
50
100
150
Production Volume (1,000 units)
2-11
x = annual production volume (demand) = D
(a) Total Cost
= $10,875 + $20 x
Total Revenue = (price per unit) (number sold)
= ($0.25 D + $250) D and if D = x
= -$0.25 x2 + $250 x
(b) Set Total Cost = Total Revenue
$10,875 + $20 x
= -$0.25 x2 + $250 x
2
-$0.25 x + $230 x - $10,875 = 0
This polynomial of degree 2 can be solved using the quadratic formula:
There will be two solutions:
x = (-b + (b2 ± 4ac)1/2)/2a = (-$230 + $205)/-0.50
Thus x = 870 and x = 50. There are two levels of x where TC = TR.
(c) To maximize Total Revenue we will take the first derivative of the Total Revenue
equation, set it equal to zero, and solve for x:
TR = -$0.25 x2 + $250 x
dTR/dx = -$0.50 x + $250 = 0
x = 500 is where we realize maximum revenue
(d) Profit is revenue ± cost, thus let¶s find the profit equation and do the same process as in
part (c).
Total Profit = (-$0.25 x2 + $250 x) ± ($10,875 + $20 x)
= -$0.25 x2 + $230 x - $10,875
dTP/dx = -$0.50 x + $230 = 0
x = 460 is where we realize our maximum profit
(e) See the figure below. Your answers to (a) ± (d) should make sense now.
X
0
250
500
750
1,000
Total Cost
$10,875
$15,875
$20,875
$25,875
$30,875
Total Revenue
$0
$46,875
$62,500
$46,875
$0
Total Cost
Total Revenue
TR = 250 x ± 0.25x2
$60,000
$40,000
Max
Profit
Max
Revenue
BE = 870
TC = 10,875 + 20x
$20,000
BE = 50
0
200
400
600
Annual Production
800
1,000
2-12
x = units/year
By hand
$1.40 x
x
= Painting Machine
= $15,000/4 + $0.20
= $5,000/1.20 = $4,167 units
2-13
x = annual production units
Total Cost to Company A
= Total Cost to Company B
$15,000 + $0.002 x = $5,000 + $0.05 x
x = $10,000/$0.048
= 208,330 units
2-14
(a)
$2,500
$2,000
Total
Cost &
Income
TC = 1,000 + 10S
$1,500
$1,000
Breakeven
Total Income
$500
0
20
Profit = S ($100 ± S) - $1,000 - $10 S
40
60
Sales Volume (S)
80
100
= -S2 + $90 S - $1,000
(b) For break-even, set Profit = 0
-S2 + $90S - $1,000 = $0
S
= (-b + (b2 ± 4ac)1/2)/2a = (-$90 + ($902 ± (4) (-1) (-1,000))1/2)/-2
= 12.98, 77.02
(c) For maximum profit
dP/dS = -$2S + $90 = $0
S = 45 units
Answers: Break-even at 14 and 77 units. Maximum profit at 45 units.
Alternative Solution: Trial & Error
Price
Sales Volume
$20
$23
$30
$50
$55
$60
$80
$87
$90
80
77
70
50
45
40
20
13
10
Total
Income
$1,600
$1,771
$2,100
$2,500
$2,475
$2,400
$1,600
$1,131
$900
Total Cost
Profit
$1,800
$1,770
$1,700
$1,500
$1,450
$1,400
$1,200
$1,130
$1,100
-$200
$0 (Break-even)
$400
$1,000
$1,025
$1,000
$400
$0 (Break-even)
-$200
2-15
In this situation the owners would have both recurring costs (repeating costs per
some time period) as well as non-recurring costs (one time costs). Below is a list of
possible recurring and non-recurring costs. Students may develop others.
Recurring Costs
Non-recurring costs
- Annual inspection costs
- Initial construction costs
- Annual costs of permits
- Legal costs to establish rental
- Carpet replacement costs
- Drafting of rental contracts
- Internal/external paint costs
- Demolition costs
- Monthly trash removal costs
- Monthly utilities costs
- Annual costs for accounting/legal
- Appliance replacements
- Alarms, detectors, etc. costs
- Remodeling costs (bath, bedroom)
- Durable goods replacements
(furnace, air-conditioner, etc.)
2-16
A cash cost is a cost in which there is a cash flow exchange between or among parties. This
term derives from µcash¶ being given from one entity to another (persons, banks, divisions,
etc.). With today¶s electronic banking capabilities cash costs may or may not involve µcash.
µBook costs¶ are costs that do not involve an exchange of µcash¶, rather, they are only
represented on the accounting books of the firm. Book costs are not represented as beforetax cash flows.
Engineering economic analyses can involve both cash and book costs. Cash costs are the
before-tax cash flows usually estimated for a project (such as initial costs, annual costs, and
retirement costs) as well as costs due to financing (payments on principal and interest debt)
and taxes. Cash costs are important in such cases. For the engineering economist the
primary book cost that is of concern is equipment depreciation, which is accounted for in
after-tax analyses.
2-17
Here the student may develop several different thoughts as it relates to life-cycle costs. By
life-cycle costs the authors are referring to any cost associated with a product, good, or
service from the time it is conceived, designed, constructed, implemented, delivered,
supported and retired. Firms should be aware of and account for all activities and liabilities
associated with a product through its entire life-cycle. These costs and liabilities represent
real cash flows for the firm either at the time or some time in the future.
2-18
Figure 2-4 illustrates the difference between µdollars spent¶ and µdollars committed¶ over the
life cycle of a project. The key point being that most costs are committed early in the life
cycle, although they are not realized until later in the project. The implication of this effect is
that if the firm wants to maximize value-per-dollar spent, the time to make important design
decisions (and to account for all life cycle effects) is early in the life cycle. Figure 2-5
demonstrates µease of making design changes¶ and µcost of design changes¶ over a project¶s
life cycle. The point of this comparison is that the early stages of the design cycle are the
easiest and least costly periods to make changes. Both figures represent important effects
for firms.
In summary, firms benefit from spending time, money and effort early in the life cycle.
Effects resulting from early decisions impact the overall life cycle cost (and quality) of the
product, good, or service. An integrated, cross-functional, enterprise-wide approach to
product design serves the modern firm well.
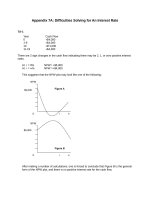
2-19
In this chapter, the authors list the following three factors as creating difficulties in making
cost estimates: One-of-a-Kind Estimates, Time and Effort Available, and Estimator
Expertise. Each of these factors could influence the estimate, or the estimating process, in
different scenarios in different firms. One-of-a-kind estimating is a particularly challenging
aspect for firms with little corporate-knowledge or suitable experience in an industry.
Estimates, bids and budgets could potentially vary greatly in such circumstances. This is
perhaps the most difficult of the factors to overcome. Time and effort can be influenced, as
can estimator expertise. One-of-a-kind estimates pose perhaps the greatest challenge.
2-20
Total Cost = Phone unit cost + Line cost + One Time Cost
= ($100/2) 125 + $7,500 (100) + $10,000
= $766,250
Cost to State
= $766,250 (1.35)
= $1,034,438
2-21
Cost (total) = Cost (paint) + Cost (labour) + Cost (fixed)
Number of Cans needed = (6,000/300) (2)
= 40 cans
Cost (paint)
= (10 cans) $15
= $150.00
= (15 cans) $10
= $150.00
= (15 cans) $7.50
= $112.50
Total
= $412.50
Cost (labour) = (5 painters) (10 hrs/day) (4.5 days/job) ($8.75/hr)
= $1,968.75
Cost (total)
= $412.50 + $1,968.75 + $200
= $2,581.25
2-22
(a) Unit Cost = $150,000/2,000 = $75/ft2
(bi) If all items change proportionately, then:
Total Cost
= ($75/ft2) (4,000 ft2) = $300,000
(bii) For items that change proportionately to the size increase we multiply by: 4,000/2,000
= 2.0 all the others stay the same.
[See table below]
Cost
item
1
2
3
4
5
6
7
8
2,000 ft2 House Cost
Increase
($150,000) (0.08) = $12,000
($150,000) (0.15) = $22,500
($150,000) (0.13) = $19,500
($150,000) (0.12) = $18,000
($150,000) (0.13) = $19,500
($150,000) (0.20) = $30,000
($150,000) (0.12) = $18,000
($150,000) (0.17) = $25,500
x1
x1
x2
x2
x2
x2
x2
x2
Total Cost
4,000 ft2
House Cost
$12,000
$22,500
$39,000
$36,000
$39,000
$60,000
$36,000
$51,000
= $295,500
2-23
(a) Unit Profit
= $410 (0.30) = $123 or
= Unit Sales Price ± Unit Cost
= $410 (1.3) - $410 = $533 - $410 = $123