TÓM tắt TIẾNG ANH nghiên cứu sự biến đổi và giá trị nồng độ LH trong tiên lượng điều trị kích thích phóng noãn bệnh nhân vô sinh do buồng trứng đa nang bằng clomiphene citrate đơn thuần và kết
Bạn đang xem bản rút gọn của tài liệu. Xem và tải ngay bản đầy đủ của tài liệu tại đây (375.79 KB, 25 trang )
1
1. INTRODUCTION
Infertility is defined as inability to conceive after 12 months of
unprotected sex. Infertility is a major social problem, a complex disease
in gynecological diseases, for many reasons. Polycystic ovary syndrome
is one of the causes of ovarian induction infertility as classified by the
World Health Organization. The prevalence of Polycystic ovary
syndrome is from 6% to 10% of all women in childbearing age under the
NIH standard and about 15% under the Rosterdam standard 2003.
Polycystic ovary syndrome is manifested by a variety of clinical
symptoms and laboratory findings. Among them, high LH is always
described as a common symptom and is valuable in the diagnosis and
prognosis of treatment. Fauser (1994) reported a 60% increase in LH
elevations in polycystic ovaries.
According to the WHO, the 2012 ESHRE conference report
addresses the major disorders of Polycystic ovary syndrome: Inability to
induce abnormal LH levels in response to changes in estrogen, LH
receptor blockers, LH / FSH imbalance, relative lack of FSH, no
ovulation, and inappropriate increase of LH. Among these disorders,
most disorders are related to LH.
The first treatment for Polycystic ovary syndrome is clomiphen
citrate alone. However, about 30% of patients did not respond to this
therapy with time to determine whether it was 3 months of continuous
treatment with an increased dose. It is a long time with infertile patients,
greatly affecting the psychological and treatment effect next. According
to an analytical study by Susanne et al. (2012), a total of 28 studies found
that 52-76% of patients with COPD experienced psychological or
depression problems when they knew they had COPD. treatment.
Therefore, the search for identifying prognostic factors shortening
treatment time and improving therapeutic efficacy are always of interest
to researchers and clinicians..
Increased LH is both a cause and a pathological consequence.
Research on LH levels, its effects have always been of concern and
controversial for many years. In the Vietnamese studies, it was found that
in the group of patients with hyperthyroidism, LH elevations were higher
than those of foreign patients in foreign studies. Therefore, we conducted
a study entitled "Study on the variability, value of LH levels in the
prognosis of patients induced ovarian polycystic ovary syndrome by
2
clomiphene citrate alone and combined with FSH" with the detail
objectives:
1. To describing of LH levels, LH / FSH ratio in infertile patients with
polycystic ovary syndrome.
2. To compare clinical and subclinical characteristics in patients not
responding to clomiphene citrate alone in these patients.
3. To describing changes in LH levels in patients with and without
clomiphene citrate monotherapy and clomiphene citrate combination
with FSH.
2. Timeliness of the thesis
Ovarian cysts have been studied by scientists around the world for
nearly 80 years on the diagnosis, treatment, pathogenesis and
pathogenesis. Only with the keyword "PCOS" on the PubMed electronic
library has resulted in 9151 related scientific research and this number
varies day by day, in part expressing great interest in this syndrome.
Complex and multi-factorial complications make management and
counseling difficult for patients. The latest research by Rowlands et al.
(2016) with 11,238 young Australian women in the three years (2012 2014) found that up to 60% had mild to severe traumatic brain injury. As
such, it is a burden on society in general and the health sector in particular.
Studies in Vietnam focus primarily on the results of treatment methods.
The levels of LH released as in Vietnam are associated with elevated LH
levels and low BMI levels in many studies. Some of the comments in the
studies mentioned the link between LH levels, LH / FSH rates and
treatment efficacy, but were not discrete. Therefore, studies of general
neuroscience and our own research in particular are always necessary to
help clinicians gain new insights into management and prognosis when
approaching patients with the Ovarian cysts syndrome.
3. The scientific contributions of the thesis
The thesis reaffirms the role of LH in the prognosis of ovarian
hyperstimulation in patients with polycystic ovary as well as changes in
LH during treatment. In addition, the thesis also offers different
characteristics of patients with bronchial asthma in Vietnam than in other
continents. This helps create a new perspective on access to treatment for
patients with in Polycystic ovary syndrome Vietnam.
4. Structure of thesis
The dissertation consists of 106 pages (excluding annexes and
references) including 2-page introduction, 36-page literature review, 10
pages of research methodology, 25-page study results, 30 pages of
discussion, 2 pages summary and 1 page recommendation.
3
Chapter 1
LITERATURE REVIEW
•
1.1. Diagnosis of polycystic ovaries
1.1.1. Clinical symptoms:
• Menstrual irregularities
Ovarian dysfunction is the cause of infertility in patients with
polycystic ovary syndrome, dysmenorrhea is the most characteristic
feature of this group of patients.
• Shaggy hair, acne:
Shaggy hair is an overgrowth of facial hair or body hair that can
appear on the face, chest, lower abdomen, back, arms, and legs. The hairs
in many parts of the body turn into adult hairs, causing hair loss. In
addition to causing hair loss, the increase in testosterone results in
increased DHT (Dyhydro-Testosterone). The effect of 5α-reductase
stimulates the proliferation of follicular horn cells, which narrows the
sebaceous glands into the skin and increases the secretion of the
sebaceous gland leading to plaque deposition, which facilitates the
growth of acne.
Overweight
According to WHO (1995), obesity is an excessive and abnormal
accumulation of fat in one body or whole body that affects health. Obesity
prevalence accounts for 30-50% of polycystic ovary women. But in the
course of the study, the authors found a difference between the BMI of the
patients in Europe and Asia. In Vietnam, the average BMI in the study of Bui
Minh Tien (2010) was 20.4 and Vuong Thi Ngoc Lan (2009) found that only
6.6% of patients with BMI had a large BMI more than 25.
1.1.2. Subclinical symptoms:
• Endocrine measurement
Studies show that rates of LH increase are seen in 44-82% of people
with ASD. Likewise, an increase in LH / FSH rates occurs in 50-68% of
cases. Limit values are given when it comes to the androgen-specific
criteria included:
LH > 10mUI/ml
LH/FSH > 2
Testosterone > 1.5 ng/ml
• Multiple follicular ovaries on ultrasound:
The criteria for determining multiple follicular ultrasound images are
as follows: There are over 12 capsules in size from 2 to 9 mm, or an
ovary volume greater than 10 cm3, without need for follicular
distribution or ovarian tissue density and the above characteristics
expressed in at least one ovary.
4
• Insulin resistance or glucose tolerance disorder.
Insulin resistance is an increase in insulin levels or a decrease in
insulin sensitivity to the target organ. Insulin resistance rates vary
between 25 and 70% among ethnic and diagnostic methods in patients
with polycystic ovaries.
1.1.3 Diagnostic standards:
Worldwide, there are 3 NIH / NICHD diagnostic criteria for
diagnosis, ESHRE / ASRM and Androgen Excesse and PCOS Society.
Clinicians use the standard in the Rotterdam Consensus (2003).
Patients were diagnosed with two-thirds of the symptoms
- Menstrual irregularities: amenorrhea or dysmenorrhea.
- Androgens: manifested in clinical or subclinical symptoms.
- Ultrasound: picture of polycystic ovary.
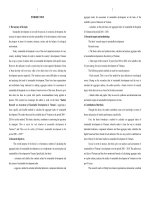
1.2. Mechanism of disease
The mechanism of normal hormonal activity is shown in the
following diagram:
Hypothalamus
Pituitary
↑ estrogen
↑ estrogen, inhibin
↑ FSH, LH
Feedback +
Feedback -
Figure 1.3. Mechanism of activity down the hill - pituitary - ovary
(Source: Internet)
Thus, the increase in LH levels will depend on the increase in
GnRH. The hypothalamus receives information increasing GnRH
through increased estrogen and progesterol levels. LH and FSH increase
leading to follicular development, estrogen increase, and feedback to the
hypothalamus to form peak. Lh induces ovulation when matured. It has
been shown that there is neurological dysfunction in polycystic ovaries
5
due to a number of causes leading to increased LH. In polycystic ovary
syndrome, LH increases in 44-82% of patients with polycystic ovary
syndrome. LH increases the production of androgens by the ovarian
cortex of the ovaries and stimulates the ovaries to produce estrogen,
testosterone that produces tumor changes in the ovaries. This leads to the
clinical manifestations of polycystic ovaries.
In addition to the causes of hyperlipidemia, there are other causes
that do not respond to insulin (obesity, diabetes mellitus ...) and other
causes of androgen hyperplasia (renal disease). However, the role of LH
in the pathogenesis of polycystic ovary syndrome is still to be seen.
1.3. Treatment of infertility in patients with polycystic
ovary syndrome
1.3.1 Weight loss and exercise
1.3.2. Clomiphen citrate
It began to be used in 1961 after the publication of Greenblatt. In
1967 the US FDA approved the use. The drug by taking estrogen in place
in the hypothalamic estradiol receptors leading to estrogen receptors in
the hypothalamic-hypopnegative pituitary gland should increase the
GnRH secretion leading to increased gonadotropin secretion.
Simple CC treatment: Use the 2nd to 6th day of the menstrual period.
Doses of 50 - 150 mg / 24h. The initial dose is 50mg / 24h. If not met the
next cycle will use 100mg / 24h to 150mg / 24h. According to the 2004
NICE standard, when the maximum dose of 150 mg / 24h was not
developed follicle was diagnosed not responding clomiphene citrate.
In the absence of CC, there are a number of further treatments
for continued use of CC: Simple dosing regimens or increased
duration of use or combination regimens with Prednisone, Vit E,
Metformin or additional FSH from the 6th day of the menstrual
cycle at a dose of 50UI / day continuously until maturation.
Co-ordinate regimen: The first 5 days from day 2 to day 7 of the
menstrual cycle followed by the addition of FSH from the 6th day of the
menstrual period at a dose of 50UI / day continuously until matured.
1.4. Study on the relationship
treatment in polycystic ovary
1.4.1. Vietnam
between LH and
6
Studies in Vietnam focus on treatment outcomes and treatment
options. LH levels are given as a diagnostic criterion in the studies. One
characteristic of the group of PW patients in Vietnam is related to high
levels of LH and low BMI in many studies. Some of the comments in the
studies mentioned the link between LH levels, LH / FSH rates and the
therapeutic efficacy but not spontaneous.
1.4.2. Worldwide
Polycystic ovary syndrome has been studied by scientists around the
world for nearly 80 years on the criteria of diagnosis, treatment,
pathogenesis and pathogenesis. However, the two major mechanisms
underlying the cause of bronchial asthma are due to increased LH and no
insulin response. Gradually, the trend for researchers to separate the
patients with polycystic ovary syndrome is two-fold with discriminating
boundary-related BMI.
Analysis of the values of symptoms in the diagnostic criteria for
polycystic ovary syndrome. The researchers conducted separate studies that
considered important symptoms such as LH and high LH / FSH ratio.
obesity, polycystic ovary picture, insulin resistance, testosterone. Based on
the symptomatic value, researchers try to find the best predictors for
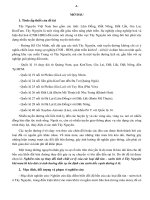
treatment ability and prognosis. Notably, the study by Babak Imani et al.
(2002) provides a round-robin predictor of success in CC:
Figure 1.10: The rotation predicts the chances of
success when treating polycystic ovaries by CC
7
Source: Babak Imani, M.D, Marinus J.C Eijkemans, and all. (2002).
Anomogram to pedict the probability of live birth after CC induction of
ovulation in normogonadotropic oligoamenorrheic infertility. Fertility
and sterility. Vol 77. No 1. 91-98.
Similarly, Johannes Ott et al. (2009) analyzed over 100 patients who
found a threshold value of LH = 12.1 UI / l for treatment of polycystic
ovaries by means of ovarian firing with sensitivity 88.7%, specificity
75.9%, positive diagnosis 90%, negative diagnosis 73.3%. In addition,
too high or too low LH levels have been shown to affect ovulation
quality, which reduces fertility and increases the risk of miscarriage.
Although there are many opposite views, clinicians hope to find a
"window" value LH to achieve the highest efficiency in the regulation of
reproduction.
Chapter 2
SUBJECTS AND METHODOLOGY
2.1. Location and time of study
- Location: Department of Obstetrics - Central Obstetric Hospital.
- Time: October 2011 to October 2015.
2.2. Subjects
2.2.1. Criteria selection
-
Females, infertility, age of 19 – 35.
To be diagnosed with HCS at the Rotterdam Consensus Meeting (2003)
FSH < 10 UI/l
Pelvic hysterectomy: normal uterus, two catheter tubes, Cotte (+)
Patients with normal semen collection in 1999 or 2010 of the
World Health Organization.
2.2.2. Exclusion criteria
- Infertility patients do not meet the criteria of choice .
- A history of combined oral contraceptives or estrogen , metformin
in the last three months.
- History of treatment to stimulate ovulation, IUI, IVF.
- History of infertility endoscopic surgery.
- A history of allergy to the drug used in the study.
8
- Other internal and external diseases.
- Patients did not follow the treatment protocol of the study.
2.3. Methodology
2.3.1. Study design
- Our study is longitutional study
2.3.2. Sample size
- Formula for calculating sample size:
n = Z12−α / 2
n: sample size
s: standard deviation
α: Level of statistical significance
s2
( X .ε ) 2
X : Average value from previous research or trial study
ε: The relative deviation between sample and population parameters.
Z α/2: The value Z obtained from the Z table for the selected value.
According to Mohamad S Abdellah (2011) mean LH levels in the
polycystic ovary group did not respond to clomiphen citrate:
We used α =0.05→
Z1- α/2 =1,96
S = 5,2
=14,1
ε = 0,07
n =107 bệnh nhân.
During the study period we obtained 118 patients.
2.3.3 Research process
Patients undergo follow-up procedures under Circular No. 12/2012 /
TT-BYT on the examination and diagnosis of infertility for each
infertility couple.
Treatment of clomiphen citrate
9
•
- Starting Conditions:
• Patient satisfaction criteria selection criteria.
• At day 2 ultrasonography does not have residual cysts.
- Use of the drug from day 2 to the 6th day of the menstrual period
with increasing dosage regimen.
- Use Progynova from day 7 to 11 period
- Ultrasound of the vaginal probe on the 10th day of period
- The next ultrasound changes depending on the size of the follicle
at the previous ultrasonography.
- Use Gonadotropin 5000UI, intramuscularly when mature follicle
size (≥ 18 mm).
- IUD or natural Gonadotropin 36 hours after injection
- Get back in 2 weeks.
- Record the results of treatment:
Response to treatment: when the follicle develops to size ≥ 18 mm
Does not respond to treatment: no dominant cysts appear on
the 16th day of period
Pregnancy: hCG beta test ≥ 100 mUI/ml.
- Treatment dose:
Start: 50mg/ ngày
• Dose of 100mg / day if treatment period 50mg / day does
not respond to treatment.
• Dosage 150 mg / day if treatment period with 100mg / day
not meet.
Combination of CC and FSH:
- Indications: If the patient does not respond to treatment with CC
after 3 consecutive cycles of therapy, the dose is increased.
- Procedure:
• Take CC from 2 to 6 months with a dose of 100mg / day.
• Inject FSH (Puregon) at 50 UI / day from day 7 or 8 onward
until the date of maturation. After 7 days of maintenance, the
dose of unchanged follicles will increase to 75 UI / 24h.
• Follicle tracking up to size 18 mm, Gonadotropin 5000UI
injection. Guideline or designation of IUI after 36 hours of
injections.
See patients again in 2 weeks
Record the same treatment results.
10
Response to treatment: when the follicle develops and grows
Does not respond to treatment: no dominant cysts appear
Pregnancy: hCG beta test ≥ 100 mUI / ml after IUI for 2 weeks
Record total days of treatment
Record the total dose of FSH.
Study subjects: Divided into two groups:
Group responds to CC treatment: Follicles develop after
doses of CC 50 or 100 or 150 mg / day.
Group does not respond CC: no follicle develops after 3
doses of CC. This group will continue to treat CC + FSH.
2.3.4 Flowchart of the study
11
12
2.3.5. Variables
- Characteristics of subjects: BMI, infertility, menstrual cycle, menstrual
period, longest menstrual period, hairy, acne, ovarian follicular
ultrasonography, average number of follicles.
Pre-treatment hormone levels: Average concentration of LH, FSH,
estrogen, testosterone, oestradiol, progesterone, LH / FSH ratio.
- Hormone levels after treatment: LH, FSH, estrogen, testosterol,
oestradiol, progesterol, LH / FSH ratio.
- Variable treatment response: oocyte number on treatment, response to
treatment.
2.3.6 Data analysis
Epidata software and SPSS 16.0 software were used in data entry,
processing and analysis.
- Descriptive statistics
- Logistic regression analysis is variable and multivariate
- ROC curve
The variables using the ROC curve when treatment prophylaxis met
or not responded to Clomiphene citrate: absolute value for LH, LH / FSH
ratio.
- We used: Test X2, T test, Fisher’s Exact test, Paired – Sample T test
2.4 Ethical issues
- Carry out rigorous research, strictly follow the research process.
- Always put the patient's interests on the research interests
- The regimen used in the clinic of the Central Obstetric Hospital.
- Procedures for examination and treatment of infertility according to the
circulars and guidance of the Ministry of Health.
- Drugs used in the study are drugs that have been licensed for circulation
in Vietnam and are being used at the National Obstetric Hospital during
the study period.
13
Chapter 3
RESULTS
Rate of non-response CC: 34.75%. Patients who did not respond to
CC in the study were 41 patients. But only 23 patients participated in CC
+ FSH treatment and included 30 treatment cycles.
Rate of ovulation 95,65%, pregnancy rate: 10/23 = 43.48%.
3.1. LH levels in infertile patients have polycystic ovaries
Table 3.2: Concentration of LH, FSH, LH / FSH on average
HORMON
Average
LH
14,48 ±5,32
FSH
6,06 ± 1,52
LH/FSH
2,49 ± 1,00
Concentrations of LH ≥ 10 accounted for 81.4%, LH > 14 concentrations
of 52.6%.
- Distribution of LH / FSH
Table 3.4: Distribution of LH / FSH
LH/FSH
< 1,5
1,5 – 2,0
>2
Tổng
N
16
26
76
118
%
13,56
22,03
64,40
100%
Of these, 64.4% had more than 2.
- Comparison of mean LH concentrations according to hair growth:
- Comparison of average LH levels according to acne characteristics:
There was no difference in LH levels when compared to each group.
- Comparison of mean LH levels of patients with infertility I and II:
The patients with the rate of infertility I occupied the majority to 84.75%.
Initial findings showed that the mean LH level of the infertile group was
higher than the inferiority group I. However, the T-test was not
significantly different from p = 0.37.
Comparison of mean LH levels for patients with a testosterone
concentration less than or greater than 1 ng / mL: The mean LH level of
the testosterone group <1 was 13.94 lower than the LH level in the
testosterone group ≥ 1 was 14.8 but the difference was not statistically
significant with p = 0.117.
- Mean LH level with menstrual characteristics: The menstrual
disorders in patients with polycystic ovaries in the study were 94.9%,
very few normal menstrual women and the common menstrual period
14
was 83.90%. Menstruating patients had lower mean LH than the other
groups, but only six patients had a statistically significant difference.
- There is a linear relationship between LH concentration and
weight: The higher the weight, the lower the LH concentration and vice
versa by the equation
LH = 22,83 – 0,167 x weight (kg)
R = 0,223 R2 = 0,050
- Comparison of mean LH concentrations in polycystic ovary
ultrasonography: 69 patients with polycystic ovaries showed 58.47% of
polycystic ovaries. Analysis and comparison of mean LH for two groups of
patients with and without polycystic ovary syndrome on T-test showed
statistically significant differences in mean LH for p = 0, 0092. Thus, the group
of patients with polycystic ovaries showed an average LH level (13.78 UI / l)
lower than that of patients with normal ovarian ultrasonography (15.45UI / l).
3.2. Clinical and subclinical patients do not respond to CC alone
3.2.1. Clinical characteristics
- Average menstrual period: 14.51 ± 1.75 (age)
- Average age: 25.79 ± 5.2
- The longest day of economic loss: 139.48 ± 89 (day)
- Average BMI = 21.27 ± 3.31
In the 118 study participants, only four obese patients were included
in the 41 patients who did not respond to CC alone.
- Clinical features:
• Analyzes of the relationship between hairy hens and testosterone
levels were not associated with p = 0.605 using Fisher's Exact test.
• The relationship between the two clinical characteristics of hair and
acne was not statistically significant with Fisher's Exact test with p = 1.
3.2.2. Subclinical characteristics
Table 3.17: The average hormone level of the group does not
respond to CC
HORMON
Average
LH
14,79 ± 4,92
FSH
6,23 ± 1,57
LH/FSH
2,44 ± 0,78
Testosterone
1,41 ± 0,54
Estradiol
47,05 ± 19,45
Progesterone
1,71 ± 0,89
15
- Ultrasonography showed polycystic ovaries: 63.41% of patients
who did not respond to CC showed polycystic ovarian ultrasonography,
36.59% were normal ovary picture.
3.2.3. Comparison of clinical characteristics between treatment
response group and CC and non CC response group
BMI of 2 groups
Age at onset of menstrual periods was moderate in both groups:
Average number of menopause days in 2 groups
Ultrasound features a BTN image
There was no difference in the characteristics between the two
groups and did not respond to CC.
3.3. Changes in LH levels in patients responding to and not
responding to CC alone and combination therapy with FSH
3.3.1. LH levels and LH / FSH mean before treatment of the two groups
- Average LH before treatment: The results showed that the mean LH
of the group responding to CC was 14.31 compared to the mean LH for
the nonresponding group of 14.79 There was a difference in mean LH
levels between the two treatment groups with CC and those without CC
with p = 0.628 (independent test).
- The mean LH / FSH index of the two groups was not different when
comparing the two meanings with the independent T test with p = 0.767.
3.3.2. Analysis of the distribution of LH levels in the two treatment
groups
The same distribution of LH levels before treatment of the
responding group and the group did not respond to treatment.
3.3.3. Analyze the ROC curve
Based on the analysis, the area value <0.6 (0.520) was not
statistically significant, no cut-off point of LH concentration was found
in the prognosis response to CC.
Continuing analysis of the ROC curve with the LH / FSH index, the
area obtained with 0.495 was also less than 0.6, and the cutoff value was
not found in the treatment.
3.3.5 Comparison of treatment response according to LH threshold
Vì thế, kiểm định X2 không có sự khác biệt giữa các nhóm giá trị
nồng độ LH với tỷ lệ đáp ứng điều trị CC (p = 0,683).
3.3.6. Linear regression analysis of LH interrelations with factors:
Single-regression analysis revealed a statistically significant
relationship between LH levels and FSH levels, estrogen expressed in the
following equations:
16
[LH] = 0,09 x [oestrogen] + 10,06
[LH] = 1,35 x [FSH] + 6,31
3.3.7. Logistic regression analysis:
There is a linear relationship between LH levels and the probability
of not responding to treatment through the following equation:
Ln( = -0,881 + 0,017 x LH
= e -0,881+0,017xLH hay odd = e -0,881+0,017xLH
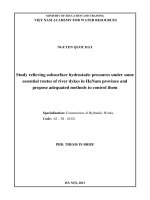
3.3.8. Changes in LH levels during treatment
The mean initial LH level of the two treatment groups was not
significantly different. After the CC dose of 50mg / 24h, there are 10
patients with non-quantitative LH pregnancy LH, the remaining patients
are measured LH next cycle. Mann Whitney test showed that the
difference in LH levels between the two groups was statistically
significant at p <0.01. Continuous T-peptide pairing of the mean LH
concentrations of the two response groups, unresponsive to the CC 50 mg
dose before and after treatment showed statistically significant
differences with p <0.01. There is a clear reduction in LH (5.94 UI / L)
levels if the ovulation period is clear.
Figure 3.8: Comparison of mean LH before and after treatment
in the CC50 group
In 81 patients who did not respond to CC 50 mg / 24h, continued
treatment with CC 100 mg / 24 had 35 patients responding to
treatment and 46 patients not responding to this dose. At 100 mg of
CC, there was no difference in LH levels between treatment groups
(12.49 and 13.17UI/L).
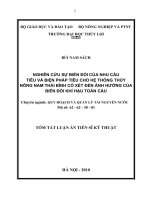
After treatment, there were 35 patients with ovulation, of which
14 were pregnant, so the total number of patients treated with LH after
treatment was reduced to 21 patients. When the amount of LH detected
after treatment of the LH level of the group responding to CC 100mg
(6.91UI / l) was significantly lower than the LH level of the unresponsive
group (13.39UI / l) Statistical significance with p <0.01.
Figure 3.9: Comparison of mean LH before and after treatment
in the CC100 group
17
46 patients who did not respond to the CC100 mg treatment course
were treated with CC150mg for 5 patients with ovulation, 41 for nonresponders and 5 for pregnant women. The post-treatment response of the
treatment group to this dose to continue the comparison.
After that, 41 patients who did not respond to three courses of
incremental therapy were referred to patients who did not respond to CC
and switched to CC + FSH treatment with 22/23 patients treated with
olanzapine treatment, 10 patients pregnant women.
After treatment, 10 patients were pregnant, no patients did not
respond to treatment. Twelve patients with undiagnosed pregnancies
were further quantified with LH values of 6.51 ± 3.34 IU / l.
Remarks: T test showed that the difference in mean LH level after
treatment in the ovarian and ovulatory group was statistically significant
at p <0.05. There was a reduction in LH to the normal level when
ovulation occurred in the previous period.
Chapter 4
DISCUSSION
4.1. LH levels in infertile patients have polycystic ovaries
The mean value of LH in our study was 14,475 mUI / ml with a LH
> 10 mUI/ml concentration of 81.4%. According to physiology, the mean
daily blood glucose concentration in day 2 - 3 in the Vietnamese
population is 3.94 - 7.66 IU / L. Thus, the average LH level of the group of
patients with polycystic ovaries is higher than that of normal human LH.
By comparing the mean LH levels with other studies, the mean LH
level was higher than the normal range, but the distribution of LH levels
was not the same in the studies depending on the other clinical features
involved. such as BMI, duration of disability, age, and other clinical
features.
LH is elevated due to three major causes: an increase in the activity
of the pituitary gland due to stimulation from GnRH secreted by the
hypothalamus, due to the inverse harmonic regulation from high levels of
chronic estrogen and metabolic disorders. Obesity changes the LH
pattern. It was found that GnRH did not significantly increase the
18
secretion with increased pituitary sensitivity to the hypothalamus or a
change in GnRH secretion. Thus, high LH reflects the degree of
prolonged disturbance of the hypothalamic, pituitary and ovarian systems
due to various causes.
The mean FSH value was 6.06 mUI / ml. The lowest is 3.2 mUI / ml
and the highest is 9.8 mUI / ml within the normal physiological limits of
this indicator. Results of comparative studies with other studies yielded
similar results. There is no specific change in FSH levels in patients with
polycystic ovaries.
Average LH / FSH index: The standard index that once dominated
the "golden key" diagnosed polycystic ovaries significantly increased in
the group of patients with polycystic ovary. High LH levels, normal FSH,
lead to an increase in LH / FSH indices.
The average LH / FSH ratio is 2.49. Of these, 64.4% had a rate
greater than 2 and 86.43% had a prevalence greater than 1.5. Mean LH
was 14.47, similar to those of Vietnam and higher in some foreign
studies, but similar to that of Shilpi Dasgupta in South Indian women
was 15.9 ± 1.86 FSH As there was no specific and consistent variation in
the studies, a high rate of LH / FSH in the study was well established.
Similar to studies of Asian and Asian people with polycystic ovary
syndrome have higher LH levels than those of other races?
The other clinical features of polycystic ovarian cancer related
patients are still controversial. At 78% of patients with hairy features,
94.9% had menstrual disorders, 78.81% had testosterone levels greater
than 1, and clinical and subclinical disorders were associated with
hyperparathyroidism. Androgens are quite similar to other studies in our
research group. However, when analyzing the correlation between LH
levels and abnormalities, we found no correlation. In contrast, with BMI
only 20.33% abnormal with 3.39% obesity. This is different in the study
and different from the traditional polycystic ovary picture and when
analyzed further we found a linear relationship between inverse LH and
patient weight polycystic ovaries by equations:
19
LH = 22,83 – 0,167x weight (kg)
Polycystic ovary syndrome is associated with two major
mechanisms of increased LH levels or insulin resistance. The difference
in weight distribution, nearly 80% of the weight of the patients in the
normal study and most of the weight was abnormal, the BMI in study
20.86 showed the major pathogenic mechanisms in the group The
unrelated study was not related to insulin resistance, but because of
elevated LH levels, the explanation for the mean LH level in the study
was higher than for other studies. Is this a different feature of polycystic
ovarian cancer patients in Vietnam or that different racial traits in the
pathogenesis of polycystic ovaries. Thus, elevated LH is one of the main
and distinct characteristics of the group of patients with polycystic ovary
in Vietnam. Our analysis confirms the role of LH in the prognosis of
polycystic ovaryctomy patients, a distinctive feature of Vietnamese
polycystic ovary patients. The study by Moran C and colleagues in 2014
confirmed that elevated LH in patients with polycystic ovaries of the
BMI group was less than 25 than in the BMI group above 25 and many
other studies confirmed no association. Between LH increases with
increased insulin. Pagan YL et al (2006) also found a negative
association between BMI and LH levels, LH / FSH ratio by increasing
GnRh in PCOS patients, and LH inhibition Get high BMI. Similar linear
correlations between weights and LH concentrations were given for the
inverse relationship between LH levels and the weight of polycystic
ovary patients, Batista MC et al., 2014. Gene detection: rs 1800447 /
rs34349826 LTB TRP28Arg / LL35Thr mutation coding was associated
with increased LH in polycystic ovarian disease and lower LH levels in
the high BMI group.
4.2. Clinical and subclinical patients do not respond to CC alone
The median age for non-response to CC was 14.51 ± 1.75, the
smallest was 11 years and the largest was 18 years. According to the
study of Olga Karapanou (2010), the average age of menstruating of
countries in the world from 12 to 13.5. Thus, the median age of the
polycystic ovary group was higher than the median age of the girls.
20
According to a study by Jessica Carrol (2012), it was found that patients
with ovarian cysts who had begun to experience ovarian
hyperstimulation were higher in comparison to the control group with the
same BMI. Thus, this proves that the first disorders of polycystic ovaries
appear and manifest very early. The authors conclude that there is a link
between the age at onset of menstruation and the BMI. Accordingly,
genes interacting with BMI that determine the onset of menstrual periods
of polycystic ovarian cancer patients, the gene that interacts with a high
BMI, is associated with an earlier onset of menstruation than the low
BMI. This is in line with our study. The BMI, which is low and normal,
is the most common cause of late menstrual bleeding and other studies
with high BMI. Is it necessary to have in-depth studies in conjunction
with geneticists to determine whether the genes regulating the age of
menopausal women in Vietnam's polycystic ovaries?
According to the 2009 Census in Vietnam, the average age at first
marriage for women is 25.4. So our study of the average age of patients:
25.54 was no difference to the community. One feature of polycystic
ovary syndrome is that 90% of menstrual disorders, one of the most
prominent diagnoses for early reproductive health, are the average age
for The statue is close to the age of marriage. Chronic symptoms suggest
that women are interested in finding the cause but also a sign of
distracting treatment trends, the treatment focused on the treatment of
symptoms of cycloplegia Patients often do not solve problems related to
reproduction and ovulation.
Clinical features in patients with polycystic ovary syndrome are
primarily due to an androgenic mechanism. Mean serum testosterone
levels of 1.405 ± 0.54 and a rate of 80.49% of this concentration ≥ 1
nmol / l is a valuable explanation for the high clinical manifestation of
hyperosmotic androgen in patients not responding to CC.
Our hairy hips typically focus on the hips, navel, shoulders, legs and
arms, almost without shagging on the chest, back, buttocks and chin. It is
easy to see that the BMI of the races we have mentioned is very different
in the general community and in the population of polycystic ovaries in
21
particular in high BMI, increased testosterone secretion Insulin resistance
increases the clinical manifestations associated with hyperandrogen such
as hair growth, acne. This explains the difference in the distribution rates
obtained in our study.
Continuing with BMI when comparing BMI of patients who did not
respond to CC treatment in our study with domestic and international
studies, we found a significant difference. Ovarian polycystic ovaries of
other countries always have a BMI that is very different from that of
Vietnam, in which case the index varies across regions of the world, very
high in Europe, lower in Europe ASIAN. Our study in the CC group did
not respond to only 4/41 patients with BMI> 25 or 9.75%, and the BMI
<18.5 group accounted for 9.75% similar in the study. Vuong Thi Ngoc
Lan (2009) is 6.6% and 14.8%, but is significantly different from the
similar proportion in the Majedah Al-Azemi (2004) study of 55.9% and
0,7%. A very low and very low BMI of 18.5 is the biggest difference in
comparison to other countries. The study of Partel K et al. In patients
with polycystic ovaries had an average BMI of 35 by causing elevated
glucose and insulin levels in the control and monitoring blood to detect
LH levels unchanged. Thus, the mechanism of polycystic ovary disease
in high BMI patients is unrelated to LH levels.
The average testosterone level of the non-responding CC group
was 1.48 nmol / l, up to 78.81% of patients had testosterone levels
higher than or equal to 1 nmol / l. In women, testosterone is
produced from the LH's ovaries to the skin of Theca cells and a very
small amount from the adrenal glands. In the body, testosterone is
bound to SHBG and free testosterone will produce its biological
activity. Thus, with 81.4% of LH levels above 10mUI / ml, 78.81%
of patients with testosterone levels above 1 nmol / l were
appropriate. However, when attempting to analyze the relationship
between elevated LH levels and testosterone levels, we did not find
any difference in LH levels in the tesposterone group above 1 and 1.
Similarly, Single regression showed no association with LH levels
with testosterone levels.
22
When elevated LH levels stimulate the skin cells to produce
androstenedione to convert to estrogen, resulting in chronic estrogen
deficiency. On the other hand, increased testosterone levels increase
estrogen synthesis by peripheral pathways. The feedback effect of
estrogen increases LH. The pathological twist of polycystic ovaries
results in prolonged suppression of ovulation. For estradiol
concentrations we found a linear relationship with the LH
concentration expressed by the equation:
LH = 0,09x [estradiol] + 10,06
In polycystic ovary syndrome, estradiol levels are not significantly
different from normal people, but the difference is that oestradiol levels
(estradiol (E1: E2) are higher than those in normal people. In particular,
the normal E1 concentration is less than E2, in the polycystic ovary
syndrome, E1 is greater than E2 as the peripheral synaptic mechanism
increases with increasing levels of testosterone. The E2 test usually does
not show this abnormality, especially in normal BMI cases.
- Fetal ovary picture: There were 55.1% of patients with polycystic
ovaries with polycystic ovaries on ultrasound, the average number of
cysts on the ovary surface was 10.44. However, when analyzing the
relationship between patients with polycystic ovaries and their response
to CC, the incidence was the same..
4.3. Changes in LH levels in patients responding to and not
responding to CC alone and combination therapy with FSH
The process of monitoring and recording LH levels in successive
stages from the beginning of the patient intake, stimulation of the dose of
CC 50mg, 100mg, 150 mg and combination therapy CC and FSH we
realized when no ovulation or non-response to treatment, the LH level
changed little after the drug with LH levels of 14, IU / l, 13.17IU / l,
13.43IU / l . For ovulatory or treatment-responsive groups, there was a
statistically significant reduction in LH: With the CC dose of 50 mg: the
LH level before treatment was 14.10 IU / l after reduction to 5.94 IU / l,
with a CC100mg dose of LH before treatment of 12.49IU / l after
23
reduction to 6.91IU / l, similar to combination therapy with FSH and CC,
respectively: 13.43IU / L and 6,51IU / l.
Table 4.16: Compare LH changes with other studies
Authors
Gustavo (2011)
Bùi Minh Tiến
(2011)
Lisa (2011)
TTT Hạnh
(2017)
30
23
LH before
treatment
11,06 ± 5,1
8,83 ± 4,17
LH after
treatment
7,07 ± 3,42
10,9 ± 5,96
Chung 54
11,35 ± 6,75
10,54 ± 6,4
10,2
14,10±5,06
14,64±5,46
12,49 ± 5,43
13,17 ± 5,52
7,0
5,94±2,50
12,87±5,46
6,91 ± 3,37
13,39±4,71
Treatment Group N
Met
CC 100
PN
K
Châm cứu Chung
PN
CC 50
K
PN
CC100
K
38
37
81
35
46
T test showed that the difference in mean LH level after treatment in
the ovulatory and ovulatory groups was statistically significant in our
study with p <0.05. At the two-cell cycle, the half life of LH is 20
minutes, when stimulating the ovary, the ovarian follicles move to the
mature follicular phase (type 6), the increased estrogen secretion
increases the LH secretion response. Peak leading to ovulation, the luteal
phase does not increase LH secretion. Therefore, the test for LH levels
when stimulated with ovulation decreased markedly. Does this cause the
LH test of polycystic ovarian cancer patients to be normal when we end
up inadvertently endocrine testing after a natural ovulation cycle?
In the analysis of the distribution of LH levels in the treatment
response group and not responding to CC treatment, we found no
difference in the two groups' distribution in LH.
CONCLUSION
1
LH levels in infertile patients have polycystic ovaries:
24
Average LH concentration: 14.48 ± 5.32
LH concentration ≥ 10 accounted for 81.4%
There was no correlation between LH levels and clinical features
of androgens.
The mean LH level of the group of patients with polycystic
ovaries (13.78 ± 5.76) was lower than that of the normal ovary
group (15,45) ± 4.5).
There is a inverse relationship between LH and weight:
LH = 22,83 – 0,167 x weight (kg)
R = 0,223 R2 = 0,050
2 Comparison clinical characteristics of patients not responding to
olanthetal excitation therapy alone and describing subclinical
characteristics of patients not responding.
Average age of menstruation: 14.51 ± 1.75 (age)
Mean age of study group: 25.79 ± 5.2 (age)
Longest missed period: 139 ± 89 (day)
Average BMI: 21.27 ± 3.31
The clinical characteristics of menstrual disorders, hairy,
acne are 92,68%, 82,93%, 35,59%.
The average hormone level of the group does not meet
CCLH = 14,79 ± 4,92
Mean of FSH = 6,23 ± 1,57
Mean of LH/FSH rate = 2,44 ± 0,78
Mean of Testosterone = 1,41 ± 0,54
Mean of Estradiol = 47,05 ± 19,45
Mean of Progesterone = 1,71 ± 0,89
3 LH changes in patients with IBD with or without CC response
alone or in combination:
Single-variable regression revealed a statistically significant
association between LH levels and FSH levels, estrogen expressed
in the following equations:
25
[LH] = 0,09 x [oestrogen] + 10,06
[LH] = 1,35 x [FSH] + 6,31
There is a linear relationship between LH levels and the
probability of not responding to treatment through the following
equation:
Ln( = -0,881 + 0,017 x LH
= e -0,881+0,017xLH hay odd = e -0,881+0,017xLH
Accordingly, the increase in LH 1 unit, the probability not responding to
treatment increased to 1,017 times or increase the LH by 10 units, the
risk of non response to treatment increased by 10,17 times.
There is a statistically significant decrease in LH when patients
respond to ovulatory stimulation (with ovulation).
In contrast, if treatment is not satisfactory, LH levels are almost
unchanged before and after treatment.