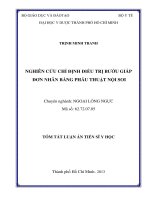
Tóm tắt luận án tiếng anh nghiên cứu sự tạo phức của các ion kim loại với thuốc thử
Bạn đang xem bản rút gọn của tài liệu. Xem và tải ngay bản đầy đủ của tài liệu tại đây (276.1 KB, 14 trang )
INTRODUCTION
In recent years, with the development and expansion of industries and
industrial zones, the pollution of the water environment caused by metals has
been increasing. Metal ions such as copper, cobalt, nickel, zinc usually coexist
together in waste water.
Analytical chemistry should investigate new methods, techniques and
analytical procedures which are rapid, sensitive, accurate and highly selective.
Among them, the direction of research and development of analytical methods
in combination with statistical algorithms for simultaneous analysis of
multicomponent mixtures is increasingly taken up by many analytical chemists.
The 5-bromosalicylaldehyde thiosemicarbazone (5-BSAT) reagent is
capable of reacting with transition metal ions to form chelates which are
colored and stable by coordinating to the central ion through azomethine
nitrogen atom, sulphur atom and/or not phenolic oxygen atom, forming fiveand
six-membered
heterocycles.
Some
researches
have
studied
the
complexation of 5-BSAT reagent with Ag(I), Pt(II), Pd(II), Mn(II), Cu(II),
Ni(II), Fe(III), Ru(III) ions and their biological activities or magnetic
properties. There are some works of complexation in solution between 5-BSAT
with metal ions and application in separate analysis of each metal ion. The
concern is that their complexes have overlapped absorption spectra. However,
no research has applied the 5-BSAT reagent in the simultaneous analysis of
metal ion mixtures by spectrophotometry combined with statistical algorithms.
Therefore, the thesis "Study on complex formation of metal ions with
5-bromosalicylaldehyde thiosemicarbazone reagent and its application in
analysis" has been chosen for research.
The purpose of the research is to search for new complexes of metal
ions with reagent 5-bromosalicylaldehyde thiosemicarbazone, study the
optimum conditions and the structures of complexes. Based on that, spectral
techniques and statistical algorithms such as H point standard addition method
(HPSAM), principle component regression (PCR), partial least squares (PLS)
1
regression are applied for the spectrophotometric simultaneous determination of
1.07×10⁻⁸ M and 3.57×10⁻⁸ M, respectively. The molar absorptivity (ε)
metal ions.
for the complex is 0.92×10⁴ L.mol−1.cm−1. Based on FT-IR, NMR, MS
Research contents of the thesis:
spectroscopies and simulated by IQmol and Q-Chem softwares, the
1. Study on the formation of a new complex of Zn(II) ions with 5-BSAT
structure of the complex is proposed with the molecular formula of
reagent. Simultaneously, add more data of complexes of Co(II) and Ni(II) for
analytical purposes.
Ni(C8H8ON3SBr)2.
3. Spectral technique (H-point satandard addition method, HPSAM) and
2. Study the optimum conditions for complexation in solution.
statistical algorithms (principal component regression (PCR), partial
3. Research on the structures of the formed complexes.
least squares (PLS)) have been studied for application in simultaneous
4. Research on the development of methods for simultaneous
determination of mixture of metal ions with overlapping UV-VIS
determination of Ni(II) and Zn(II), Cu(II) and Co(II) mixtures by
spectrophotometry combined with spectral techniques, statistical algorithms
using 5-BSAT reagent and practical applications.
spectra of complexes.
4. Studied on the application in simultaneous determination of Ni(II) and
Zn(II), Cu(II) and Co(II) mixtures by HPSAM method and Cu(II) and
The scientific significances of the thesis:
Co(II) mixture by spectrophotometry in combination with statistical
1. Contribute to enrich the theories of complexes.
algorithms (PCR, PLS) using 5-BSAT reagent in synthetic sample,
2. The results of research with application of statistical algorithms
ceramic and plated waste water samples. The results shown that, the
contribute partly to the new field of chemometrics.
proposed methods had a high reliability and accuracy.
3. Contribute to the applications of methods for the simultaneous
determination of multicomponent mixtures without any separation steps.
Practical significance:
The thesis proposes the procedure of simultaneous determination of
metal ions by spectrophotometry with high precision, fast and low cost. The
proposed methods can be used for most laboratories of factories or research
institutes that have no access to expensive analytical instruments.
New points of the thesis:
1. New metal complexes with 5-BSAT reagent were detected and the
optimum conditions of the complexation were determined.
2. Study further information of cobalt and nickel complexes with 5BSAT reagent and support for studying simultaneous determination of metal
ions.
2
27
formed after 5 minutes of reaction and stable for 30 minutes. Zn(II) ion
3. Successful application of HPSAM, PCR, PLS methods for
forms a 1:1 stoichiometric complex. The stability constant of Zn(II)-5-
simultaneous spectrophotometric determination of zinc, nickel, copper and
5
BSAT complex calculated by molar ratio method is 4.21×10 . The
cobalt mixtures.
calibration curve of the Zn(II) ion measured at different ranges is linear
in the range 2.0×10⁻⁶ – 6.0×10⁻⁵ mol.L−1 for this ion; LOD and LOQ are
-9
-8
3.26×10 M and 1.09×10 M, respectively. The molar absorptivity (ε)
4
−1
−1
for the complex is 1.08×10 L.mol .cm . Based on FT-IR, NMR, MS
spectroscopies and simulated by IQmol and Q-Chem softwares, the
structure of the complex is proposed with the molecular formula of
Zn(C8H8ON3SBr).H2O.
CHAPTER 1. OVERVIEW
1.1.
Introduction of the 5-bromosalicylaldehyde thiosemicarbazone
reagent and its complexes with metal ions
1.1.1. Introduction of the reagent
The 5-bromoalicylaldehyde thiosemicarbazone (5-BSAT) reagent has a
molecular formula of C8H8BrN3OS (M=274.14 g/mol) and is prepared by
2. Further information on Co(II)-5-BSAT and Ni(II)-5-BSAT complexes
has been studied:
condensing
5-bromosalicylaldehyde with
thiosemicarbazide. 5-BSAT is
a
yellowish white solid, slightly soluble in water and ethanol, dissolved very well
- Co(II)-5-BSAT complex is brown, has maximum absorbance at
405 nm in optimum pH of 5.0. The complex is formed after 5 minutes
in DMF, dioxane to form a yellow solution, insoluble in normal organic
solvents and quickly decomposed in acid solution.
of reaction and stable for 45 minutes. Co(II) ion forms a 1:2
The 5-BSAT reagent has absorption maxima at 290 and 340 nm in the
stoichiometric complex. The stability constant of Co(II)-5-BSAT
ultraviolet region, attributed to * and n * transitions. In the basic
12
complex calculated by molar ratio method is 1.28×10 . The calibration
medium, λmax moves towards the long wavelength (386 nm), due to the
curve of the Co(II) ion measured at different ranges is linear in the
protonation of the OH group, which increases the degree of conjugation in the
range
8.0×10
-6
–
molecule. The FT-IR spectrum of this reagent has the characteristic frequencies
M and
that are 3445 cm-1 and 3259 cm-1 (OH, NH2, NH), 1612 cm-1 (HC= N). In the 1H-
7.11×10⁻⁸ M, respectively. The molar absorptivity (ε) for the complex is
NMR spectrum of reagents, the characteristic signal values δ (ppm) are 6.78 (d,
8.0×10
-5
4
−1
mol.L
−1
for this ion; LOD and LOQ are 2.13×10
-8
−1
1.16×10 L.mol .cm . Based on FT-IR, NMR, MS spectroscopies and
1H), 7.42 (dd, 1H), 8.14 (s, 1H), 8.26 (s, 1H), 10.16 (s, 1H), 11.36 (s, 1H).
simulated by IQmol and Q-Chem softwares, the structure of the
1.1.2. Application of complex of 5-BSAT and metal ions in analysis
complex is proposed with the molecular formula of Co(C8H7ON3SBr)2.
The 5-BSAT reagent was used for the analysis of Fe(II), Co(II),
- Ni(II)-5-BSAT complex is yellow, has maximum absorbance at
Cu(II). In 2002, the Fe(II) complex was published by G. Ramanjaneyulu et
378 nm in optimum pH of 6.5. The complex is formed after 5 minutes
al. In aqueous DMF medium, the complex showed absorption maximum at 385
of reaction and stable for 30 minutes. Ni(II) ion also forms a 1:2
nm, pH 5.0-6.0. The authors used this complex for the determination of Fe(II)
stoichiometric complex. The stability constant of Ni(II)-5-BSAT
in grape leaves, multivitamin capsules and human blood. The Co(II) complex
11
complex calculated by molar ratio method is 4.45×10 . The calibration
was published in 2003. The complex showed absorption maximum at 410 nm in
curve of the Ni(II) ion measured at different ranges is linear in the
acidic medium. Beer's law was obeyed in the range 0.29-5.89 μg.ml–1 of
range 2.0×10⁻⁶ – 6.0×10⁻⁵ mol.L−1 for this ion; LOD and LOQ are
cobalt(II). G. Ramanjaneyulu et al have applied it for the determination
26
3
of cobalt in
steel
samples
by third
The results of calculating concentrations of the Cu2+ và Co2+ ions in 3 test
derivative spectrophotometry.
In 2008, G.Ramanjaneyulu et al studied Cu(II)-5-BSAT complex in aqueous
samples (test set) were presented in Table 3.424 Table 3.45.
Table 3.44. The found concerntration of Cu2+ in test set
DMF medium. The greenish yellow colored complex was formed in pH 4-5,
with
the
absorption
maximum
at
390 nm. The authors have applied for the determination of copper in grape
Sample
leaves
and aluminum based alloy samples by third derivative spectrophotometry.
Cfound
C
(10-6 M)
Recovery (%)
(10-6 M)
Error (%)
PLS
PCR
PLS
PCR
PLS
PCR
N1
6
5.789
5.762
96.48
96.03
-3.52
-3.97
Some works have studied on synthesizing the complexes of the reagent
N2
8
8.013
7.774
100.16
97.18
0.16
-2.83
with Ag(I), Pt(II), Pd(II), Mn(II), Cu(II), Ni(II), Fe(III), Ru(III) ions and their
N3
10
10.249
10.093
102.49 100.93
2.49
0.93
biological activities or magnetic properties.
2+
Table 3.45. The found concerntration of Co in test set
In summary, the 5-BSAT reagent has not been studied a lot. The results
of the study used in the analysis were mainly the analysis of individual metal
Sample
ion. Therefore, the study on simultaneous determination of many metal ions is
C
Cfound
(10 M)
Recovery (%)
(10-6 M)
-6
Error (%)
PLS
PCR
PLS
PCR
PLS
PCR
necessary, although the absorption maxima of their complexes are very close to
N1
8
7.979
8.002
99.74
100.03
-0.26
0.03
each other (only from 3 to 20 nm).
N2
12
11.645
11.798
97.04
98.32
-2.96
-1.68
1.2.
N3
8
8.576
8.688
107.20
108.60
7.20
8.60
Introduction of the analytical properties of zinc, nickel, cobalt and
copper ions
The results showed that the found concentration of two ions were not
1.3.
Some methods of determination of zinc, nickel, cobalt and copper
1.4.
Some methods of simultaneous determination of multicomponent
mixtures by spectrophotometry
relative errors of the two methods were acceptable).
Conclusion: The spectrophotometric method in combination with
1.4.1. Vierordt method
multivariate regression methods such as PLS and PCR has been applied for
1.4.2. H-point standard addition method
simultaneously determinating the mixture of Cu2+ and Co2+ in 8 standard
To determine the analyte X in the presence of the interference Y, two
standard addition lines with gradually increasing concentrations of X are
constructed at two wavelengths 1 and 2 chosen previously. These two lines
intersect at point H with coordinates (-CH, AH). We have:
CH
significantly different from the standard concentration in the test set (the
a2 .CXa1.CX
a1 a2
CX
(1.13)
samples and 3 test samples with the results of the analysis with the high
accuracy and reliable results. The results showed that both methods of PCR and
PLS gave similar results, differences between the results of two methods were
not significant.
CONCLUSIONS
1. A new complex of Zn(II) ion and 5-BSAT reagent has been studied.
A
C = H
(1.14)
Vậy nồng độ của chất X cần tìmY chính
ε Y .llà trị tuyệt đối của hoàng độ điểm H và:
The results show that, Zn(II)-5-BSAT complex is light yellow, has
maximum absorbance at 381 nm in optimum pH of 6.8. The complex is
1.4.3. Spectrophotometry combined with multivariate regression methods
4
25
- Determining the concentration of Cu(II) and Co(II) ions: The results of
2+
2+
calculating concentrations of the Cu
và Co
ions in 8 standard samples and
the accuracy of methods were presented in Table 3.42, Table 3.43.
2+
Table 3.42. The found concerntration of Cu in training set
Sample
Cfound
C
(10-6 M)
Recovery (%)
(10-6 M)
The thesis applies multivariate linear regression, principle component
regression and partial least squares methods.
1.5.
Some methods of studying complexation
1.5.1.
Method of determining the composition of complexes
There are many methods used to determine the composition of
Error (%)
complexes. Among them, the molar ratio method is used in the thesis.
PLS
PCR
PLS
PCR
PLS
PCR
The content of the method is to establish the dependence of A(A) on
M1
4
3.826
3.933
95.65
98.33
-4.35
-1.68
CR when CM = const and the dependence of A(A) on CM when CR = const. The
M2
4
3.924
3.931
98.10
98.28
-1.90
-1.73
dependence of A(A) on ratio
M3
4
4.290
4.150
107.25 103.75
7.25
3.75
corresponding to the ratio of the stoichiometry coefficients, this ratio is equal to
M4
5
5.417
5.454
108.34 109.08
8.34
9.08
M5
8
7.747
7.670
96.84
95.88
-3.16
-4.13
M6
10
9.607
9.588
96.07
95.88
-3.93
-4.12
M7
10
9.872
9.972
98.72
99.72
-1.28
-0.28
M8
12
12.317
12.341
102.64 102.84
2.64
2.84
Table 3.43. The found concerntration of Co2+ in training set
Sample
C
Cfound
(10 M)
Recovery (%)
(10-6 M)
-6
when CM = const has a breakpoint
which is the abscissa of breakpoint.
1.5.2. Method of determining the stability constants of complexes
There are many methods used to determine the stability constants of
complexes. Among them, the molar ratio method is used in the thesis.
Consider a case with the formed complex MRn. We construct a graph
A(A) = f(
Error (%)
) when CM = const. Calculate εP =
.
, thus: CP =
.
.
Place values of CM, CR, CP and n into the equation of calculation of
PLS
PCR
PLS
PCR
PLS
PCR
stability constant β:
M1
6
5.744
5.682
95.73
94.70
-4.27
-5.30
M2
8
8.255
8.251
103.19 103.14
3.19
3.14
M3
12
11.535
11.619
96.13
96.83
-3.88
-3.18
To determine the molar absorption coefficients of the complexes, the
M4
6
6.733
6.717
112.22 111.95
12,22
11,95
value of εP calculated from the molar ratio method in Section 1.5.2 can be used,
M5
8
7.835
7.893
97.94
98.66
-2.06
-1.34
or is determined by the linear regression method from the results of study the
M6
5
5.164
5.195
103.28 103.90
3.28
3.90
linear concentration range of the complex. From that, the slope of the
M7
3
2.841
2.802
94.70
93.40
-5.30
-6.60
regression line is the molar absorption coefficient of the complex.
M8
3
2.894
2.908
96.47
96.93
-3.53
-3.07
1.6.
The results showed that the found concentration of Cu
2+
2+
và Co
ions
were not significantly different from the standard concentration in the training
set (the relative errors of the two methods were acceptable).
24
β=
.
(1.36)
1.5.3. Method of determining molar absorption coefficients of complexes
The methods of study the structure of complexes
Thesis uses the spectroscopic methods such as infrared (IR), nuclear
magnetic resonance (NMR) and mass spectroscopies (MS).
Conclusion:
5
Through the review, we find that the 5-BSAT reagent has many
interesting properties. UV-VIS absorption spectrum of the reagent has no
Moreover, the calculated results proved that the proposed method was suitable
for the simultaneous determination of Cu2+ and Co2+ in complex mixtures.
peak in range 365 - 600 nm. But in the presence of some metal ions, peaks
According to TCVN 5945-2005, the content of copper in industrial waste
occur in the range 375 - 410 nm depending on the metals. Previous studies only
water is not more than 2 mg/l. This shows that this water sample has the content
analyzed individual metals and applied in analysis. These works can be
of copper exceeding the allowed standard above 50%. Therefore, a more
summarized
efficient waste water treatment process is required.
as
follows: Cu(II)-5-BSAT
complex
has
been
studied
and published in reputable journals, but Co(II)-5-BSAT and Ni(II)-5-
3.4.3. Application
BSAT complexes have a few studies published in summary form. Until now,
spectrophotometric determination of copper and cobalt ions
there
is
no
scientific
paper
in
of
statistical
algorithms
PLS,
PCR
in
Preparation of research solution samples:
Zn(II)–5-BSAT complex. Therefore, the studies of new metal complexes and
Two sets of standard solutions were prepared. The calibration set
further information of cobalt and nickel complexes with 5-BSAT reagent are
contains 11 standard solutions. The concentration of each cation solution was in
necessary. However, their absorption spectra are very close together, so the
the linear dynamic range of the cation, for the preparation of each solution,
studies
different volumes of two cation solutions (0.01 M) were added to 1.0 ml 5-
in
simultaneous
determination
have
practical and
theorical
significances.
BSAT solution (pH =5.0) in a 25 ml volumetric flask. The generated mixture
designs were then randomly divided into 70%-30% training (n=8) and testing
2.1.
CHAPTER 2. RESEARCH METHODS AND EXPERIMENTAL
sets (n=3), respectively. We developed calibration model using the training set
TECHNIQUE
and compared the performance of PLS technique in the independent test set
Methodology of the thesis
using various R packages. All calculations were performed using R version
The 5-BSAT reagent in solution is colorless and has two peaks with
3.3.3.
maximum absorbance at 290 and 340 nm, and the absorbance decreases when
Measurement of absorption spectra:
the wavelength increases. In appropriate conditions, in the presence of some
After 20 minutes of the solution prepared, the spectra of the solutions
2+
2+
2+
2+
transition metal ions (such as Fe , Cu , Co , Ni ), the solution will appear
were measured in the wavelength range 370-446 nm with 4 nm intervals.
the color and has a peak in the range 360-450 nm. Therefore, the main base of
Comparative solutions were prepared similarly but without metal ion. Save the
the thesis is the use of spectrophotometric method in this wavelength range. On
results in the form of a matrix (8 × 20) and (3 × 20) for training samples and
the other hand, due to the absorption maxima of the metal complexes are very
test samples, and transfer the data into software R 3.3.3 for calculations.
close together, the metals often coexist together in the analytical samples, the
Calculation of results:
application of the spectral techniques, multivariate statistical algorithms such as
- Determination of optimum number of components:
HPSAM, PCR, PLS… to analyze simultaneously is the important basic theory
The RMSEP value is minimum in the number of 2 for both copper and
of this thesis.
cobalt, then the number of components are selected as optimum for the
2.2.
calibration model.
The research contents
2.2.1. Investigation of interactive signals of reagents with metal ions
6
23
City. Then, the sample was safted in a 2 liter of PE bottle, then added about 6
mL of concerntrated solution of HNO3.
Investigation of interactive signals of 5-BSAT reagent with some metal
ions is performed by investigating the absorption spectra of each system in the
- Establishing two H-point standard addition straight lines:
wavelength range 300 – 700 nm. From the absorption spectra, the absorption
The standard addition analytical samples were prepared when Cu
2+
was
maxima of the reagent and the complexes are identified. Therefore, new formed
added. The absorbances of the solutions were measured at wavelength pair λ1 =
complexes are discovered and the orientation for study in simultaneous analysis
390 nm, λ2 = 419 nm (repeat measurement 3 times).
of metal ions which form complexes with reagent is given.
- Calculating concerntration of Cu(II) and Co(II) ions: The results of
2.2.2. Study the optimum conditions of the complexes
sample analysis are shown in Table 3.38.
After the complexation signals have been found, the optimum conditions
2+
2+
of complexation such as pH, durability of the complex over time, effects of
Table 3.38. Analytical results of Cu and Co mixture
reagents and solvents, the concentration range obeyed to the Beer’s law are
in plated waste water
No.
2
A-C Equation
1
2
3
-6
R
A390 = 0.036C + 0.661
0.999
A419 =0.014C + 0.551
0.987
A390 = 0.038C + 0.662
0.997
A419 =0.014C + 0.550
0.988
A390 = 0.038C + 0.663
0.997
A419 =0.014C + 0.512
0.982
-6
CCu 2 (10 M)
CCo2 (10 M)
5.02
3.46
4.67
3.42
investigated. These results are the base to study the composition of the
complexes by the molar ratio method. By that, the molar absorptivities, the
stability constants of the complexes are determined.
2.2.3. Study the structure of complexes
Combining the optimum conditions and the information from the FT-IR,
1
H-NMR,
13
C-NMR, MS spectroscopies, molecular models are simulated
4.67
3.42
Average concentration (mol/l)
4.79±0.50
3.43±0.06
propose structures of complexes.
Average concentration of initial sample (mg/l)
3.04± 0.31
2.02± 0.06
2.2.4. Application of H-point standard addition method
and calculated geometrically using IQmol and Q-Chem 4.4 softwares to
In this thesis, H-point standard addition method (HPASM) is used for
This result was compares to the analytical results determined by atomic
simultaneous spectrophotometric determination of Zn(II) and Ni(II) mixtures
absorption spectrometry (AAS) and was shown in Table 3.39.
Table 3. 39. Comparison between experimental contents of Cu2+ and Co2+ in
2.2.5. Application of multivariate regression algorithms PCR, PLS
plated waste water of by HPSAM and AAS method
Ion
Results
by
HPSAM (mg/l)
Results
ASS
by
method
(mg/l)
In this thesis, spectrophotometry in combination with PCR and PLS
Recovery
Error
algorithms is used for simultaneous determination of Cu(II) and Co(II)
(%)
(%)
mixtures. The calculation of metal ion concentrations based on PCR, PLS
1
Cu2+
3.04
3.22
94.41
-5.59
2
Co2+
2.02
2.10
96.19
-3.81
The amounts of metal ions obtained by the proposed methods were in
good agreement with those obtained by AAS (SMEWW 3500-2005).
22
and Cu(II) and Co(II) mixtures in synthetic and real samples.
algorithms runs on R software with programs and packages such as e1071, pls
...
2.3.
Calculation of the results and errors
2.4.
Chemicals and Instruments
7
CHAPTER 3. RESULTS AND DISCUSSION
3.1.
Studying complexation of Zn(II) ion with 5-BSAT reagent
3.1.1 Absorption spectra
In laboratory conditions, absorption spectra showed that, 5-BSAT
H1
reagent has absorption maxima at 290 and 340 nm, no any peaks in the range
365-600 nm. In contrast, also in that condition, the mixture of Zn(II) and 5-
H2
BSAT is slightly yellow and has absorption maximum at 381 nm. This is a
signal to conform a new formed complex due to the shifting λ max in the long
H3
wavelength. In previous studies, we do not see any authors published about this.
H4
3.1.2 The optimum conditions
* Effect of pH: The results showed that, the Zn(II) complex exhibits
maximum absorbance in the pH range 6.5-7.0
Standard
Recovery
CLT (106 M)
CTN (106 M)
Copper
8.00
7.99±0.11
0.063
0.79
99.90
Cobalt
8.00
7.99±0.08
0.045
0.56
99.91
Copper
10.00
9.79±0.11
0.061
0.62
97.87
Cobalt
8.00
7.98±0.18
0.099
1.25
99.68
Copper
8.00
7.97±0.17
0.090
1.13
99.58
Cobalt
10.00
9.98±0.13
0.070
0.70
99.83
Copper
10.00
9.98±0.17
0.095
0.95
99.77
Cobalt
10.00
9.91±0.23
0.126
1.27
99.07
Solution
deviation S
CV (%)
(%)
Using the Student’s test, it can be concluded that the difference of added
concerntration CLT and found concerntration CTN is random.
* Time effect: The results showed that, Zn(II) and 5-BSAT mixture was
Application
of
H-point
standard
addition
method
in
stable for a long time. Absorbance decreased slightly over a period of 30
spectrophotometric determination of copper and cobalt ions in real
minutes. Therefore, in later studies, absorption measurements were performed
samples
at the range 5 - 20 min after mixing of reagents.
In this condition, the
absorbance of the reagent was also very low and varied negligibly.
* Effect of reagent concentration:
The results showed that, when the amount of reagent is twofold excess
over maximum concentration of Zn(II), the formation of complex gets
maximum. In the following experiments, a concentration ratio of 1:2 is used.
The effects of foreign species on the simultaneous determination of Cu2+
and Co2+ were investigated by measuring the absorbance of the solutions
containing 2×10⁻⁵ M of each metal ion in the presence of various amounts of
other ions. An ion was considered to interfere when its presence produced a
variation in the absorbance of the sample greater than 5%.
The results show that, Ni2+, Fe3+, Cr3+ ions interfered to complexation
* Effect of solvent:
of Cu2+ and Co2+ ions with 5-BSAT when the concerntration of these ions is 10-
The results showed that, when increasing the amount of solvent, the
16 times of the concerntration of Cu2+ and Co2+ ions. The other ions interfered a
absorbance of the solution increased and stabilized when VDMF = 2 ml. The
little. To prevent the effect of above interferences, 2.0 mL of solution of
increase in absorbance is probably related to the decrease in the polarization of
masking solution (sodium fluoride and sodium citrate mixture) were used, but
the solvent, so that the complexation is more complete.
the complexation of Cu2+ and Co2+ ions was not interfered.
* Linear concerntration range:
Analysis of plated waste water:
The results showed that, the calibration curve of the Zn(II) ion measured
- Sampling:
at different ranges is linear in the range 2.0×10⁻⁶ – 6.0×10⁻⁵ mol.L−1 for this ion.
The determined molar absorptivity (ε) for the complex is 1.08×10⁴
L.mol−1.cm−1, LOD and LOQ are 3.26×10⁻⁹ M and 1.09×10⁻⁸ M, respectively.
8
Samples are taken directly from settling tank of Phuc Thinh Company
Limited, 28B, Nguyen Hien Le Street, Tan Binh District, Ho Chi Minh
21
3.1.3. The composition of complex and its structure
(mg/l)
Ni2+
2.45
2.55
96.08
-3.92
The composition of complex was determined by molar ratio method. The
2+
1.23
1.30
94.62
-5.38
results showed that, Zn(II) ion forms a 1:1 stoichiometric complex. The
Zn
The amounts of metal ions obtained by the proposed methods were in
stability constant of the complex calculated by this method is 4.21x10⁵.
good agreement with those obtained by AAS (SMEWW 3500-2005).
3.2.
Moreover, the calculated results proved that the proposed method was suitable
5-BSAT reagent
2+
2+
Studying the complexation of Co(II), Ni(II) and Cu(II) ions with the
3.2.1. Studying the complexation of Co(II) ion with the 5-BSAT reagent
for the simultaneous determination of Ni and Zn in complex mixtures.
This shows that this water sample has the content of nickel exceeding the
The results showed that, cobalt ion forms a brown colored complex with
allowed standard many times. The content of zinc in the water is lower than the
5-BSAT reagent. In solution, the complex shows absorption maximum at 405
prescribed standards. Therefore, a more efficient waste water treatment process
nm. The complex is formed after 5 minutes of reaction and stable for 45
is required.
minutes at pH 5.0. The appropriate volume of DMF solvent is 2.5 mL. The
Conclusion: Spectrophotometric method combining the HPSAM
formed complex is a complex with a 1:2 metal:ligand stoichiometry. The
algorithm to simultaneous determination of Ni2+ và Zn2+ gives the relatively
calibration curve of the Co(II) ion measured at different ranges is linear in the
high accuracy and reliable results.
range
3.4.2 Application
of
H-point
standard
addition
method
in
spectrophotometric determination of copper and cobalt ions
8.0×10⁻⁶ – 8.0×10⁻⁵ mol.L−1 for this ion; LOD and LOQ are 2.13×10⁻⁸ M and
7.11×10⁻⁸ M, respectively. The molar absorptivity (ε) for the complex is
* Selection of wavelength pair λ1, λ2:
1.16×10⁴ L.mol−1.cm−1. The Co(II)-5-BSAT complex is quite stable with the
Based on the absorption spectra of Cu(II) and Co(II) complexes, the best
stability constant of 1.28×10¹².
pair of wavelengths was λ1 = 390 nm and λ2 = 419 nm when standard solution
3.2.2. Studying the complexation of Ni(II) ion with the 5-BSAT reagent
The results showed that, nickel ion forms a green colored complex with
of Cu(II) were added.
* Establishing two H-point standard addition straight lines:
5-BSAT reagent. In solution, the complex shows absorption maximum at 378
The absorbances of the H1, H2, H3, H4 mixed solutions were measured at
nm. The complex is formed after 5 minutes of reaction and stable for 30
wavelength pair λ1 = 390 nm, λ2 = 419 nm (repeat measurement 3 times). From
minutes at pH 6.5. The appropriate volume of DMF solvent is 2 mL. The
these values, construct the regression line pairs A = f(CCu added) each range of
formed complex is a complex with a 1:2 metal:ligand stoichiometry. The
solutions for each measurement.
calibration curve of the Ni(II) ion measured at different ranges is linear in the
*Calculating concerntration of Cu(II) and Co(II) ions: Table 3.34
range 2.0×10⁻⁶ – 6.0×10⁻⁵ mol.L−1 for this ion; LOD and LOQ are 1.07×10⁻⁸ M
synthesizes and treats statistically the analytical results of H1, H2, H3, H4
and 3.57×10⁻⁸ M, respectively. The molar absorptivity (ε) for the complex is
mixtures.
0.92×10⁴ L.mol−1.cm−1. The Ni(II)-5-BSAT complex is quite stable with the
Table 3.34. Analytical results of Cu2+ and Co2+ mixture in synthetic samples by
HPSAM at wavelength pair λ1 = 390 nm, λ2 = 419 nm
stability constant of 4.45×10¹¹.
3.2.3. Investigation of the complexation of Cu(II) ion with the 5-BSAT
reagent
20
9
The results showed that, copper ion forms a greenish yellow colored
According to TCVN 5945-2005, the content of nickel and zinc in
complex with 5-BSAT reagent. In solution, the complex shows absorption
industrial waste water is not more than 0.2 mg/l and 3 mg/l. This shows that this
maximum at 395 nm. The complex is formed after 5 minutes of reaction and
water sample has the content of nickel exceeding the allowed standard many
stable for 45 minutes at pH 5.0. The appropriate volume of DMF solvent is 2.5
times. The content of zinc in the water is lower than the prescribed
mL. The formed complex is a complex with a 1:1 metal:ligand stoichiometry.
standards. Therefore, a more efficient waste water treatment process is required.
The calibration curve of the Cu(II) ion measured at different ranges is linear in
-6
-5
Analysis of plated waste water:
−1
the range 4.0×10 – 9.6×10 mol.L for this ion. The molar absorptivity (ε) for
4
−1
- Sampling:
−1
the complex is 1.09×10 L.mol .cm . The Cu(II)-5-BSAT complex is quite
5
Samples are taken directly from settling tank of Thinh Toan Company
stable with the stability constant of 6.81×10 .
Limited, Block D5, Street No. 6A, Le Minh Xuan Industrial Park, Binh
3.3.
Chanh District, Ho Chi Minh City. Then, the sample was safted in a 1 liter of
Discussion on the structures of these complexes
3.3.1. Zn(II)–5-BSAT complex
PE bottle, then added about 3 mL of concerntrated solution of HNO3.
Synthesis of the Zn(II)–5-BSAT complex
- Establishing two H-point standard addition straight lines:
Ethanolic solution (30 mL) of the 5-BSAT reagent (1 mmol; 0.2742 g)
- Calculating concerntration of Ni(II) and Zn(II) ions:
was added to the solution (20 mL) of ZnCl2 (1 mmol; 0.1363 g) and the mixture
The results of sample analysis are shown in Table 3.26
Table 3.26. Analytical results of Ni2+ and Zn2+ mixture in plated waste water
was refluxed for 4 hours. Volume of the resulting solution was reduced to 20
mL at rotary vacuum evaporator and the solution was left overnight. The
resulting crystalline compound was filtered, washed with ethanol-dioxane
(V:V=1:1) mixture, and dried in vacuum. Yellow white crystalline product is
C Ni 2 (10-6 M)
C Zn 2 (10-6 M)
8.33
3.63
8.24
3.80
8.47
3.85
Average concentration (mol/l)
8.35 ± 0.29
3.76 ± 0.29
Average concentration of initial sample (mg/l)
2.45 ± 0.09
1.23 ± 0.10
No.
1
stable.
Study on the proposed structure of the Zn(II)–5-BSAT complex
2
FT-IR spectroscopies:
-1
5-BSAT reagent (max, cm ): 3454 (–OH, –NH), 3250 (–NH), 3161 (CH,
aromatic), 1612 (CH=N, azomethine), 1060 (C=S).
Zn(II)–5-BSAT complex (max, cm-1): 3454 (–OH, –NH), 3244 (–NH),
3159 (CH, aromatic), 1600 (CH=N, azomethine), 1064 (C=S).
In the 5-BSAT reagent molecule, positions that are likely to occur in
3
A – C Equation
R2
A370=0.0161C+0.1350
0.9994
A399=0.0073C+0.1031
0.9990
A370=0.0159C+0.1362
0.9992
A399=0.0074C+0.1039
0.9991
A370=0.0157C+0.1387
0.9992
A399=0.0071C+0.1054
0.9988
This result was compares to the analytical results determined by atomic
absorption spectrometry (AAS) and was shown in Table 3.27.
coordination with metal ions are –NH2, –C=S, –CH=N, azomethine and –OH
Table 3.27. Comparison between experimental contents of Ni2+ and Zn2+ in plated
phenol. IR spectra of the complex show characteristic bands of OH, NH2 are
waste water of by HPSAM and AAS method
approximately 3454, 3244 cm-1. Absorption band of NH2 at 3244 cm-1 change
Ion
slightly the absorption frequencies.
10
Results
by
HPSAM (mg/l)
Results
by
ASS method
19
Recovery
Error
(%)
(%)
The standard addition analytical samples were prepared when Zn2+ was
In 5-BSAT molecule, the O atom in OH goup has a high
added. The absorbances of the solutions were measured at wavelength pair λ1 =
electronegativity, so that the free electron pair is held, the -NH2 group has a p-
370 nm, λ2 = 399 nm (repeat measurement 3 times).
resonance effect with the adjacent C=S group, in the 5-BSAT molecule. In
- Calculating concerntration of Ni(II) and Zn(II) ions: The results of
sample analysis are shown in Table 3.22.
pairs on the N atom of the NH group with the C=S group. Thus, it can be
Table 3.22. Analytical results of Ni2+ and Zn2+ mixture in
deduced that the NH2, NH group is not involved or weakly participates in
coordination with the Zn(II) ions because the N atom lacked electrons as a
ceramic waste water
No.
1
2
3
addition, the NH group also has a p- resonance effect between free electron
2
-6
A – C Equation
R
A370=0.0159C+0.1363
0.9990
A399=0.0072C+0.0987
0.9991
A370=0.0162C+0.1366
0.9993
A399=0.0072C+0.0963
0.9992
A370=0.0160C+0.1359
0.9990
A399=0.0073C+0,0990
0.9988
-6
C Ni 2 (10 M)
C Zn 2 (10 M)
7.41
4.32
6.96
4.48
result of the p- resonance.
5-BSAT exhibit a sharp band at 1612 cm-1 due to azomethine linkage
(C=N). In the complex, this band appears at a lower frequency (1600 cm-1) and
has a weaker intensity than that on the free ligand. This clearly indicates the
involvement of N atom in coordination due to a reduction in the electron
density in the azomethine linkage. The absorption at 1064 cm-1 of the C=S
7.40
4.24
vibration in the complex has a change in the absorption frequency, but its
Average concentration (mol/l)
7.26 ± 0.64
4.35 ± 0.30
intensity is lower than its intensity in 5-BSAT. This proves that there is a
Average concentration of initial sample (mg/l)
2.13 ± 0.19
1.42 ± 0.09
polarization of the C=S bond in the complex and this polarization is due to the
This result was compares to the analytical results determined by atomic
change in electron density S atom as a double bond of C=S, which is inferred
by the coordination of S atom with Zn(II) ion.
absorption spectrometry (AAS) and was shown in Table 3.23.
The absorption at 3454 cm-1 did not change or change slightly the
Table 3.23. Comparison between experimental contents of Ni2+ and Zn2+ in
ceramic waste water of by HPSAM and AAS method
Results
Ion
HPSAM
(mg/l)
by
Results
ASS
method
absorption frequencies in both 5-BSAT and complex spectra. However, the
vibration of the O-H bond in the complex has a sharp decrease in intensity, due
by
Recovery
Error
(%)
(%)
(mg/l)
Ni2+
2.13
2.21
96.38
-3.62
Zn2+
1.42
1.48
95.95
-4.05
The amounts of metal ions obtained by the proposed methods were in
to the change in electron density on the O atom, which causes the O-H bond to
be strongly polarized, the polarization being due to the O atom involved in
coordinating with Zn(II) ion. The medium intensity band in the region 488 cm-1
is attributed to Zn–O bond and in the region 472 cm-1 is attributed to Zn–S
bond.
1
H-NMR and 13C-NMR spectroscopies of the Zn(II)–5-BSAT complex:
1
H-NMR (500 MHz, DMSO-d6), δ (ppm): 11.42 (s, 1H, –NH2), 10.23 (s,
good agreement with those obtained by AAS (SMEWW 3500-2005).
Moreover, the calculated results proved that the proposed method was suitable
for the simultaneous determination of Ni2+ and Zn2+ in complex mixtures.
1H, –NH2), 8.30 (s, 1H, NH), 8.23 (s, 1H, OH), 8.21 (s, 1H, HC=N), 8.16 (s,
1H, Ar-H), 7.34 (dd, J1 = 8.5, J2 = 2.5 Hz, 1H, Ar-H), 6.83 (d, J = 8.5 Hz, 1H,
Ar-H);
18
11
13
C-NMR (125 MHz, DMSO-d6, δ (ppm): 178.3 (C=S), 156.0 (C–O),
137.7 (CH=N, azomethine), 133.8, 128.8, 123.4, 118.6, 111.6 (5 left aromatic C
atoms)
H2
Mass spectra of the Zn(II)–5-BSAT complex:
H3
[M]+ = 355.0091, [M]+calculated = 354.8969.
Therefore, in the complex, 5-BSAT behave as a tridentate ligand,
coordinating to the central ion through azomethine nitrogen atom, sulphur atom
and phenolic oxygen atom, forming two five- and six-membered heterocycles.
From FT-IR, 1H-NMR and MS spectroscopies, the structures of the
complex is proposed in Fig.3.25.
8
Br
17
12
11
9
10
H
4
N
7
2
NH2
2+
S
23
18
H
5
3
Zn
O
1
O
24
5.00
4.98 ± 0.24
0.096
1.94
99.6
Zinc
10.00
9.99 ± 0.21
0.085
0.85
99.9
Nickel
5.00
5.03 ± 0.13
0.053
1.05
100.6
Zinc
5.00
5.05 ± 0.15
0.060
1.19
101.0
Nickel
10.00
9.97 ± 0.06
0.025
0.25
99.7
Zinc
10.00
10.05 ± 0.09
0.035
0.35
100.5
Nickel
10.00
9.93 ± 0.09
0.036
0.36
99.3
Using the Student’s test, it can be concluded that the difference of added
concerntration CLT and found concerntration CTN is random.
Application
H
N
6
H4
Nickel
H
Fig. 3.1. Structure of the Zn(II)- 5-BSAT complex
Molecular modeling
of
H-point
standard
addition
method
in
spectrophotometric determination of nickel and zinc ions in real samples
The effects of foreign species on the simultaneous determination of Ni2+
and Zn2+ were investigated by measuring the absorbance of the solutions
containing 2×10⁻⁵ M of each metal ion in the presence of various amounts of
other ions. An ion was considered to interfere when its presence produced a
variation in the absorbance of the sample greater than 5%.
The molecular structure of Zn(II)–5-BSAT complex was simulated by
The results show that, Fe3+, Cr3+, Cu2+, Co2+, Cd2+ ions interfered
using IQmol program. An attempt to gain a better insight on the molecular
strongly to complexation of Zn2+ and Ni2+ ions with 5-BSAT when the
structure of the complex, geometric optimization has performed using
concerntration of these ions is less than 1.6-5.0 times of the concerntration of
DFT/B3LYP method as implemented in Q-Chem 4.4. Convergence criteria
Zn2+ and Ni2+ ions. Also, Al3+, Pb2+, Mn2+ interfered a little, Ca2+, Mg2+ did not
were set to 0.01 kcal/mol for B3LYP calculations with 6-31G* basis set.
interfere. To prevent the effect of above interferences, 5.0 mL of solution of
The coordination results in the changes of bond lengths and angles of the
thiosemicarbazone ligand, as expected. The C-O, C‐S bond length increases
masking solution were used, but the complexation of Zn2+ and Ni2+ ions was not
interfered.
from 1.341 Å, 1.663 Å in the free 5-BSAT ligand to 1.416 Å, 1.736 Å in
Analysis of ceramic waste water:
Zn(II)–5-BSAT complexes, respectively. Similarly, N‐C(S) bond suffers a
- Sampling:
significant decrease from 1.378 Å in the free 5-BSAT ligand to 1.361 Å in
Samples are taken directly from settling tank of Kim Truc Company
Zn(II)–5-BSAT complex. These changes indicate the coordination of the
Limited, Block 4, 15, Street No. 3, Tan Binh Industrial Park, Tan Phu District,
oxygen and sulfur atoms. Similarly, the changes of charge of N2 atom and bond
Ho Chi Minh City. Then, the sample was safted in a 1 liter of PE bottle, then
lengths of N2-N4 and N2-C6 also indicate the coordination of the azomethine
added about 3 mL of concerntrated solution of HNO3.
nitrogen atom. The bond angles around zinc are between 87.6-113.0°. The bond
- Establishing two H-point standard addition straight lines:
angles around the Zn(II) center (~109.5°) prove that the geometry is tetrahedral.
12
17
atom of the phenolic OH-group. The experimental results show that, the Zn(II)
complex is weaker than Cu(II) and Ni(II) is weaker than Co(II). In complexes
Finally, from the interpretation of spectral data and QM calculations, it is
possible to draw up the tentative structure of the complex (shown in Fig.3.26).
with the same coordinating number of 4, the above rule is consistent with the
decrease in ionic radius from Zn(II) to Cu(II) and Ni(II) (R = 0.60, 0.57 and
0.55 Å ) and gradually increase the electronegativity ( = 1.65, 1.90 and 1.91).
The absorption spectra of the complexes overlap with each other and
cannot well resolved by the traditional procedures using simple calibrations.
This is the base for us to study statistical algorithms to simultaneous analysis of
the multi-component mixtures.
3.4.
3.4.1.
Fig. 3.2. Molecular modelling of the Zn(II)–5-BSAT complex
Study the application in analysis of complexes
Application
of
H-point
standard
by IQmol program
addition
method
in
spectrophotometric determination of nickel and zinc ions
Conclusion:
The Zn(II)–5-BSAT complex has been synthesized and analyzed as first
* Selection of wavelength pair λ1, λ2:
work published in the world. Zinc ion forms a slightly yellow colored complex
Based on the absorption spectra of Ni(II) and Zn(II) complexes, the best
with 5-BSAT reagent. In solution, the complex shows absorption maximum at
pair of wavelengths was λ1 = 370 nm and λ2 = 399 nm when standard solution
381 nm. The complex is formed after 5 minutes of reaction and stable for 30
of Zn(II) were added.
minutes at pH 6.8. The formed complex is a complex with a 1:1 metal:ligand
* Establishing two H-point standard addition straight lines:
stoichiometry. The calibration curve of Zn(II) ion measured at different ranges
The absorbances of the H1, H2, H3, H4 mixed solutions were measured at
is linear in the range 2.0×10⁻⁶ – 6.0×10⁻⁵ mol.L−1 for this ion. The molar
wavelength pair λ1 = 370 nm, λ2 = 399 nm (repeat measurement 3 times). From
absorptivity (ε) for the complex is 1.08×10⁴ L.mol−1.cm−1. The Zn(II)-5-BSAT
these values, construct the regression line pairs A = f(CZn added) each range of
complex is quite stable with the stability constant of 4.21×10⁵.
solutions for each measurement.
Through the investigations on the composition of the complex and
*Calculating concerntration of Ni(II) and Zn(II) ions: Table 3.11
modern physico-chemical analysis methods FT-IR, 1H-NMR và 13C-NMR, MS,
synthesizes and treats statistically the analytical results of H1, H2, H3, H4
the structure of the complex proposed under the general formula
mixtures.
Zn(C8H8ON3SBr).H2O.
2+
2+
Table 3.2. Analytical results of Ni and Zn mixture in synthetic samples
Synthesis of the Co(II)–5-BSAT complex: The procedure is similar to
by HPSAM at wavelength pair λ1 = 370 nm, λ2 = 399 nm
Solution
H1
Zinc
CLT
M)
5.00
(106
Standard
6
CTN (10 M)
deviation
CV (%)
S
4.97 ± 0.24
0.095
1.92
3.3.2. Co(II)–5-BSAT complex
Recovery
(%)
99.4
section 3.3.1
Study on the proposed structure of the Co(II)–5-BSAT complex
The results show that, the Co(II)–5-BSAT complex is a complex with a
1:2 metal:ligand stoichiometry. The molecular formula of the complex is
Co(C8H7ON3SBr)2.
16
13
In the complex, 5-BSAT reagent behaves as a tridentate ligand,
General conclusions:
coordinating to the central ion through azomethine nitrogen atom, sulphur atom
We have investigated the formation of a new complex between 5-BSAT
and phenolic oxygen atom, forming five- and six-membered heterocycles. The
reagent and Zn(II) ion, studied the structure, complexation in solution of
geometry of Co(II) complex is octahedral. Based on the above results, the
Co(II)–5-BSAT và Ni(II)–5-BSAT complexes, and also optimum conditions.
structure of Co(II)–5-BSAT is proposed as shown in Fig. 3.27.
In addition, we also investigated the complex formation in solution of
Cu(II) complex. The results of studying the formation of Zn(II), Ni(II), Co(II)
and Cu(II) complexes are summarized in Table 3.4.
Table 3.1. Summary of complex study results of 5-BSAT with
Zn(II), Co(II), Ni(II), Cu(II)
Zn(II)–5-BSAT Co(II)–5-BSAT Ni(II)–5-BSAT Cu(II)–5-BSAT
Fig. 3.3. Structure of the Co(II)-5-BSAT complex
3.3.3. Ni(II)-5-BSAT complex
Synthesis of the Ni(II)–5-BSAT complex: The procedure is similar to
λmax (nm)
381
405
378
395
pH
6.5 – 7.0
5.0 – 6.0
6.5 – 7.0
5.0 – 6.0
Durability
30 min
45 min
30 min
45 min
Linear range
section 3.3.1
Study on the proposed structure of the Ni(II)–5-BSAT complex
Composition
-6
2.0×10 –
8.0×10 –
2.0×10 –
4.0×10⁻⁶–
6.0×10⁻⁵ M
8.0×10⁻⁵ M
6.0 ×10⁻⁵ M
9.6×10⁻⁵ M
1:1
1:2
1:2
1:1
The results show that, the Ni(II)–5-BSAT complex is a complex with a
β
4.21×10
1:2 metal:ligand stoichiometry. The molecular formula of the complex is
ε
1.08×10⁴
Ni(C8H8ON3SBr)2.
(L.mol−1.cm−1)
In the complex, the 5-BSAT reagent behaves as a bidentate ligand,
Proposed
coordinating to the central ion through azomethine nitrogen atom and sulphur
structure
5
-6
1.28×10
12
1.16×10⁴
-6
4.45×10
11
0.92×10⁴
6.81×10⁵
1.09×10⁴
atom, forming five-membered heterocycles. The geometry of the Ni(II)
complex is square planar. Based on the above results, the structure of the
Ni(II)–5-BSAT is proposed as shown in Fig. 3.29.
Br
The results showed that, in weak acidic media, the 5-BSAT reagent
forms complexes with ion Ni(II), Zn(II), Cu(II) and Co(II) with the maximum
OH
HN
H2N
N
S
NH2
absorbances at 378 nm, 381 nm, 395mn and 405 nm, respectively. The
OH
experimental data showed the formation of a complex with a 1:1 (for Zn(II) and
Ni
S
NH
N
Cu(II) complexes) or 1:2 (for Co(II) and Ni(II) complexes) metal:ligand
Br
stoichiometry. The reagent coordinated as an ONS tridentate or NS bidentate
Fig. 3.4. Structure of the Ni(II)- 5-BSAT complex
ligand through the azomethine nitrogen atom, the sulfur atom and the oxygen
14
15