Foreign capital flows and stock market – case study in vietnam for foreign investors’ decision of trading and their ownership
Bạn đang xem bản rút gọn của tài liệu. Xem và tải ngay bản đầy đủ của tài liệu tại đây (496.41 KB, 33 trang )
UNIVERSITY OF ECONOMICS
INSTITUTE OF SOCIAL STUDIES
HO CHI MINH CITY
THE HAGUES
VIETNAM
THE NETHERLANDS
VIETNAM – NETHERLANDS
PROGRAMME FOR M.A IN DEVELOPMENT ECONOMICS
FOREIGN CAPITAL FLOWS AND STOCK MARKET –
CASE STUDY IN VIETNAM FOR FOREIGN INVESTORS’
DECISION OF TRADING AND THEIR OWNERSHIP
A thesis submitted to Vietnam – Netherlands Program in partial fulfillment
of the requirements for the degree of
MASTER OF ARTS IN DEVELOPMENT ECONOMICS
By
Ngo Van Man
Supervisor
Dr. Nguyen Trong Hoai
HO CHI MINH CITY, January 2013
ACKNOWLEDGEMENTS
I am not able to finish this thesis without the guidance of my supervisors and
committee members, supports from my classmates and colleagues as well as
motivation and sharing from my wife.
I would like to express my very great appreciation to my supervisors, Dr. Nguyen
Trong Hoai and Dr. Nguyen Xuan Thanh, for their patient guidance, enthusiastic
assistance, valuable comments and suggestions as well during my research. I also
would like to take this change to thank Dr. Nguyen Tan Thang for his ideas inspiring
me to pursuit this topic for my thesis. I highly appreciate staffs of the Administration
Department and Library of Vietnam-Netherlands Program and my classmates in
providing me good environment , facilities and supporting me technically to complete
the thesis.
Finally, I would like to express my love and gratitude to my wife and colleagues
for their understanding, supports, and encouragements to finish the research.
TABLE OF CONTENTS
CHAPTER 1: INTRODUCTION ............................................................................ 1
1.1
Problem Statement: ...................................................................................... 1
1.2
Research questions: ...................................................................................... 1
1.3
Research objectives: ..................................................................................... 1
2.1
Economic theories: ....................................................................................... 2
2.1.1 Definition of key concepts: .................................................................. 2
2.1.2 Relationship between foreign investor and firm characteristics .......... 3
2.2
Related empirical studies:............................................................................. 5
2.3
Conceptual framework: ................................................................................ 6
3.1
Research context:.......................................................................................... 7
3.2
Source of Data and its definition: ................................................................. 7
3.3
Research Methodology: ................................................................................ 9
4.1
Descriptive Data Analysis .......................................................................... 10
4.1.1 Summary of Data: .............................................................................. 10
4.1.2 Correlation Matrix ............................................................................. 13
4.2
Empirical Results: ...................................................................................... 13
4.2.1 For the whole sample : ....................................................................... 13
(a)
Firm characteristics and foreign investor’s buying volume: ............. 13
(b) Firm characteristics and foreign investor’s selling volume: .............. 14
(c)
Firm characteristics and net purchase variable in relation to foreign
investor’s ownership ratio ...................................................................................... 14
4.2.2 For specified industries: ..................................................................... 15
(a)
Finance Industry ................................................................................ 15
(b) Construction Industry ........................................................................ 16
(c)
5.1
Manufacturing Industry ..................................................................... 17
Conclusions ................................................................................................ 18
5.1.1 Empirical results ................................................................................ 18
5.2
Policy recommendation: ............................................................................. 19
5.2.1 For investors: ..................................................................................... 19
5.2.2 For companies: ................................................................................... 19
5.2.3 For government authority: ................................................................. 19
5.3
Limitations and Further research ................................................................ 20
5.3.1 Limitations: ........................................................................................ 20
5.3.2 Further research: ................................................................................ 20
REFERENCES: ..................................................................................................... 21
APPENDICES: ...................................................................................................... 24
LIST OF TABLES
TABLE
PAGE
Table 2.1: Summary of related empirical studies as following
5
Table 2.2: Summary of Expected signs
6
Table 3.1: Viet Nam Stock Market capitalization
7
Table 3.2: The structure of industry in dataset
8
Table 4.1:Description of variables of the whole sampled stocks
10-11
Table 4.2: The summary of value traded of the whole sample
11
Table 4.3: Percentage of FDI and Portfolio inflows over GDP in Viet Nam
12
Table 4.4: The summary of statistics by mean of each industry
12
Table 4.5: The coefficient signs between buy-volume with other variables
13
Table 4.6: The coefficient signs between sell-volume with other variables
14
Table 4.7: The coefficient signs between ownership ratio with other variables
14
Table 4.8: The coefficient signs for finance industry
15
Table 4.9: The coefficient signs for construction industry
16
Table 4.10: The coefficient signs for manufacturing industry
17
ABSTRACT.
Foreign capital flow in empirical studies has recently recovered into the developing
countries and emerging markets. Their impact on growth of such countries has
empirically increased and also created some negative temporary effects. Foreign
direct investment positive correlates to growth, meanwhile portfolio investment seems
to be negative correlated with it. One of such effects through stock market is blamed
for the crisis. This paper aims to evaluate how firm’s characteristics affect to foreign
investors in their investment both in buying and selling decision into listed firms in
Vietnam stock market and to figure out their longer positions after that.
Keywords: foreign investors, stock market, firm characteristic
CHAPTER 1: INTRODUCTION
1.1 Problem Statement:
Financial integration has so far benefited to not only source countries but also host
countries. One of those benefits is to increase in investment in which capital flows from
the capital-abundant places to hosts especially in developing countries.
As a matter of fact, in order to diversify risks in foreign investment as well as to cover
the more often crisis in the global economy many hedge funds have also set up and
operated to meet such trends. Actually, portfolio investment inflows, together with
foreign hedge funds, were blamed for the crisis.
This paper aims to study the relationship between foreign investors’ investment
decision and the stock market via volume of trading of foreign investors in Viet Nam
specified to those stocks heavily traded by foreign investors. Therefore, this paper also
helps to provide investors both domestic and foreign investors an adequate understanding
about types of companies attractive the foreign investor’s decision of buying or selling as
well as their long term position via ownership ratio.
1.2 Research questions:
The final purpose of this paper is to answer the following questions:
(i)
Do foreign investor’s buying and selling decisions really focus on stocks of large
companies with better profitability?
(ii) How do their buying and selling volume affect to their ownership ratio?
1.3 Research objectives:
The overall objective of this paper aims to evaluate which firm’s characteristics affect to
foreign investors’ decision of selling and buying as well as to their ownership ratio for
long term position. Subsequently, the paper will further clarify them for each related
industry.
1
CHAPTER 2: LITERATURE REVIEWS
2.1 Economic theories:
2.1.1 Definition of key concepts:
(a) Foreign capital flows
Typically, foreign capital flows into the host countries especially into developing and
emerging ones in three channels: foreign direct investment, portfolio investment and
foreign debt. Theoretically, foreign direct investment flows into two ways: Greenfield
and Merge & Acquisition activities which have been significantly increased in emerging
markets (World Economic and Social Survey 2005). Portfolio investment in other hand
includes equity securities or debt securities in forms of bonds, money market instruments,
and financial derivatives.
Investors in country A could invest in country B or vice versa to seek for
diversification in their portfolios in term of risk (balancing their portfolios) and expected
(equity) return.
(b) Foreign investment in relation to stock market
In many empirical studies, Foreign Direct Investment has also significantly and
positively affected to domestic stock market development. (Adam and Tweneboah). FDI
which was found to be a complement of stock market development has positively
correlated with market capitalization and domestic value traded. (Claessens et al.,2001).
Furthermore, along with the more global integration in finance market, foreign
investment in portfolio investment has been empirically found increasing with its certain
advantages such as a high mobility in flowing out and in markets as well as to reduce
some existing limitations in the bond market in developing and emerging markets.
In short, foreign investors always seek for investment opportunities. In other words,
foreign investment flows from firms with low investment opportunities to firms with high
ones. However, an average return of some types of investors’ portfolios appears rather
differentiated in which some investors actually want to own stocks or firms for specified
objectives such as their business relationship and control rather than a high investment
return (Kim et al, 2005).
2
(c) Firm characteristics: Financially, analyzing firm characteristics concentrates on ratio
analysis. According to Ross et al. (2005;2010), ratio analysis is often classified into
following groups: Market value measures; Profitability Measures; Short term solvency or
liquidity measures; Long term solvency measures; and asset management or turnover
measures.
The paper will mainly focus on four of five above groups including market value,
liquidity, profitability and long term solvency measures. Furthermore, the paper will also
take account of dividend policy because this policy along with others will affect to firm’s
ability to sustain growth (Ross et al.,2005;2010).
2.1.2 Relationship between foreign investor and firm characteristics
According to Baker et al. (2009), FDI flows are much affected by components of stock
evaluations which have been used to reflect mispricing specially in presence of capital
account restrictions to limit arbitrage by portfolio investors.
a) Relationship between foreign investor with market value measures:
Market capitalization has empirically a strong relationship with stock returns of foreign
investors’ investment. Due to redemption and liquidity requirement for foreign
investment as well as to prevent systematic risk, foreign investors prefer large market
capitalization firms.
Some studies demonstrated that foreign investors tend to prefer large market
capitalization and strong financial firms (Kang and Stulz,1997; Lin and Shiu,2001; and
Kim et al.,2005). On the contrary, other studies show a negative relationship that on
average, smaller-size firms get higher stock returns than large-size firms (Banz,1981;
Keim,1983 and Basu,1983).
In regard to PB and PE ratio, some showed a negative relationship between PB ratio
and stock returns ( Fama and French,1992; Daniel and Tittman, 1997). Hence, foreign
investors can gain higher stock returns as they buy low PB stocks (Dhatt Kim and
Mukherji,1999). On the contrary, others demonstrated that foreign investors prefer stock
with high PB ratio (Lin and Shiu,2001 ; Kim et al.,2005; and Bae et al.,2011).
In regard to PE ratio, this is considered to be the single most important variable in
determining a share’s price. As a matter of fact, Basu (1977), Breen (1978) and Dreman
3
(1980a,1980b,1979) demonstrated that stocks with low PE ratio can gain a higher
average returns than those with high PE ratio. However, some recently empirical studies
found that foreign investors tend to buy stocks outperformed and sell stocks
underperformed relative to the market (Bae et al.,2011)
b) Relationship between foreign investor with Profitability Measures:
According to Kim et al. (2005), there has been a positive correlation between foreign
ownership and ROE ratio which was considered to be an important variable to foreign
investors. Similarly, Bae et al. (2011) found that foreign investors traded stocks in
Korean listed companies with high ROE and ROA ratio in which not only for the same
current period but also for the subsequent period, their “buy” stocks have higher
profitability than their “sell” stocks. Furthermore, Kang et al.(2010) in studying firms
listed on Korean Stock Exchange also demonstrated that corporate profitability measured
by the EBITDA has positively correlated with foreign ownership.
c) Relationship between foreign investor with liquidity measures:
According to Kang et al.(2010), liquidity ratio has positively correlated with foreign
ownership into Korean Stock Exchange listed companies. However, Vo Xuan Vinh
(2010) found that liquidity ratio has negatively correlated with foreign ownership for
firms listed on Ho Chi Minh Stock Exchange.
In other words, foreign investors seem to follow a buy and hold strategy for their long
term position rather than for short term.
d) Relationship between foreign investor with financial leverage ratio:
Many empirical studies revealed that foreign investors favor firms with low debt
ratio. (Kang and Stulz, 1997; Lin and Shiu,2001; Kang et al.,2010 and Vo Xuan Vinh,
2010). In other words, foreigners prefer firms with low leverage ratio as well.
Meanwhile, Bae et al.(2011) studied and found that firm leverage is not an important
variable affect to foreign investor’s decision of buying or selling. This is also consistent
with the finding of Mishra and Ratti (2011).
e) Relationship between foreign investor with Dividend Policy:
Besides preferring large-size firms , foreign investors were found to prefer stocks with
high dividend yield (Jeon et al., 2010; Mishra and Ratti, 2011 and Bae et al.,2011).
4
Meanwhile, Dahlquist and Robertsson (2001) found that foreign investors also prefer
stocks of lower paid-dividend firms.
2.2 Related empirical studies:
Table 2.1: Summary of related empirical studies as following table:
Authors Observations
Dependent
Independent
Research
Variables
Variables
Method
Key Findings
Lin and
Firms in Taiwan
Foreigner’s
Firm’s
Panel data with
They prefer large firms
Shiu
Stock.E ( 1996-
ownership
characteristic
random effect
with high PB ratio, low
2000)
ratio
s
model
dividend yield.
Fama–French
F.ownership
three-factor
correlated with firm size,
mode
PB ratio and ROE.
(2003)
Firms in Korean
Kim et al. (1993-2002)
(2005)
Tokyo (19862001) Stock.E
Pimnara
Hiranka
si (2008)
Vo
Xuan
Vinh
(2010)
Bae et
al.
(2011)
foreign and
institutional
ownership
Firm size, PB
ratio, ROE,
average
return
20 stocks in
Daily
PE,PC,MKC,
A standard
Thailand stock
purchase, and
Price,
linear model,
Market (1999-
total value of
ownership
Panel data with
2003)
foreigners
data
pooled model
firms listed on
Foreigner’s
Firm’s
HOSE (2007-
ownership
characteristic
2009)
ratio
s
Buying and
ROA,ROE,
selling
Debt ratio,
among
PE, PB,
groups of
Dividend,
investors
CF⁄ Sales
Daily trading in
Korean Stock
Market (19962000)
A standard
linear model,
Panel data with
Pooled model
5
positively
Their buying, selling and
net
purchase
have
a
positive relationship with
firm size and negative
relationship with PE ratio
Foreigners prefer large
firms, firms with low PB,
or low leverage ratio.
They buy stocks with
three reference
pricing models
higher ROE and ROA
than their selling, prefer
stocks of large firms and
high dividend yield.
2.3 Conceptual framework:
FIRM’S CHARACTERISTICS:
OWNERSHIP
RATIO
1. Market Value
Market Capital (VND billion)
PB (x)
PE (x)
2. Profitability
ROE (%)
ROA (%)
EBITDA
3. Liquidity
Current Ratio (times)
Quick Ratio (times)
4. Financial leverage
Debt to equity ratio
5. Dividend Policy
Dividend per Share (VND)
Net purchase
SELLING
AND
BUYING
VOLUME
All expected relationships among variables could be likely summarized as the
following tables:
Table 2.2: Summary of expected signs:
Expected signs Buy volume Sell volume Ownership ratio
Market Capital
EBITDA
ROE
ROA
PE
PB
Dividend Yield
Debt ratio
Current Ratio
Quick Ratio
Net_buy
+
+
+
+
+
-
+
+
+
+
+
6
+
+
+
+
+
+
+
CHAPTER 3: RESEARCH METHODOLOGY
3.1 Research context:
Established and operated since 2000 for Ho Chi Minh Stock Exchange (hereafter HSX)
and since 2005 for Hanoi Stock Exchange (hereafter HNX), role of stock market in
mobilizing capital for the whole economy was very impressive and indispensable with
their yearly percentage of the total volume over GDP as the following table.
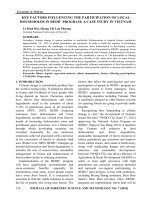
Table 3.1: Viet Nam Market capitalization
Vietnam stock Market capitalization (%GDP)
30.0%
25,000
27.5%
25.0%
20,000
21.8%
20.0%
19.2%
15.0%
15,000
14.8%
10,000
10.5%
10.0%
5,000
5.0%
0.0%
2007
% GDP
2008
2009
2010
2011
Market capitalization of listed companies (current US$ mil.)
Source: Word Bank – Global Financial Data
3.2 Source of Data and its definition:
Firstly, the research will select data from 2007 to 2011 just because only from 2006
onward the total volume trading by foreign investors has significantly increased.
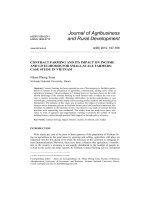
Secondly, the paper will focus on listed stocks of three main industries in HSX and
HNX as described above including Construction and Real Estate, Manufacturing and
Finance and Insurance which have listed from 2007 backward and their market
capitalization for finance industry over VND 100 billion (as of July 13, 2012) and
reported the foreign trading generated. This sample of more 98 listed firms and observed
over 05 years will therefore turn out over 420 observations with their structure as
following:
7
Table 3.2: the structure of industry in dataset(as of July 13, 2012)
Source: Author’s calculate on the data set
Firm characteristics:
(i) Market Capitalization (MKC): this variable is the market capitalization of each firm
at the year-end.
(ii) Dividend paid (DIV): how much dividend actually paid to each shareholder.
(iii) Price Book ratio (PB): A ratio of a listed firm’s book value to its market value. It
determines how the market prices a company relative to its actual worth and measured by
market value divided its book value.
(iv) Price Earning ratio (PE): a share price divided by earning per share
(v) Return on Equity (ROE): Net income divided by the book value of equity at year
end.
(vi) Return on Asset (ROA): An indicator to measure how profitable a company is
generated from the invested capital (assets)
(vii) Earnings before Interest, Taxes, Depreciation and Amortization (EBITDA). This
indicator is used to eliminate the effects of financing and accounting decisions and
therefore to analyze and compare profitability among selected companies better.
(viii) Ownership rate (OWN): measured how many percent of shares hold by foreign
investors. As required by Foreign Investment Laws the maximum room available for
8
foreigners to invest into each company is not higher than 49%. This requirement affects
so much to foreigner’s decision of trading.
(ix) Debt to Equity Ratio.(DEBT): defined by total liabilities divided total equity often
at year end
(x) Current Ratio (C_Ratio): measures a company's ability to pay short-term obligations
calculated by current assets divided by current liabilities
(xi) Quick Ratio (Q_Ratio): is calculated as (Current Assets - Inventories) / Current
Liabilities
3.3 Research Methodology:
The estimated equation is a linear regression model as follows:
Yi,t = αi + X j, i , t β + εit (*)
In where:
- YI,t denotes buying, selling and ownership ratio for firm i at trading year t
-
XJ, I, t presents the firm characteristic variables j of firm i at year t which are divided into
stock characteristics including MKC, PB, P/E ratio, ROE, ROA, EBITDA , DEBT ,
C_Ratio, Q_Ratio or Dividend Yield .
-
αi are random individual-specific effects, β is a vector of our robust estimators; and ε
is a error term;
The paper will employ the panel data which have advantages over pooled data. In order
to select the most appropriate models for specified samples, the paper will test all
possible regression models including: Fixed-Effects Model (also called Least Squares
Dummy Variable Model); Random-Effects Model (or Random Intercept, Partial Pooling
Model); Pooled model or population-averaged model.
After finalizing the appropriate model, to control for heteroskedasticity the option
“robust” will be employed in regression. Finally, in order to detect the likely
multicollinearity among variables the paper will use the variance inflation factor after
regression model. Such tests will be easily found in the appendix of this paper.
9
CHAPTER 4: DATA ANALYSIS AND DISCUSSION
4.1 Descriptive Data Analysis
4.1.1 Summary of Data:
Table 4.1: Description of variables of the whole sampled stocks:
Industry
buy
sell net_buy own MKC
Mean
5.53
5.05
0.48 0.17
2,932
SD
9.54
8.49
5.12 0.16
5,780
Construction
CV
1.72
1.68 10.62 0.95
2.0
Obs.
148
148
148 131
148
Mean
13.59 11.28
2.31 0.2 10,800
SD
17.56 22.15 11.17 0.18 13,102
Finance
CV
1.29
1.96
4.84 0.91
1.2
Obs.
69
69
69
64
69
Mean
3.02
2.68
0.34 0.2
1,728
SD
7.56
5.89
3.45 0.18
5,088
Manufacturing
CV
2.51
2.2 10.07 0.89
2.9
Obs.
203
203
203 175
203
Mean
5.64
4.93
0.71 0.19
3,643
SD
11.1 11.44
5.97 0.17
7,903
Total
CV
1.97
2.32
8.36 0.92
2.2
Obs.
420
420
420 370
420
Source: Author’s calculate on the data set with Stata software.
DIV EBITDA
1,230
373
1,042
643
0.9
1.7
148
148
849
1,354
846
2,635
1.0
2.0
69
69
1,449
287
1,049
570
0.7
2.0
203
203
1,273
493
1,036
1,255
0.8
2.6
420
420
Market capitalization of the finance industry is the highest; the construction and
manufacturing industry followed as the second and third of market capitalization. In
addition, stocks of construction field were priced at the highest mean value at 25 times,
followed by stocks of finance and manufacturing at 15 and 11 times, respectively.
In general, foreign ownership ratio at firms surveyed in three industries is not much
different at 20% of both finance and manufacturing industry and 17% of the construction
industry. And the mean of debt ratio in the construction field is extremely high at 2.35
times followed by manufacturing and finance industry at 1.33 and 0.66 times,
respectively.
10
Table 4.1: Description of variables of the whole sampled stocks (continued):
Industry
PE
PB
ROE ROA C_Ratio Q_Ratio
Mean
25.86
2.04
0.2 0.07
1.9
1.1
SD 137.41
1.86
0.15 0.06
1.4
1.2
Construction
CV
5.31
0.91
0.73 0.87
0.7
1.1
Obs.
148
148
148 148
148
148
Mean
15.31
1.68
0.05 0.08
3.1
3.3
SD
25.63
1.13
0.13 0.12
6.0
6.2
Finance
CV
1.67
0.67
2.5 1.41
1.9
1.9
Obs.
69
69
69
69
69
69
Mean
11.78
1.7
0.18
0.1
2.1
1.2
SD
15.18
1.41
0.18 0.09
1.7
1.3
Manufacturing
CV
1.29
0.83
1.01 0.95
0.8
1.1
Obs.
203
203
203 203
203
203
Mean
17.32
1.82
0.17 0.09
2.2
1.5
SD
82.97
1.55
0.17 0.09
2.8
2.9
Total
CV
4.79
0.86
1.02 1.03
1.3
1.9
Obs.
420
420
420 420
420
420
Source: Author’s calculate on the data set with Stata software.
Debt
2.4
2.0
0.9
148
0.7
1.2
1.8
69
1.3
1.2
0.9
203
1.6
1.7
1.1
420
Table 4.2: The summary of volume and value traded of the whole sample
(unit in VND million)
Total_Trade
Construction
Netbuy
Total_Trade
Finance
Netbuy
Total_Trade
Manufacturing
Netbuy
Total_Trade
Total
Netbuy
2007
2008
2009
2010
2011
260,582 515,298 1,000,398 1,245,846 1,327,711
113,864
-18,814
-43,780
243,860
-77,107
471,314 1,522,979 1,921,513 2,238,626 3,306,228
189,540 305,754
278,426
498,110 -185,480
346,913 588,277
640,126
404,339 541,744
104,651
-10,145
-20,412
52,677
45,261
329,048 660,747 1,011,855 1,075,944 1,376,447
115,168
19,748
27,847
210,881
-44,337
Source: Author’s calculate on the data set with Stata software.
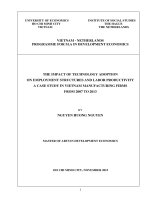
In compared to net inflows of portfolio equity into Viet Nam as the following table
(table 4.3), it revealed a meaning fact that a large net inflow of portfolio equity flowed in
Viet Nam accounted for 2.24% of GDP in 2010. The year with the reported average PE
ratio of the whole sample was lowest at 10 times (table 4.4). In other words, stocks in
2010 were cheapest during five years.
11
Table 4.3: Percentage of FDI and Portfolio inflows over GDP in Viet Nam
Indicator
2007
Foreign direct investment, net inflows
(% of GDP)
Portfolio equity, net inflows (% of GDP)
2008
2009
2010
2011
9.43% 10.52% 7.82% 7.52% 6.01%
8.79% -0.63% 0.13% 2.24% 0.86%
Source: World Bank - Global Financial Data
In short, Vietnam stock market as being underpriced seemed always to be attractive to
foreign capital inflows, especially in term of portfolio equity inflows. To get a clearer
overview of variables over year, the following statistics of mean of variables during five
years could exhibit their likely trend.
Table 4.4: the summary of statistics by mean of each industry:
Industry
Construction
Finance
Manufacturing
Total
2007
28.2
21.2
27.3
27
Industry
Construction
Finance
Manufacturing
Total
2007
0.29
0.28
0.21
0.25
Industry
Construction
Finance
Manufacturing
Total
2007
1.61
4.56
1.15
1.6
Industry
Construction
Finance
Manufacturing
Total
2007
2.29
1.24
1.21
1.58
PE (times)
2008 2009 2010
13.4 60.4 10.3
30.9 16.7 11.4
7.4 12.3
9
11.9 30.4
10
ROE
2008 2009 2010
0.19 0.26 0.22
-0.02 0.10 0.04
0.1 0.24 0.21
0.12 0.22 0.18
Quick Ratio
2008 2009 2010
0.88 1.21 1.03
1.61 2.05 3.07
1.38 1.36 1.09
1.23 1.43 1.45
Debt Ratio
2008 2009 2010
2.77 2.34 2.08
0.31 0.79 0.71
1.31 1.25 1.29
1.7 1.55 1.47
2011 2007
15.7
5.2
9.8
4.7
6.4
3.9
10.3
4.4
2011 2007
0.09 0.10
0 0.17
0.15 0.11
0.1 0.11
2011 2007
0.83 2.24
4.96 4.56
1.03 2.03
1.75 2.32
2011 2007
2.36 0.11
0.48 0.31
1.54 0.19
1.61 0.18
PB (times)
2008 2009 2010
1.4 2.5 1.6
1.3 2.1 1.5
1.1 1.8 1.3
1.2 2.1 1.5
ROA
2008 2009 2010
0.06 0.10 0.08
0.04 0.12 0.07
0.06 0.13 0.11
0.06 0.12 0.09
Current Ratio
2008 2009 2010
1.58 2.10 1.93
1.46 1.99 2.99
2.56 2.25 1.96
2.12 2.15 2.15
Ownership ratio
2008 2009 2010
0.13 0.16 0.23
0.16 0.21 0.20
0.19 0.19 0.23
0.16 0.18 0.22
Source: Author’s calculate on the data set with Stata software.
12
2011
0.8
0.8
0.8
0.8
2011
0.03
0.05
0.09
0.06
2011
1.72
4.68
1.85
2.38
2011
0.16
0.20
0.18
0.18
4.1.2 Correlation Matrix
Finally, from the correlation matrix of variable (see Appendix 5) , at a glance we can
see except that coefficients between ROE and ROA; Quick and Current ratio have a high
correlation, other correlated coefficients among variables are not high. Hence, the
regression model will take account into multicollinearity among such variables.
4.2 Empirical Results:
4.2.1 For the whole sample :
(a) Firm characteristics and foreign investor’s buying volume:
Table 4.5: The coefficient signs between buy-volume with other independent variables:
Buy volume
Whole sample Finance stocks
MKC
EBITDA
ROE
ROA
PE
PB
Dividend Yield
Debt
Quick Ratio
+
+
+
+
+
(***)
(**)
(**)
(**)
+
+
+
+
(***)
Construction stocks
+
+
(***)
(***)
-
(***)
(***)
(***)
Manufacturing stocks
(***)
(***)
+
+
-
(***)
(**)
+
+
+
(***)
(***)
(***)
(***)
(***)
(***)
(*** and ** present statistical significance level at lower 5% and 10%, respectively)
It can infer that foreign investors tend to buy value stocks of large firms in finance
and construction industry with better performance and low financial leverage. And for all
industries they decrease their buying volume for firms with high debt ratio. Such findings
are almost consistent with previous empirical studies.
13
(b) Firm characteristics and foreign investor’s selling volume:
Table 4.6: The coefficient signs between sell-volume with other independent variables:
Sell volume
Whole sample Finance stocks
MKC +
EBITDA +
ROE +
ROA
PE +
PB Dividend Yield Debt +
Quick Ratio +
(**)
(***)
(***)
+
+
+ (***)
+
+ (***)
-
Construction stocks
+
+
-
(***)
(**)
(**)
Manufacturing stocks
+
-
(***)
(***)
(**)
(**)
+
+
(**)
(***)
(*** and ** present statistical significance level at lower 5% and 10%, respectively)
Sell-volume variable for most samples has a positive relationship with EBITDA except
for finance industry which sell-volume variable also has a significantly positive
relationship with ROE ratio, a negative relationship with PB ratio except for
manufacturing industry.
Market size is only to affect to foreign investor’s selling decision in finance industry.
The relationship among other variables is separately differentiated.
(c) Firm characteristics and net purchase variable in relation to foreign investor’s ownership
ratio
Table 4.7: The coefficient signs between ownership ratio with other independent variables:
Ownership
Net_buy
MKC
EBITDA
ROE
ROA
PE
PB
Dividend Yield
Debt
Quick Ratio
Whole sample
+
+
+
+
-
(***)
(***)
(**)
(***)
Finance stocks
+
+
+
+
+
-
(**)
Construction stocks
+
+
+
Manufacturing stocks
+
+
(***)
(***)
***)
+
- (***)
- (***)
+
(***)
+
+
(***and ** present statistical significance level at lower 5% and 10%, respectively)
14
Taken each separated result of buy volume and selling volume together, these findings
suggest that although foreign investors prefer buying stocks of large firms with better
performance, but for a longer position via their ownership ratio, they just want to own
firms with low financial leverage without caring their firm size except.
Similarly, EBITDA which is found as a key important variable affect to their decision
of buying and selling does actually play nothing in regard to their ownership ratio. Such
an EBITDA indicator only plays important role in construction field which most of their
assets are tangible ones and imposed by one of three current depreciation and
amortization methods available flexible to firm.
4.2.2 For specified industries:
(a) Finance Industry:
Table 4.8: The coefficient signs for finance industry:
Finance stocks
MKC
EBITDA
ROE
ROA
PE
PB
Dividend Yield
Debt
Quick Ratio
Net_buy
Buy Volume
+
+
+
+
(***)
Sell Volume
+
+
+
(***)
(***)
-
(***)
(***)
(***)
(***)
(***)
(***)
(**)
(**)
Ownership ratio
+
+
+
+
+
(***)
(***)
(**)
(*** and ** present statistical significance level at lower 5% and 10%, respectively)
Although foreign investors prefer trading value stocks of large firms with high
profitability, low leverage ratio as well as with low dividend yield, they just want to own
firms with high profitability and low financial leverage ratio via continuously holding
their net purchase over years. Firm’s market capitalization does not really affect to their
long term position via ownership ratio.
15
(b) Construction Industry:
Table 4.9: The coefficient signs for construction industry:
Construction stocks
Buy volume
MKC +
EBITDA +
ROE
ROA PE PB Dividend Yield Debt Quick Ratio Net_buy
(***)
(***)
(***)
(**)
(***)
(***)
Sell volume
Ownership ratio
+
+
+
+
+
+
-
- (***)
- (***)
+
+
(***)
(***)
(**)
(**)
(***)
(***and ** present statistical significance level at lower 5% and 10%, respectively)
For construction stocks, foreign investors tend to buy value stocks of large firms being
under priced and with low dividend yield and leverage or quick ratio. Meanwhile, they
incline to sell value stocks being over priced or of firms with high leverage ratio. Firm
size does not actually affect to their selling decision.
For a long term position, they just want to own firms with better profitability (high
EBITDA) , low financial leverage ratio and being under priced. Firm’s market size also
does not play an important factor to their long term decision.
16
(c) Manufacturing Industry :
Table 4.10: The coefficient signs for manufacturing industry:
Manufacturing stocks
Buy volume
MKC +
EBITDA +
ROE ROA
PE PB +
Dividend Yield +
Debt Quick Ratio +
Net_buy
(***)
(***)
(***)
(***)
Sell volume
Ownership ratio
+
-
+
+
+
(***)
(**)
+
(***)
+
+
+
(*** and ** present statistical significance level at lower 5% and 10%, respectively)
For manufacturing stocks, foreign investors trade stocks of high profitability in which
they tend to buy growth stocks of firms with low financial leverage ratio, to sell stocks of
firms with high quick ratio. This seems to meet the fact discussed in item 4.2.2/part c that
the market capitalization of the manufacturing industry is lowest in all industries, a high
quick ratio shows an inefficient use of cash and cash equivalent assets.
Firm’s market capitalization does not affect to their trading both in buying and
selling, it just only affects to their long term position via their ownership ratio.
17
CHAPTER 5: CONCLUSIONS
5.1 Conclusions:
5.1.1 Empirical results:
In relation to firm’s market value, the results show that firm’s market size does not
significantly affect to their decision of buying and selling for the whole sample, it just
influences their buying decision in finance and construction industry, and their selling
decision in finance industry.
In regards to firm’s profitability, the findings strongly support the hypothesis that
foreign investors prefer trading stocks of firms with high profitability for short term
position as well as for long term position. Furthermore, besides ROE and ROA ratio as
indicators to measure firm’s profitability, EBITDA is also one another important factor
affect to their decision of buying ,selling for short term position and of ownership ratio
for long term position.
In regards to firm’s leverage ratio, the results significantly support the hypothesis that
when foreign investors prefer buying and holding stocks of firms with low leverage ratio
almost for all industries. Meanwhile, foreign investors only sell stock of firms with high
leverage ratio in the construction industry which agrees with the hypothesis, but differ
from the hypothesis when foreign investors only sell stocks in the finance industry with
low leverage ratio and also in manufacturing industry but not statistically significant.
In regards to firm’s liquidity, the paper reveals that quick ratio rather than current
ratio is statistically significant to measure it. However, the finding of relationship
between it with ownership ratio is mixed and not statistically significant to conclude.
Similarly, although it has positively correlated with buying and selling volume for the
whole sample but not statistically significant. Instead, it partially has significance in each
separate industry.
In connection with firm’s dividend policy, ownership ratio of all industries has almost
positively correlated with it but not statistically significant. That is the same to
relationship between it with buying and selling volume for almost industries except in the
finance industry that foreign investors prefer trading stocks of firms with low dividend
yield.
18
5.2 Policy recommendation:
5.2.1 For investors:
For domestic investors who often refer trade of foreign investors to make their own short
term investment in firms rather than other objectives, it’s necessary to consider firm size
along with better profitability significantly measured by EBIDTA indicator, especially in
stocks of construction field in term of buying decision and of manufacturing field in term
of selling decision, rather than ROE or ROA ratio as usual.
Such investors should be careful as considering PB ratio to evaluate price of potential
stocks in relation to foreign investors’ trade. Because foreign investors tend to buy and
sell such stocks with low PB ratio. Especially, for stocks of construction field, they
should further consider their selling (or buying) position in relation to a high (or low) PE
ratio of stock.
Those who want to make a long term investment into firms which often benefited
much from foreign investor’s ownership ratio should closely review their net purchase
position and a debt ratio of those firms as well. In short, the higher the net purchase or the
low the debt ratio is, the more investment they should do. In addition, for construction
firms, investors should take into account EBIDTA indicator to make their long term
decision of investment.
5.2.2 For companies:
For listed companies and other companies who want to attract foreign investors, such
companies should consider their financial leverage. It’s likely that the higher this ratio,
the lower the firm’s attraction to foreign investors.
Furthermore, firms in construction field should consider their strategy in relation to
their attraction to foreign investment. Because construction related stocks are being
overpriced and foreign investors just want to reduce their ownership ratio for such stocks.
5.2.3 For government authority:
In regard to government policy, firstly there has been a positive relationship between netpurchase of foreign investors with portfolio equity. Therefore, on years reported a low or
negative net purchase of foreign investor in the stock market should be considered to
19