The impact evaluation of rural credit on accessibility to education, health care and clean water in rural vietnam
Bạn đang xem bản rút gọn của tài liệu. Xem và tải ngay bản đầy đủ của tài liệu tại đây (961.39 KB, 80 trang )
UNIVERSITY OF ECONOMICS
INSTITUTE OF SOCIAL STUDIES
HO CHI MINH CITY
THE HAGUE
VIETNAM
THE NETHERLANDS
VIETNAM - NETHERLANDS
PROGRAMME FOR M.A IN DEVELOPMENT ECONOMICS
THE IMPACT EVALUATION OF RURAL CREDIT
ON ACCESSIBILITY TO EDUCATION, HEALTH CARE
AND CLEAN WATER IN RURAL VIETNAM
BY
VO VAN TAI
MASTER OF ARTS IN DEVELOPMENT ECONOMICS
HO CHI MINH CITY, NOVEMBER 2013
UNIVERSITY OF ECONOMICS
INSTITUTE OF SOCIAL STUDIES
HO CHI MINH CITY
THE HAGUE
VIETNAM
THE NETHERLANDS
VIETNAM - NETHERLANDS
PROGRAMME FOR M.A IN DEVELOPMENT ECONOMICS
THE IMPACT EVALUATION OF RURAL CREDIT
ON ACCESSIBILITY TO EDUCATION, HEALTH CARE
AND CLEAN WATER IN RURAL VIETNAM
A thesis submitted in partial fulfilment of the requirements for the degree of
MASTER OF ARTS IN DEVELOPMENT ECONOMICS
By
VO VAN TAI
Academic Supervisor:
Dr. PHAM KHANH NAM
HO CHI MINH CITY, NOVEMBER 2013
CERTIFICATION
I hereby declare that the substance of this thesis is my own work and
knowledge. This dissertation has not been submitted for any other degree or
diploma of the university or higher degree. I certify that its contain has not been
published or written by another person.
VO VAN TAI
November 28, 2013
ACKNOWLEDGEMENTS
During the time of studying in Vietnam - Netherlands programme for M.A. in
Development Economics, I have learned so much useful knowledge. Therefore, I
want to thank to the programme and all the teachers that have taught me.
I would like to express my deepest gratitude to my academic supervisor - Dr.
Pham Khanh Nam for his guidance and valuable comments in writing and finishing
my M.A. thesis. His enthusiasm and encourage has supported me during the process
of this thesis to finish it.
Besides my supervisor, I want to acknowledge the tremendous support that I
received from Prof. Dr. Nguyen Trong Hoai – Dean of the programme for his
assistance and great encouragement.
I also would like to thank Ms. Vo Thi Phi - Director of TAN VUONG Food
and Fisheries Import and Export Company Limited, where I am working, for her
encourage and financial support, as well as the work supports of my colleagues, for
me to study and finish the programme.
My grateful thanks to my classmates, Pham Tien Thanh and Cao Thi Tuyet
Mai who helped me overcome the difficulties to finish my thesis.
Last but not least, I am truly grateful to my family for their love and spiritual
support in my life.
Thanks for all.
VO VAN TAI
November 28, 2013
ABSTRACT
The research is conducted in order to evaluate the impact of rural credit
program on living standard of the rural households. The estimation is based on the
secondary data, namely the Vietnam household living standard survey in 2010
(VHLSS2010). The research applied propensity score matching (PSM) method
with various techniques in order to estimate the impact of rural credit program on
living standard. The results found that participation in rural credit only increase the
expenditure on education while there is no evidence to conclude the relationship
between rural credit program and such living standard indicators as accessibility to
health care and clean water.
Moreover, the research also applied PROBIT model to investigate the factors
that affect the probability of accessing to rural credit program. The results showed
that the probability of participating in rural credit program of the rural households
are affected by such factors as age of household head, leadership status of
household head, household size, house value, total land owned and managed by the
household, household being poor or not, and geographic location.
The research also found that the rural credit program may not serve the poor
because among the participants in the credit program, the number of the poor
households is less than that of the non-poor households.
Finally, the research suggested policies and solution to improve the
effectiveness of rural credit program in order to support the poor households.
i
TABLE OF CONTENTS
ABSTRACT .............................................................................................................. i
TABLE OF CONTENTS ......................................................................................... ii
LIST OF FIGURES................................................................................................. iv
LIST OF TABLES .................................................................................................. iv
CHAPTER 1: INTRODUCTION .............................................................................1
1.1. Problem statement ..........................................................................................1
1.2. Objectives of the research ..............................................................................3
1.3. Research questions .........................................................................................3
1.4. Research structures .........................................................................................3
CHAPTER 2: LITERATURE REVIEW ..................................................................4
2.1. Theory of impact evaluation methods ............................................................4
2.2. Empirical studies on impact of rural credit on living standard of the rural
households. .....................................................................................................6
2.3. Empirical studies on determinants of the participation in rural credit
programs .........................................................................................................8
2.3.1. Characteristics at household head level ..................................................8
2.3.2. Characteristics at household level ..........................................................8
2.3.3. Characteristics at commune level............................................................9
CHAPTER 3: METHODOLOGY ..........................................................................12
3.1. Analytical framework ...................................................................................12
3.2. Models and estimation strategies .................................................................12
3.2.1. Determinants of demand for rural credit ..............................................13
3.2.2. Impact evaluation by PSM .....................................................................15
3.3. Data description............................................................................................18
ii
CHAPTER 4: OVERVIEWS OF RURAL CREDIT AND ACCESS TO
EDUCATION, HEALTH CARE, CLEAN WATER IN VIETNAM ....................19
4.1. Rural credit market in Vietnam ....................................................................19
4.1.1. The formal credit sector ........................................................................19
4.1.2. The semi-formal credit sector ................................................................20
4.1.3. Informal credit sectors ...........................................................................20
4.2. Accessibility to education, health treatment and clean water in Vietnam ...21
4.2.1. Accessibility to education in Vietnam ....................................................21
4.2.2. Accessibility to health treatment in Vietnam .........................................23
4.2.3. Accessibility to clean water in Vietnam .................................................24
CHAPTER 5: EMPIRICAL RESULTS .................................................................26
5.1. Non-parametric analysis ...............................................................................26
5.1.1. Descriptive Statistics .............................................................................26
5.1.2. Participation in the rural credit program of the poor ...........................28
5.1.3. Impact evaluation using two-sample t-test methods ..............................29
5.2. Results of determinants of the participation of the rural household in rural
credit programs .............................................................................................31
5.3. Impact evaluation using PSM methods ........................................................36
5.3.1. Balancing Test .......................................................................................36
5.3.2. Impact Evaluation via PSM ...................................................................39
CHAPTER 6: CONCLUSION ................................................................................43
6.1. Conclusion ....................................................................................................43
6.2. Policy Implication ........................................................................................45
REFERENCES ........................................................................................................47
APPENDIX .............................................................................................................52
iii
LIST OF FIGURES
Figure 2.1: Evaluation using a with and without comparison ..................................4
Figure 3.1: Analytical framework on how rural credit affects the accessibility to
education, health care and clean water ................................................12
Figure 5.1: The comparison about educost, health and waterexp between
participants and non-participants. .......................................................30
LIST OF TABLES
Table 2.1: Empirical studies about determinants of the participation in rural
credit programs ....................................................................................10
Table 3.1: Determinants on demand for rural credit ...............................................13
Table 3.2: Indicators reflecting living standard in rural area ..................................17
Table 4.1: Sources of rural credit ............................................................................21
Table 4.2: Monthly consumption for education per capita .....................................22
Table 4.3: Monthly consumption for health care per capita ...................................23
Table 4.4: Percentage of households by main source of drinking water ................25
Table 5.1: Descriptive statistics of all variables .....................................................26
Table 5.2: Participation in the rural credit program of the poor .............................28
Table 5.3: Impact of rural credit on living standard of rural households using
Independent Sample T-Test Method ...................................................29
Table 5.4: Correlation Matrix of the continuous independent variables in
PROBIT model ....................................................................................31
Table 5.5: Determinants of participating in rural credit program ...........................32
Table 5.5a: Models of determinants of participating in rural credit program .........33
Table 5.6: Impact of rural credit using NN technique ............................................39
Table 5.7: Impact of rural credit using Stratification technique .............................40
Table 5.8: Impact of rural credit using Kernel Matching technique .......................41
Table 5.9: Summary of Impact of rural credit using PSM techniques....................42
iv
CHAPTER 1
INTRODUCTION
1.1. Problem statement
Vietnam has remarkable achievements in poverty reduction, specifically a
report by World Bank and Vietnam General Statistics Office (GSO) in 2013 stated
the poverty rate in Vietnam has decreased from 60 percent in 1990s to 14.2 percent
in 2010 (using official poverty lines of Vietnam Ministry of Labour Invalids and
Social Affairs (MOLISA) at VND500,000/person/month for the urban area and
VND400,000/person/month for the rural areas), and nearly 30 million people have
escaped poverty. However, a lot of people in rural Vietnam are still living in
poverty with very low living standard, specifically, World Bank and GSO in 2013
reported that the poor, especially those living in rural area, have less opportunities
to access to education (as the Vietnam Population and Housing census by GSO in
2009, the illiteracy rate in rural area is 8 percent, which is 5 percent higher than that
in urban area), have limited access to formal health care (a report by GSO in 2010
showed that 7.07 percent of people in rural area cannot access to health treatment,
and the rate of the poor is higher than that of the non-poor), and have less
opportunities to have a good job. Therefore, improving living standard of the poor
in rural area is considered as a top concern of the Vietnam Government. With the
objective of improving living standard of the rural poor, the Government has
applied many programs such as free health care, food assistance, house assistance,
education assistance, credit programs, etc. Among these programs, rural credit
program is considered one of the most effective programs to improve living
standard of the poor (World Bank, 2012). The Government has applied a great
number of the credit programs that provide loans to support the rural households.
Rural credit program has been applied in many countries and researched by
many authors. Waheed (2009) stated that credit may increase the living standard of
the borrowers via improving their incomes, and then better education as well as
health care. To confirm the role of rural credit, Pitt and Khandker (1996) found that
1
credit program has a positive significant impact on such factors as education, selfesteem, organizational and management skills, etc. Pitt et al. (2003) also concluded
that participation in credit program has effect on the health status of children. In
addition, Coleman (2006) found that rural loan has positive effect on households’
living standards including clean water accessibility. As a report by CARE program
(2009), with a microfinance loan, the poor can run their own business and do
production, then they can generate income to pay for education of their children,
pay for health treatment as well as access more to clean water.
The main objective of this research is to investigate whether rural credit
programs have positive impact on the living standard of the households living in the
rural areas in Vietnam via increasing their accessibility to education, health
treatment and clean water.
Morduch and Haley (2002) found that when the poor are provided with credit,
they can improve their living standard or at least smooth their expenditure.
However, due to the budget constraint, the people in the rural areas, especially the
poor, have difficulty in accessing to formal and semi-formal credit sources.
Therefore, the government as well as financial institutions also makes efforts to
support the poor to access to formal and semi-formal credit sources via providing
programs that target the households in need of borrowing, especially the poor. In
order to target the poor effectively, many researches on the demand for credit of the
rural poor have been conducted. The credit providers need the information on
characteristics of the households who are more likely to participate in credit
programs. This research also investigates the determinants of participation in rural
credit programs of rural households in Vietnam.
The research aims at evaluating the impact of rural credit program on
accessibility to education, health care and clean water of rural household, especially
the poor, as well as investigating the factors that affect the participation in credit
program of the rural households. In order to achieve these objectives, the research
2
applies: (1) PSM method with cross-section data in order to investigate this impact;
(2) PROBIT model to investigate the determinants of accessing to credit program.
The research uses secondary data, namely the Vietnam household living
standard survey in 2010 (VHLSS2010). This data set is collected by GSO.
1.2. Objectives of the research
-
Identify the determinants on rural credit participation of rural household.
-
Evaluate the impact of rural credit on living standard of the rural households
via increasing accessibility to education, health care and clean water.
1.3. Research questions
-
Which factors affect the participation in credit program of rural household?
-
Do credit programs have a significant positive impact on living standard of
the rural households?
1.4. Research structures
Chapter I introduces the importance of rural credit program, methodology,
objectives, and questions of the research.
Chapter II presents literature review and empirical studies about impact
evaluation methods, the impacts of rural credit programs on living standard of the
rural households, and determinants of participation in rural credit programs.
Chapter III presents analytical framework of the research as well as the model
and estimation strategies applied in the research.
Chapter IV briefs the overviews of rural credit market in Vietnam and the
current situation of living standard indicators such as education, health care and
clean water.
Chapter V presents the results of the research using the model and estimation
strategies.
Chapter VI presents conclusions of findings and suggests policies.
3
CHAPTER 2
LITERATURE REVIEW
2.1. Theory of impact evaluation methods
Baker (2000) defined that “Impact evaluation is an assessment of how the
intervention being evaluated affects outcomes, whether these effects are intended or
unintended. The proper analysis of impact requires a counterfactual of what those
outcomes would have been in the absence of the intervention”. Impact evaluation is
conducted to compare the impact of a program intervention on the outcome of the
participants in the program with that of the non-participants. The results from
impact evaluation will help the policy makers check whether a program is effective
or not, and implement solutions to improve the efficiency of the program.
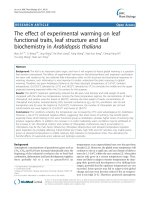
Figure 2.1: Evaluation using a with and without comparison
Source: Khandker et al. (2010)
4
The objective of impact evaluation is to evaluate the difference in outcome of
households with program participation and without program participation. In fact,
we cannot find households that both participate and do not participate in a program.
At this time, we need to find out a counterfactual (non-participants, or control units)
that have similar characteristics with the participants (treatment units). After that,
we calculate the difference in outcome between treatment group and control groups
to achieve the program’s impact (illustrated by Figure 2.1).
The following function presents the difference in outcomes between treatment
group and control group:
D = E(Yi(1)|Ti=1) – E(Yi(0)|Ti=0)
Where:
T = 1 : Participating households (treatment group)
T = 0 : Non-participating households (control group)
Yi(1)|Ti=1): the value of Yi under treatment (Participants)
Yi(0)|Ti=0): the value of Yi under control (Non-participants)
However, the treated and non-treated groups may not be the same prior to the
intervention. Therefore, the following function is applied:
D = E(Yi(1)Ti=1) – E(Yi(0)|Ti=0) + [E(Yi(0)|Ti=1) – E(Yi(0)|Ti=1)].
Where:
T = 1 : Participating households
T = 0 : Non-participating households
Yi(1)|Ti=1: the value of Yi under treatment (Participants)
Yi(0)|Ti=0: the value of Yi under control (Non-participants)
E(Yi(0)|Ti=1): the expected outcome for nonparticipants if they
participated in the program
Impact evaluation methods will support to find out the counterfactual. There
are many impact evaluation methods such as Propensity Score Matching (PSM),
Difference in Difference (DID), Application of instrumental variables (IV), etc.
5
-
In DID method, we can capture the difference in outcome between treatment
and control group over time (post- and pre- program). However, the
application of DID is costly because it requires the panel data (information of
post- and pre- program).
-
In IV method, selection bias on unobserved characteristics is adjusted by
finding a variable that has relationship with participation in the program but
does not have relationship with unobserved characteristics affecting the
outcome. However, it is very difficult for all researchers to find an
instrumental variable.
-
In PSM method, only cross-sectional data is required. PSM can reduce
selection bias and be considered as one of the best techniques to reduce the
selection bias.
From the above mentioned comparison, PSM is the most feasible to be
applied. Therefore, this research applies PSM method to evaluate the program
impact.
2.2. Empirical studies on impact of rural credit on living standard of the rural
households.
Living standard of rural households is reflected via such indicators as income,
consumption, health care accessibility, education accessibility, clean water
accessibility, etc.
There are many factors that affect living standard of the rural household.
Among these factors, credit plays an outstanding role.
Waheed (2009) stated that credit may increase the living standard of the
borrowers via improving their incomes, and then better education as well as health
care. To reaffirm that, Thorat (2006) stated that credit enables participating
households to spend more on education than non-participating households. Pitt and
Khandker (1996) concluded that credit program has a positive significant impact on
6
such factors as education, self-esteem, organizational and management skills, etc.
Pitt et al. (2003) also found out that participation in credit program has effect on the
health status of children. In addition, Coleman (2006) found that rural loan has
positive effect on households’ living standard including clean water accessibility.
In a report of CARE program (2009), it was found that microfinance loan can
help the poor to generate income via running their own business and doing
production, and then they can pay for education of their children, health treatment
as well as access more to clean water.
A report by the World Bank in 2004 stated that participation in rural credit
programs increases the income and expenditure. Khandker (2005) concluded that
credit plays a significant role in helping the poor to escape poverty. Chakrabarty
(2003), Antwi and Antwi (2010) also found that rural credit improve the income as
well as eradicate poverty of the poor in the rural regions. Nader (2008), Morduch
and Haley (2002) stated that credit is considered as a tool of fighting poverty.
Madajewicz (2003), Copestake et al. (2000) also found that with a rural credit, the
rural poor can run their own business or do self-production to generate income, so
they can have opportunity to escape poverty.
Morduch and Haley (2002) found that when the poor are provided with credit,
they can improve their living standard or at least smooth their expenditure.
For the case of Vietnam, Nguyen (2006) and Pham (2003) found that rural
credit has a positive impact on the living standard of borrowing households. Quach
(2005) also concluded that rural credit has positive impact on living standard of
households via improving their expenditure.
This research uses education accessibility (via the expenditure on education),
health care accessibility (via the number of health treatment at hospital), and clean
water accessibility (via the expenditure on drinking and running water) to reflect
living standard.
7
2.3. Empirical studies on determinants of the participation in rural credit
programs
2.3.1.
Characteristics at household head level
Age. Tang et al. (2010) and Zeller (1994) found that age of households head
have positive effect on the participating in rural credit program (i.e. the older the
heads of family are, the more likely that household participate in credit program).
Meanwhile, Mpuga (2008) proved that if the head of the family are too old, they
will be less likely to demand for credit. He explained that when the heads are too
old, they may do production or run small business less effectively, so it is difficult
for them to pay the debt.
Gender. As the study by Mpuga (2008), it is founded that men have more
probability of participating in the rural credit program. Tang et al. (2010) confirmed
that men are more likely to borrow from rural credit sources than women.
Education. Gropp et al. (1997) stated that household heads with higher
education level may be more likely to participate in credit program. As a research
for the case in Vietnam by Nguyen (2007), it is also found that education level has
positive affect on the demand for rural credit.
Marital status. In his research, Mpuga (2008) found that married household
heads have more demand for credit than unmarried ones.
Leadership status. Li (2010) stated household heads with leadership status has
more demand for credit. He explained that household heads with leadership status
have more tendencies to run business and expand production so they are usually in
need of borrowing from rural credit sources.
2.3.2.
Characteristics at household level
Household size. Ho (2004) and Tang et al. (2010) proved that household size
has positive effect on the probability of participating in credit program. In contrast,
Mpuga (2008) found that households with more members may be less likely to
participate in credit program because they have less probability of paying debt.
8
Dependency ratio. Pham and Izumida (2002) proved that households with
higher dependency ratio have greater probability of accessibility to credit program.
Wealth. Diagne (1999), Crook (2001), Duca and Rosenthal (1993) stated that
the households with more value of assets has a positive impact on the demand for
credit, amount applied for, and the amount of credit received. They explained that
these better-off households have tendency to expand production, so they often
demand for capital. To affirm this statement, the researches by Gropp et al. (1997),
Cox and Jappelli (1993) also found that households with more assets are more
likely to borrow.
Land. As the study by Tang et al. (2010), land is found to have positive
effects on the demand for credit. For the case of Vietnam, the researches by Nguyen
(2007), Pham and Izumida (2002) also concluded that households with more land
have more probability of participating in rural credit program because they need
capital to expand agricultural production.
2.3.3.
Characteristics at commune level
Geography factor. Sharma and Zeller (1999) and Mpuga (2008) found that
regional differences also affect the demand for credit.
Distance to bank or financial institution. Mpuga (2008), Tang et al. (2010), Li
(2010) found that distance to bank or financial institution has impact on the
probability of participating in credit programs (i.e. households living farther away
from bank have less likelihood of demand for credit). They explained that these
household must incur higher cost of borrowing because they have to pay some extra
cost such as travelling, time, communication, etc.
Facility of the commune. Khandker (1998) proved that the condition or living
standard of the commune has impact on the demand for credit of households living
in that commune. The condition and living standard are reflected via the facilities in
that commune including post office, road to the commune, that commune being
poor or not, etc.
9
Table 2.1 summarizes empirical studies about determinants of the
participation in rural credit programs. On the basis of those variables, this research
will investigate the factors that affect the accessibility to rural credit.
Table 2.1: Empirical studies about determinants of the participation in rural credit
programs
Authors
Variables
Results
Tang et al. (2010),
Age of household
Age positively affects the decision to
Zeller (1994)
heads
demand for credit
Mpuga (2008)
Age Squared of
Age Squared is proved to have
household heads
negative effect on demand for credit.
Mpuga (2008),
Gender of
Men access to credit sources more
Tang et al. (2010)
household heads
than women.
Gropp et al. (1997),
Education level of
Household heads with higher
Nguyen (2007),
household heads
education level may be more likely to
participate in credit program.
Mpuga (2008)
Marital status of
Married household heads have more
household heads
demand for credit than unmarried
ones.
Li (2010)
Leadership status
Household heads with leadership
of household head
status has more demand for credit.
Ho (2004),
Household size has positive effect on
Tang et al. (2010)
the probability of participating in
credit program.
Household Size
Mpuga (2008)
More people in household may result
in the less likelihood of accessing to
credit program.
10
Pham and Izumida
Dependency ratio
(2002)
Higher number of dependents leads
to the greater probability of
accessibility to credit program.
Diagne (1999),
Wealth (Total
The value of assets owned by the
Crook (2001), Duca
living area, value
household has a positive impact on
and Rosenthal
of the house, value
the demand for credit, amount
(1993), Gropp et al.
of assets)
applied for, and the amount of credit
(1997), Cox and
received.
Jappelli (1993)
Tang et al. (2010),
Total land area
Land is found to have positive effects
Nguyen (2007),
on the demand for credit.
Pham and Izumida
(2002)
Sharma and Zeller
Geography factor
(1999), Mpuga
There are regional differences in
demand for credit.
(2008)
Mpuga (2008),
Distance to bank or Households living farther away from
Tang et al. (2010),
financial institution bank have less likelihood of demand
for credit.
Li (2010)
Khandker (1998)
Facility of the
Condition of the commune is proved
commune (Post
to have impact on the demand for
office, Road, Poor
credit of households living in that
commune or not)
commune
11
CHAPTER 3
METHODOLOGY
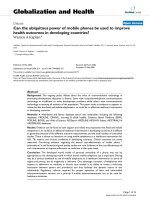
3.1. Analytical framework
Rural credit can improve living standard of the rural household via two
mechanisms (illustrated by Figure 3.1):
(1) The rural households can use the loan directly to pay for education, health
treatment, clean water, food, household items, etc. However, if households
use this expenditure plan, they cannot pay the debt (inhibit their repayment)
in the future and may go deeper into debt (Dearden et al., 2010).
(2)
The rural households may use the loan to do production or run small
business. Using this mechanism can not only increase the ability of paying
debt, but also help them increase their income, then they can have more
saving, and then they can have more expenditure for education, health
treatment, and clean water.
Figure 3.1: Analytical framework on how rural credit affects the accessibility to
education, health care and clean water
Rural
Credit
(2)
Income
(2)
Saving
(1)
Accessibility to
education,
(1)
health treatment,
clean water
Others
3.2. Models and estimation strategies
This research applies quantitative methods to achieve the research objectives
and give answers to research questions. The question 1 would be answered by using
PROBIT model. The question 2 will be answered by Propensity Score Matching
(PSM) method.
12
3.2.1.
Determinants of demand for rural credit
PROBIT model was first introduced by Bliss (1934) and then it was applied in
many studies by many researchers. Many authors also applied this model to
examine the determinants of accessing to credit program (Aghion and Morduch
(2005); Coleman (2006); Anjugam and Ramasamy (2007); Tang et al. (2010)). The
function of PROBIT model is as followed:
PROBIT (Y=1) = F (Hi, Fj, Cp)
Where:
Y : Participation in rural credit program (0 = Households who are not provided
with rural credit; 1 = Households who are provided with rural credit);
Hi : is a vector of household head characteristics;
Fj : is a vector of household (family) characteristics;
Cp : represents vector of characteristics of commune.
Based on the empirical studies, this research uses the following variables to
investigate the determinants of demand for credit in rural areas (Table 3.1):
Table 3.1: Determinants on demand for rural credit
Variables
Name
AGE
Age of household head
Continuous variable: in years
AGE2
Squared Age of
household head
Continuous variable: in years
GENDER
Gender of household head
EDU
Education level of
household head
MAR
Note
Dummy variable:
= 0 if female; = 1 if male
Continuous variable: reflected via
schooling years
Dummy variable:
= 0 if Single;
= 1 if Married, Divorced, Separated or
Widowed
Marital status of
household head
13
OSTATUS
Household with members
having an official status
(leadership status) in the
commune
HSIZE
DEPEND
Dummy variable:
= 0 if without member having official
status
= 1 if with member having official
status;
Continuous variable: number of
Household Size
members living in the household
Continuous variable: number of
nonworking members over working
Dependency ratio
member
HVALUE
LAND
POORHH
Value of the house that
household living in
Continuous variable: in thousand dong
Total land area owned or
Continuous variable: in m2
managed by household
Dummy variable:
= 0 if not poor household;
= 1 if poor household
Poor household or not
LOCATION
Geographic factor
DISTANCE
Distance to bank or
semiformal creditproviding organization
Dummy variable:
= 0 if not living in distant regions;
= 1 if living in distant regions
Continuous variable: in km
Dummy variable:
COMMUNE
135
Commune with/without
135 program
= 0 if not being commune 135;
= 1 if being commune 135
ROAD1
Commune with/without
road accessible to that
commune
14
Dummy variable:
= 0 if that commune not having road;
= 1 if that commune having road
Dummy variable:
POST
Commune with/without
post office
= 0 if that commune not having post
office;
= 1 if that commune having post office
On the basis of Table 3.1 and vectors of PROBIT function, characteristics of
household heads include such variables as age, gender, education level, marital
status, leadership status in the commune; charateristics of households include
household size, dependency ratio, value of the house, total land area used or
managed by households, family situation (poor or not poor), and characteristics at
commune level such as location distance to banks or financial institutions,
commune with/without 135 program, commune with/without road accessible to that
commune and commune with/without post office.
Estimation Strategy of PROBIT model includes three following steps:
Step 1: Estimate the PROBIT model
Step 2: Estimate the marginal effect
Step 3: Interpret the results.
3.2.2.
Impact evaluation by PSM
PSM method applied in the researches on evaluating the impact of a program
(rural credit) on the outcome (income/consumption) includes two main stages:
(1) Investigate the determinants on the participation in credit program of rural
households, and (2) Evaluate the impact of credit program on living standard.
The results from PROBIT and PSM will be carried out using STATA software.
This research applies PSM to investigate the impact of rural credit programs
on living standard of rural households. Based on the studies by Khandker et al.
(2010), Becker and Ichino (2002), PSM method can be divided into the following
steps:
15
Step 1: Construct a PROBIT model of determinants on participation in the
programs; then, based on the estimated regression model to calculate the probability
of participation in program. This probability is also called the propensity score.
Step 2: Specify the common support region of propensity scores for treatment
group (participating units) and control group (non-participating units). This step
will automatically take out some observations which have so high or so low
estimated propensity scores that they cannot be compared with any other
observations.
Step 3: Conduct the balancing tests.
Step 4: Match on participant with one or more than one non-participants that
have the closest propensity score by applying matching techniques such as:
Nearest-Neighbor (NN). In this technique, each treatment unit will be
compared with one control unit that has the most similar characteristics. The
comparison can be conducted using replacement or without replacement.
Comparison with replacement means that one control unit can be used to compare
with many other treatment units provided that they have the similar characteristics.
In this research the comparison with replacement is applied.
Stratification or Interval Matching. In this technique, common support region
will be divided into several intervals. The impact will be calculated in each interval.
In each interval, the impact is the average of difference between treatment and
control unit. The impact of the program is calculated using weighted average of the
impact in each interval (weighted is calculated based on the number of treatment
units in each interval).
Kernel and Local Linear Matching. This technique applies weighted average
of all control units in the common support region to create a match for each
treatment unit. The control unit with more similar characteristics in comparison to
treated unit will have higher weight, and vice versa. The estimator includes a linear
term in the weighted function in order to reap the better result.
16
Then, based on this propensity score to compare the outcome (e.g. the
following table 3.2 shows the outcomes used in this research) between each
participant and non-participants. The difference between each pair of comparison
represents “individual impact” of the program.
Table 3.2: Indicators reflecting living standard in rural area
Variables
educost
health
Name
Expenditure
on
Note
education Continuous variable
within 12 months
(thousand dong)
Number of health treatment Continuous variable
at hospital within 12 months
Expenditure on drinking and Continuous variable
waterexp
running
water
within
12 (thousand dong)
months
Dummy variable
watertap
Tap water accessibility
(1=Households with private tap;
0=Households without private tap)
Step 5: Calculate the average value of all individual impacts that reflects the
impact of program.
Step 6: Apply PSM with the Bootstrap to estimate standard errors in order to
have better estimated value.
17