Valuation of recreational service by the mangrove ecosystem in thanh phu natural reserve
Bạn đang xem bản rút gọn của tài liệu. Xem và tải ngay bản đầy đủ của tài liệu tại đây (1.63 MB, 87 trang )
UNIVERSITY OF ECONOMICS
HO CHI MINH CITY
VIETNAM
INSTITUTE OF SOCIAL STUDIES
THE HAGUE
THE NETHERLANDS
VIETNAM - NETHERLANDS
PROGRAMME FOR M.A IN DEVELOPMENT ECONOMICS
VALUATION OF RECREATIONAL SERVICE BY
THE MANGROVE ECOSYSTEM IN THANH PHU
NATURAL RESERVE
BY
NGUYEN THI DIEU THUY
MASTER OF ARTS IN DEVELOPMENT ECONOMICS
HO CHI MINH CITY, November 2015
1
UNIVERSITY OF ECONOMICS
HO CHI MINH CITY
VIETNAM
INSTITUTE OF SOCIAL STUDIES
THE HAGUE
THE NETHERLANDS
VIETNAM - NETHERLANDS
PROGRAMME FOR M.A IN DEVELOPMENT ECONOMICS
VALUATION OF RECREATIONAL SERVICE BY
THE MANGROVE ECOSYSTEM IN THANH PHU
NATURAL RESERVE
A thesis submitted in partial fulfilment of the requirements for the degree of
MASTER OF ARTS IN DEVELOPMENT ECONOMICS
By
NGUYEN THI DIEU THUY
Academic Supervisor:
PHAM KHANH NAM
HO CHI MINH CITY, November 2015
ABSTRACT
This study is part of a research project conducted to estimate environmental service
value of the mangroves in Thanh Phu ward, Ben Tre province, South Vietnam to
inform policy makers in applying the Payment for Forest Environmental Services
program. The study set out to measure recreational value of the forest through
ecotourism activities using Contingent Valuation Method with double bounded
dichotomous choice model. The result shows that willingness to pay is affected by
income and whether respondent thinks that environmental issues in Vietnam are
properly addressed. Mean WTP calculated using parametric and nonparametric method
is US $15.62 and US $12.61 respectively, which yields aggregate WTP at US
$2,656,204 with a lower bound of US $2,146,273.
Keywords: mangroves, ecosystem service valuation, Contingent Valuation Method,
double-bounded dichotomous choice model
Abbreviations: CVM – Contingent Valuation Method, WTP – Willingness to pay,
PFES – Payment for Forest Environmental Services
i
ACKNOWLEDGEMENT
My thanks goes to Dr Pham Khanh Nam for giving me the chance to participate in the
study which this thesis is part of, for his constant supervising and for his invaluable
advice in helping me finish this thesis
I am also grateful to Dr Truong Dang Thuy for initiating my interest in the method
used in this thesis and also for his advice
I thank my mother for her support to make it possible for me to write this thesis.
I thank everybody at VNP for creating an academic environment where I learn skills
and knowledge to write my thesis. Specially, I would like to thank my classmate
Nguyen Duy Chinh for giving me a lot of help and support when I work on the thesis.
ii
TABLE OF CONTENTS
ABSTRACT ......................................................................................................................... i
ACKNOWLEDGEMENT................................................................................................... ii
TABLE OF CONTENTS ................................................................................................... iii
LIST OF FIGURES ............................................................................................................ vi
LIST OF TABLES ............................................................................................................. vi
CHAPTER 1. INTRODUCTION .................................................................................... 1
1. PROBLEM STATEMENT .................................................................................... 1
2. RESEARCH OBJECTIVES .................................................................................. 2
3. RESEARCH QUESTIONS .................................................................................... 2
4. SCOPE OF STUDY ............................................................................................... 3
5. THESIS STRUCTURE .......................................................................................... 3
6. CHAPTER SUMMARY ........................................................................................ 4
CHAPTER 2. LITERATURE REVIEW ........................................................................ 5
1. ECOSYSTEM SERVICES VALUES ................................................................... 5
2. MEASUREMENT OF WELFARE CHANGES ................................................... 6
3. REVIEW OF EMPIRICAL STUDIES ................................................................ 10
a. Overall valuations of mangrove ecosystem services ........................................ 11
b. Valuations of recreational service for estuarine and marine ecosystems ........ 12
c.
Valuations of recreational services as environmental goods using CVM ........ 13
d. Estimates of recreational services of mangroves in Vietnam and in other
countries .................................................................................................................. 14
4. CHAPTER SUMMARY ...................................................................................... 15
iii
CHAPTER 3. METHODOLOGY ................................................................................. 16
1. CONTINGENT VALUATION METHOD ......................................................... 16
a. Steps in implementing CVM.............................................................................. 16
b. Elicitation format for the WTP amount ............................................................ 17
2. SCENARIO AND PAYMENT VEHICLE.......................................................... 19
3. MODEL OF WILLINGNESS TO PAY .............................................................. 21
4. ESTIMATION OF WILLINGNESS TO PAY .................................................... 22
a. Parametric estimation ...................................................................................... 22
b. Nonparametric estimation ................................................................................ 24
5. DATA ................................................................................................................... 27
6. CHAPTER SUMMARY ...................................................................................... 28
CHAPTER 4. ANALYSIS RESULTS ........................................................................... 29
1. OVERVIEW OF THANH PHU AND THE NATURAL RESERVE ................. 29
a. Thanh Phu district and tourism development ................................................... 29
b. Thanh Phu Natural Reserve.............................................................................. 31
2. PRELIMINARY STATISTICS ........................................................................... 35
a. Descriptive statistics ......................................................................................... 35
b. Correlation of coefficients ................................................................................ 40
c.
Willingness to pay by bid levels ........................................................................ 43
3. NON-PARAMETRIC ESTIMATION ................................................................ 45
4. DETERMINANTS OF WILLINGNESS TO PAY ............................................. 45
5. PARAMETRIC ESTIMATION........................................................................... 47
6. AGGREGATE WILLINGNESS TO PAY .......................................................... 47
7. CHAPTER SUMMARY ...................................................................................... 48
iv
CHAPTER 5. CONCLUSIONS AND SUGGESTIONS.............................................. 49
1. CONCLUSIONS .................................................................................................. 49
2. POLICY IMPLICATIONS .................................................................................. 50
3. METHODOLOGICAL REMARKS .................................................................... 51
4. SUGGESTIONS FOR FURTHER RESEARCH ................................................ 52
5. CHAPTER SUMMARY ...................................................................................... 53
BIBLIOGRAPHY ........................................................................................................... 54
APPENDICES ................................................................................................................. 62
v
LIST OF FIGURES
Figure 1. Schematic representation of the ecosystem services ........................................ 6
Figure 2. Extract of bid questions from questionnaire ................................................... 20
Figure 3. Administrative map of Ben Tre ...................................................................... 29
Figure 4. Map of Thanh Phu Natural Reserve’s current situation ................................. 32
Figure 5. Shares of occupational groups in the sample .................................................. 37
Figure 6. Respondents’ knowledge about the situation of mangrove area in Vietnam . 39
Figure 7. Graph of survivor function after the tenth iteration ........................................ 45
Figure 8. Bootstrapping result for value of non-parametric WTP ................................. 73
LIST OF TABLES
Table 1. Bid groups ........................................................................................................ 20
Table 2. Classification of flora species in Thanh Phu Natural Reserve: ........................ 33
Table 3. Some rare and threatened species in Thanh Phu Natural Reserve ................... 34
Table 4. Description and summary of respondents’ socio-economic characteristics .... 36
Table 5. Ranking of importance of social issues in Vietnam ......................................... 38
Table 6. Ranking of importance of ecotourism benefits to respondents ........................ 39
Table 7. Correlation of coefficients................................................................................ 41
Table 8. Percent of ‘yes’ responses for different bid levels ........................................... 44
Table 9. Regression result of the bivariate probit function ............................................ 46
Table 10. Estimate of mean WTP and confidence interval ............................................ 47
Table 11. The first iteration of calculating TSCA .......................................................... 71
Table 12. The second iteration of calculating TSCA ..................................................... 72
vi
CHAPTER 1. INTRODUCTION
1. PROBLEM STATEMENT
Vietnam is one among the countries most vulnerable to climate change and the
mangroves are one effective protection against sea level rise. Mangroves also provide
many other services including support for fishery and aquaculture, provision of food
and raw material, carbon sequestration, water supply and regulation and recreational
activities. However, the mangroves are reported to have declined rapidly due to
deforestation, from 408,500 hectares in 1943 to 155,290 hectares in 2000 of which only
about 21% is of high-quality natural forest (Sam, D.D., N.N Binh, N.N. Que, and V. T
Phuong, 2005)
Funding is necessary to protect the mangroves, yet it is often lacking. Drawing on the
concept of payments for environmental services, a solution to generate and distribute
cash for conserving ecosystems, the government has developed the national program of
Payment for Forest Environmental Services (PFES) (Hawkin, 2010). Specifically, the
Prime Minister has issued decree 99/2010 to guide the application of PFES to five
groups of services provided by forests: soil related, water supply related, carbon
sequestration, recreation based on natural landscape and finally, aquaculture-related.
In order to decide the levels of payment and also to make informed decisions of socioeconomics planning, it is important that policy makers know of the value of the
services provided by mangrove forest. This study is part of an assignment that arises
from that need, seeking to gauge the economic value of the mangrove ecosystem in
Ben Tre province.
Every day hundreds of tourists go to the beaches in the coastal district of Thanh Phu,
Ben Tre (Quoc Vinh, 2015). Among the attractions are the clean beaches, cheap
1
seafood and learning to do the work on shrimp farms (Le Luong, 2015). These are
supported by the presence of the mangroves besides its own green lush, which can
interest tourists to pay to spend time in, learn from and support. That way, Thanh Phu
could follow Can Gio and capitalize on the current crowds of tourists to develop ecotourism centering on the mangroves.
Also, the mangrove ecosystem in Thanh Phu is officially recognized as a natural
reserve and put under care of the authority. The combination of mangrove forest
presence, stewardship and available crowd of tourists makes Thanh Phu Natural
Reserve an ideal place for carrying out evaluation of the recreational service using
Contingent Valuation Method
2. RESEARCH OBJECTIVES
Firstly, the study will estimate the monetary value that tourists coming to Thanh Phu
are willing to pay for the tourism service of the mangroves in Thanh Phu Natural
Reserve, Ben Tre.
Secondly, the author will attempt to identify factors affecting this willingness to pay.
3. RESEARCH QUESTIONS
The study seeks to answer the following questions:
-
How much the tourists coming to Thanh Phu are willing to pay for the tourism
value of the mangroves in Thanh Phu Natural Reserve?
-
What are the determinants of this willingness to pay?
2
4. SCOPE OF STUDY
The study is conducted for the mangroves in and tourist population coming to Thanh
Phu District, Ben Tre Province, South Vietnam. The sample population comprises of
individuals among beach goers in Thanh Hai commune.
The services provided by the mangroves to human are many and can be categorized
under the main four groups of provisioning, regulating, supporting and cultural. The
study only set out to measure the category of tourism service, which belong to the
cultural group.
Willingness to pay is calculated for 2014 and used for the next several years as report
shows that the number of tourists coming to Thanh Phu keeps increasing with
improvements in infrastructure and unfolding services (Quoc Vinh, 2015)
5. THESIS STRUCTURE
The thesis remains in four chapters. Chapter 2 reviews literature about how tourism fits
in the framework of ecosystem services values, how economists measure welfare
brought about by environmental goods and previous related studies. Chapter 3
discusses the methodology employed in the study: the steps of contingent valuation and
elicitation format, hypothetical scenario and payment methods, construction of
willingness to pay function, nonparametric and parametric methods for estimation of
willingness to pay and finally, elements of data collection. Chapter 4 discusses the
findings of the study from knowledge about the situation of mangroves as tourist
attraction to the statistics of data to results of nonparametric and parametric estimation.
Chapter 5 presents the conclusions of the study, comments about the methodology used
in the study, suggestions to policy makers and possible directions for future study.
3
6. CHAPTER SUMMARY
The chapter first discuss the benefits of and threats to mangrove ecosystems and
counteraction by the government, which eventually leads to the study. Reason for
choosing the site were also discussed. After that, the research objectives and research
questions are outlined. Next the scope of the study is specified. Finally, part 5 lays out
the structure of the thesis.
4
CHAPTER 2. LITERATURE REVIEW
1. ECOSYSTEM SERVICES VALUES
Ecosystems are “dynamic complexes of communities of animals, plants and
microorganisms and the inorganic environment interacting as a functional unit, with
human being an integral part” (UNEP, n.d.)
Among the Millennium Ecosystem Assessment categories, the mangroves belong to
the Coastal Ecosystems group, being within an “area between 50 meters below mean
sea level and 50 meters above the high tide level or extending landward to a distance
100 kilometers from shore” (UNEP, n.d.)
According to the UK NEA (n.d.), ecosystem services are “the benefits provided by
ecosystems that contribute to making human life both possible and worth living”.
Examples includes benefits such as provision of material and food, regulation of water,
shoreline protection and carbon sequestration, and non-material ones such as cultural
heritage and aesthetic experience. The term ‘services’ is often meant to include both
the tangible and intangible benefits that humans obtain from ecosystems.
These service are categorized into four groups: provisioning services, regulating
services, cultural services and supporting services. Tourism and recreation, which in
this case are the same, are cultural services (UK NEA, n.d.)
This study is interested in measuring value of one form of tourism, ecotourism. This is
the service that the local government intends to extract from the mangroves and can be
defined as "responsible travel to natural areas that conserves the environment, sustains
the well-being of the local people and involves interpretation and education" (TIES,
2015)
5
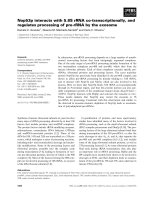
Figure 1. Schematic representation of the ecosystem services
Source: />2. MEASUREMENT OF WELFARE CHANGES
This study uses contingent valuation method to estimate the economic value of an
ecosystem service. According to Bockstael and Freeman (2005), CVM has theoretical
foundation in the neo-classical welfare economics. It presumes that economic activity
is to promote the welfare of the individuals, and each individual is the best judge of
their own well-being. Therefore, economic values of goods and services, whether
market or nonmarket, should be based on their effect on human welfare.
The theory has been developed to measure change in individual’s wellbeing to estimate
the welfare effect of change of goods and services, be it a change of price or quantity.
6
In doing so, the assumptions are made that individuals have well-defined preferences
among alternative bundles of goods and their preferences have the attribute of
substitutability, that is, people can make trade-offs between bundles of goods and
services to keep their utility unchanged.
With money as the common unit of exchange, that substitutability means the
compensating increase and decrease in goods and services while making trade-offs can
be stated as changes to exogenous income.
In order to illustrate the evaluation of change in levels of environmental goods,
consider a simple case of abstraction. Let D be a vector of human-induced impacts on
the environment, Q be the vector of environmental outcomes that affect humans. Q
may directly enter individual’s utility function or indirectly through function Z(Q) of
household or firm production process. The artificial distinction between D and Q
serves to distinguish between the relationships described physically or biologically and
those that are fundamentally economic in nature.
Let W be the level of economic welfare, the model of the case can be expressed as:
𝑄 = 𝑄 (𝐷 )
(1)
𝑍 = 𝑍(𝑄)
(2)
𝑊 = 𝑊(𝑄, 𝑍(𝑄)) (3)
The benefits or costs of a regulation is estimated by first predicting the vector D of
impacts on the environment, then tracing through (1) to (3) to calculate the resulting
welfare change.
Going into details of (3), to define a measure of the welfare change bought about by an
environmental change, we first consider the standard case where individual’s utility is a
7
function of only private purchased goods with no uncertainty. The individual is subject
to income constraint and seek to maximize utility:
𝑀𝑎𝑥𝑈 − 𝑈(𝑋 ) 𝑠. 𝑡. 𝑃′ 𝑋 = 𝑀
(4)
where X is a vector of n goods and services and P is a corresponding price vector. The
solution to (4) is a set of n ordinary or Marshallian demand functions:
𝑥𝑖 = 𝑥𝑖 (𝑃, 𝑀), 𝑖 = 1, … , 𝑛
(5)
Plugging (5) into (4) results in the indirect utility function where utility is a function of
income and price:
𝑈 = 𝑉(𝑀, 𝑃)
(6)
We then introduce environmental quality Q to the problem. There arise three cases. Q
may enter the utility function directly or through the production function Z for a
household produced good. Or Q can enter firm’s production processes, altering the
price of goods and/or individuals’ incomes.
The measures of welfare change being considered here are based on compensation
principle. Utility change per se is known to be neither measurable nor additive for each
individual and so cannot have unique money measures. However, welfare measures
can be defined by the monetary amount needed to compensate for the change in
question, holding utility constant at the level of the status quo.
To measure the welfare effects, economists use the concepts of compensating and
equivalent variation. Compensating variation (CV) is the amount of money needed to
be taken away to income to leave individuals with the same base utility after a change
in price, quality or quantity of goods. Equivalent variation (EV) is the money needed to
8
add to income to give individual the same utility as after the change without making
the change.
𝑉 (𝑃1 , 𝑄1 , 𝑀1 − 𝐶𝑉 ) = 𝑉(𝑃0 , 𝑄0 , 𝑀0 )
(7)
𝑉 (𝑃1 , 𝑄1 , 𝑀1 ) = 𝑉(𝑃0 , 𝑄0 , 𝑀0 + 𝐸𝑉)
(8)
Defined as in (7) and (8), CV and EV have the same sign with the welfare effect.
In developing mechanism for measuring CV and EV in case of change in P or Q, we
seek to express these measures in terms of the expenditure minimization function,
which is the dual of (4). In the case as in this study, Q enter the utility function directly:
𝑚𝑖𝑛 𝑃′ 𝑋 𝑠. 𝑡. 𝑈(𝑋, 𝑄) = 𝑈0
(9)
Substituting the cost minimizing demands for X into the objective function yields the
expenditure function:
𝑒 = 𝑒(𝑃, 𝑄, 𝑈0 )
(10)
where e is the minimum amount of money needed to achieve utility 𝑈0 given price P
and environmental quality and/or quantity Q.
CV and EV for a change in price P and quantity Q can be defined explicitly as:
𝐶𝑉 = 𝑒(𝑃0 , 𝑄0 , 𝑈0 ) − 𝑒(𝑃1 , 𝑄1 , 𝑈0 )
(14)
𝐸𝑉 = 𝑒(𝑃0 , 𝑄0 , 𝑈1 ) − 𝑒(𝑃1 , 𝑄1 , 𝑈1 )
(15)
where 𝑈1 = 𝑉(𝑃1 , 𝑄1 , 𝑀)
(16)
9
In the case of an improvement in welfare as in this study, EV is the WTP for the
hypothetical increase in the environmental service. From (15) and (16), we can derive
WTP as a function of P, Q, and M.
Random utility model
The model for utility used in this study is the random utility model (RUM) suggested
by Hanemann (1984) where uncertainty and individual’s characteristics are taken into
consideration. Applying RUM in the case of improved mangrove ecosystem service,
the utility of stakeholder i for an improved ecosystem service is:
𝑉𝑖𝑗 = 𝑉𝑗 (𝑀𝑖 , 𝑧𝑖 , 𝜀𝑖𝑗 )
Where:
j=1 denotes the improved state and j=0 is the status quo
𝑉𝑗 (𝑀𝑖 , 𝑧𝑖 , 𝜀𝑖𝑗 ) is a function of 𝑀𝑖 , 𝑧𝑖 , 𝜀𝑖𝑗 with 𝑀𝑖 being stakeholder’s discretionary
income, 𝑧𝑖 vector of stakeholder characteristics and attributes of the resource and 𝜀𝑖𝑗
being unobserved preferences (the uncertainty to researchers). Analogously to the
defining of WTP in the previous math abstraction, the real WTP is also assumed to be a
function of 𝑀𝑖 , 𝑧𝑖 , 𝜀𝑖𝑗 .
The CV bidding question will force the respondent to choose between improved
ecosystem service at bid amount t and the status quo. The data will be analyzed to
derive parameters for the WTP function.
3. REVIEW OF EMPIRICAL STUDIES
Strictly similar studies using CVM to study recreational value of mangroves were
hardly available. Related studies is found in four strands: overall valuations of
10
mangrove ecosystem services, valuations of recreational value for estuarine and marine
ecosystem, applications of CVM in valuation of recreational services and finally,
estimates of recreational services of mangroves in Vietnam and in other countries.
a. Overall valuations of mangrove ecosystem services
Overall valuations of mangrove ecosystem services use a diverse collection of
methods. These include, but not limit to, obtaining information of economic benefits
rather than economic value (provision and cultural services) (Uddin, de Ruyter van
Steveninck, Stuip and Shah, 2013); marketed substitutes/alternative supplies
(firewood), valuing the marginal productivity of the resource net any human effort
(fisheries), preventive expenditures or damage costs avoided (shoreline stabilization,
erosion control, and control of storm surges), CVM (existence, bequest, and option
values) (Gunawardena and Rowan, 2005); combination of earth-observation- and
household-survey-based analyses (Kuenzer and Tuan, 2013; Quoc Vo, Kuenzer and
Oppelt, 2015) and value transfer (Malik, Fensholt and Mertz, 2015)
Services valued also vary among studies. Timber provision are estimated by all studies
reviewed (Gunawardena and Rowan, 2005; Udin et al., 2013; Kuenzer and Tuan, 2013;
Quoc Vo et al., 2015, Malik et al., 2015), while more complicated services are included
and estimated differently by different studies. Gunawardena and Rowan (2005) and
Kuenzer and Tuan (2013) value fishery both inside the forest and nearby coast with
fishes living part of their lives in the forest. On the other hand, Uddin et al. (2013),
Quoc Vo et al. (2015) and Malik et al. (2015) value fishery inside mangroves only. The
estimations often include coastal protection and recently carbon sequestration while
leaving out recreation and biodiversity benefits (Gunawardena and Rowan, 2005;
Kuenzer and Tuan, 2013; Quoc Vo et al., 2015, Malik et al., 2015). Indeed,
Gunawardena and Rowan (2005) acknowledge the need for insights into the interaction
11
between ecological and socio-economic links in order to obtain a fairly accurate value
of the mangroves.
Besides studies valuing individual mangrove sites, there are meta-analysis studies
conducted to find way to apply value transfer on mangrove ecosystems (Brander et al.,
2012; Salem and Mercer, 2012). One of these is the paper by Brander et al. (2012) for
mangrove ecosystems values in Southeast Asia. The authors study 130 value estimates,
mostly for mangrove in Southeast Asia. The services valued are material extraction
(fuel wood, food or thatch), water quality maintenance or improvement, support to
commercial fisheries and shoreline protection. Other services such as recreational
opportunities, biodiversity benefits and carbon sequestration were not included due to
scarcity of studies estimating them. The mean and median values found are 4185 and
239 US$/ha/year. These values vary greatly due to factors including the site biophysical characteristics and the socio-economic characteristics of the stakeholders.
Finally, one factor positively influencing the value of a mangrove forest is adjacency to
other mangrove forests.
b. Valuations of recreational service for estuarine and marine ecosystems
Brander, Van Beukering and Cesar (2007) use meta-analysis to study the recreational
value of coral reefs. 166 studies were collected and 52 were statistically adequate for
meta-analysis yielding 100 value observations. The results show that larger dive sites
and smaller number of visitors make sites more attractive to recreationists. Different
methods gives very different estimated values with contingent valuation produce
significantly lower results. Also, quality of a large part studies are low which may
account for the variation in value estimations. When applying value-transfer, the
average transfer error is 186% which is not sufficiently reliable for the method to be
used.
12
c. Valuations of recreational services as environmental goods using CVM
Numerous published studies can be found following this strand. These papers can
employ CVM alone (Shultz, Pinazzo and Cifuentes, 1998; Huhtala, 2004; Jim and
Chen, 2006; Lee, Lee, Mjelde, Scott and Kim, 2009; Dong, Zhang, Zhi, Zhong and Li,
2011; Yamazaki, Rust, Jennings, Lyle and Frijlink, 2013), CVM in combination with
expenditure data (Bergstrom, Stoll, Titre and Wright, 1990) or CVM separately and in
comparison with travel cost method (Navrud and Mungatana, 1994). Researches are
carried out in both developing countries (Navrud and Mungatana, 1994; Shultz et al.,
1998; Jim and Chen, 2006, Dong et al, 2011) and developed countries (Bergstrom et
al., 1990; Huhtala, 2004; Lee et al, 2004; Yamazaki et al., 2013) with factors
significantly affecting willingness to pay reflecting the idiosyncrasies of the cases. For
example, while estimating the demand for recreational service of wildlife viewing in
Lake Nakuru National Park of Kenya, Navrud and Mungatana (1994) find that
recreational demand of international visitors is price inelastic as expected of the
category of specialized, high quality viewing which this case fit into. However,
recreational demand of residents is elastic as this is considered a luxury for Kenyans.
Another example is the valuation of recreational services by parks. In Guangzhou,
China where people are accustomed to paying for access to greenspaces and seeing
outdoor recreation in greenspaces as important leisure pursuit, only income
significantly affect willingness to pay (Jim and Chen, 2006). However, in Finland
where access to parks is free and income is high implying ample supply of recreational
activities, 60% of the respondents indicated cultural and ecological conservation as the
motivation for willingness to pay while less than 20% state opportunity to use the parks
as their reason for payment and income is not statistically significant as an impact on
willingness to pay (Huhtala, 2004)
13
Issues of the CVM methods are discussed and sometimes addressed. Although CVM is
designed to capture both use and non-use value, Navrud and Mungatana (1994) found
estimation result of CVM lower than that of Travel Cost. Dong et al (2011) also
comment that their result using CVM is low compared to other studies. One early study
(Shultz et al. (1998) acknowledge the limitations of not including potential visitors;
lacking detailed scenarios and information framing; and cultural-strategic biases when
conducting surveys in a developing country. On the other hand, a recent study by
Yamazaki et al. (2013) has tested and controlled for response biases, namely anchoring
bias and structural shift.
d. Estimates of recreational services of mangroves in Vietnam and in other countries
A few studies estimating recreational services of mangroves in developing countries
has been published. Specifically, Bennett and Reynolds (1993) do research for the
mangroves in Sarawak, Malaysia; Ahmad (2009) for the mangroves in Larut Matang,
Malaysia; Uddin et al.(2013) for the Sundarban Reserve Forest, Bangladesh; and
Kuenzer and Tuan (2013) for the Can Gio Mangrove Biosphere Reserve, Vietnam.
Methods used include obtaining secondary information of income collected from
tourists (Uddin et al, 2013; Bennett and Reynolds, 1993), travel cost method (Kuenzer
and Tuan, 2013) and contingent valuation method (Ahmad, 2009).
For comparison, the economic value of recreational service per ha by the mangrove
forests in Sarawak, Larut Matang, Sundarbans and Can Gio are US$423.92 (for the
year 1989), US$23.8 (2007), US$0.07 (2001-2002 to 2009-2010) and US$2960US$4992 (2013) respectively. The first and fourth numbers, being high in totally
different levels compared to the other two numbers, is the income of already quite
developed tourism dependent on mangroves in Malaysia and Vietnam. The second
number is the WTP for hypothetical ecotourism services provided within another
14
mangrove forest also in Malaysia and the third, lowest estimation is for official revenue
collected only by the Forest Department of Sundarban Reserve Forest where real
market values do not exist. Adding to that the conclusion that values using CVM often
yield lower results as discussed in earlier section, it seems that the value estimated by
contingent valuation method is a conservative number that only inform about the
initiated interest of the population in the environmental service. Due to resource
constraints, other significant economic benefits are overlooked which will arise with
proper investment and development from government.
4. CHAPTER SUMMARY
The chapter begins by providing definitions of key concepts including ecosystems,
mangroves, environmental service and ecotourism. After that, the theoretical
foundation of welfare economics is presented which trace the connection from changes
to environmental goods to WTP measurement in random utility model. Going on,
empirical literature is reviewed along four strands: overall valuations of mangrove
ecosystem services, valuations of recreational value for estuarine and marine
ecosystem, applications of CVM in valuation of recreational services and finally,
estimates of recreational services of mangroves in Vietnam and in other countries.
15
CHAPTER 3. METHODOLOGY
1. CONTINGENT VALUATION METHOD
CVM is a survey based evaluation method where respondents are asked to state their
willingness to pay (WTP, or willingness to accept, WTA) for the conservation (or loss)
of some environmental services. The name “contingent” indicates that the respondents
are being presented with a hypothetical situation of the environmental goods being
evaluated. CVM belongs to the category of stated preference methods as it is based on
people telling what they would pay and not what is observed from what they actually
do.
CVM is a popular method of evaluation, having decades of application and
development. It is proposed by Ciriacy – Wantrup (1947) and first applied in an
empirical study by Davis (1963) to estimate value of a wilderness area to hunters and
tourists. In 1998, there was a notorious accident to the environment in the US, the
Exxon Valdez oil spill. CVM was then use to quantify the damages by asking WTP to
prevent a similar accident. The number is huge and sparked controversy. Later Arrow
et al (1993) was commissioned to investigate whether CVM is a valid method of
evaluation. They concluded that the method can produce reliable estimates with the
condition that surveys are carefully designed and implemented. The method then gain
breakthrough in popularity and at this time there is already a significant body of works
applying CVM.
a. Steps in implementing CVM
According to Hanley (1990), the general process in conducting a CVM study
comprises of the following steps:
Step 1: Define the survey’s objectives
16
-
Describe the site, the services being valued, the relevant population
-
Specify time span of evaluation
-
Establish value to be estimated and unit of measurement
Step 2: Make preliminary decisions for the survey
-
Decide on the sample size, mode of survey, who will be surveyed, who will pay
for the good, who will use the good and other related issues
Step 3: Design the questionnaire
-
Conduct interviews and focus groups to explore the situation and how to design
questionnaire, which generally comprises of: Introduction, socio-economic
questions, Scenario, WTP/WTA elicitation format, payment vehicles
-
Pretest the questionnaire and make necessary revisions
Step 4: Implement the actual survey
-
Decide the sampling technique, how, when and where to run the interviews.
-
Train enumerators
-
Run the interviews
Step 5: Analyze data and report results
-
Enter data: identify responses that may not express respondent’s value for the
site, deal with possible non-response bias
-
Analyze WTP/WTA with appropriate statistical techniques
-
Extrapolate the benefit or loss for the population
-
Compute annual net benefits and total value of the services
b. Elicitation format for the WTP amount
17