The willingness to pay for flood insurance in mekong river delta
Bạn đang xem bản rút gọn của tài liệu. Xem và tải ngay bản đầy đủ của tài liệu tại đây (2.28 MB, 122 trang )
UNIVERSITY OF ECONOMICS
HO CHI MINH CITY
VIETNAM
ERASMUS UNVERSITY ROTTERDAM
INSTITUTE OF SOCIAL STUDIES
THE NETHERLANDS
VIETNAM – THE NETHERLANDS
PROGRAMME FOR M.A IN DEVELOPMENT ECONOMICS
WILLINGNESS TO PAY FOR
FLOOD INSURANCE IN
THE MEKONG RIVER DELTA
BY
NGUYEN NGOC QUE ANH
MASTER OF ARTS IN DEVELOPMENT ECONOMICS
HO CHI MINH CITY, SEPTEMBER 2016
UNIVERSITY OF ECONOMICS
HO CHI MINH CITY
VIETNAM
INSTITUTE OF SOCIAL STUDIES
THE HAGUE
THE NETHERLANDS
VIETNAM - NETHERLANDS
PROGRAMME FOR M.A IN DEVELOPMENT ECONOMICS
WILLINGNESS TO PAY FOR
FLOOD INSURANCE IN
THE MEKONG RIVER DELTA
A thesis submitted in partial fulfilment of the requirements for the degree of
MASTER OF ARTS IN DEVELOPMENT ECONOMICS
By
NGUYEN NGOC QUE ANH
Academic Supervisor:
TRUONG DANG THUY
HO CHI MINH CITY, September 2016
DECLARATION
In order to fulfill the requirements for the degree of Master of Art in Development Economics
to Vietnam – The Netherlands Programme (VNP), this thesis entitled “Willingness to pay for
Flood Insurance in the Mekong River Delta” is submitted.
This declaration certify that this thesis constitutes on my original work only. All materials used
in this thesis have been acknowledged and cited properly following the Programme’s standards
NGUYEN NGOC QUE ANH
ACKNOWLEDGMENTS
Doing thesis is an amazing adventure but it is also a tough path, without support and
encouragement of my family, my teachers, my friends and Vietnam Netherland Program, I
might not complete it.
I would like to send my sincerest thanks and gratitude to my supervisor - Dr. Truong Dang
Thuy who always gives me invaluable advice and instructs me wholeheartedly. From the initial
ideas to finish, he is very patient, listens to my opinions and helps me to correct mistakes
delicately.
I am deeply grateful to Mr. Phung Thanh Binh. Many thanks for giving me the precious
opportunity to join in this research, inspiring me and allowing me to employ the data, so that I
can pursue this topic. Memories and experience from this research will be unforgettable.
I greatly appreciate the enthusiasm and kindness of lecturers and staffs of Vietnam Netherland
Program. I would like to thank my teachers, the founders and staffs of VNP for be willing to
help and give me invaluable knowledge.
Last but not least, I am very thankful that my family and my friends are always with me, love
me and support me wholeheartedly. From the bottom of my heart, I would send my sincerest
gratitude to my parents. Without their love, this thesis would be not accomplished.
NGUYEN NGOC QUE ANH
ABSTRACT
In the circumstance of climate change and series of dams built in Mekong River Basin, risk of
flood damages and productivity loss in Mekong River Delta tend to be ambiguous and
unpredictable. Choice experiment is applied to assess the stated preference and the willingness to
pay for flood insurance of local farmers. Based on the data obtained from survey in Mekong River
Delta, we consider the impacts of attributes on the utility of insurance buyer and the willingness
to pay of them. As a result, flood insurance attributes except deductible have impact on utility of
farmers and the willingness to pay for flood insurance of them. Especially, buying the flood
insurance provided by corporation will raise the utility and willingness to pay of local farmer.
Since the deductible have no impact on the utility of flood insurance buyers, local farmers are
willing to share the burden with providers. When the effects of challenges for flood insurance
development are controlled, only provider and policy types have strong positive impact on utility
of insurance.
Based on the estimate result, WTP for attributes and the WTP for specific insurance package are
calculated carefully, we also evaluate the probability of levels of WTP for flood insurance with
different levels of important attributes. The potential development of insurance companies are very
bright, especially corporation. The profitability will be large, if the provider provide insurance
packages with favorite policy. When premium of the most preferred flood insurance vary from
5,000 (VND/1000𝑚2 / Farming season) to 200,000 (VND/1000𝑚2 / Farming season), 90 percent to
79 percent of farmer willing to pay it.
JEL Classification: Q11, Q12, Q14
Keywords: Willingness to pay, Flood insurance, Mekong River Delta, Random Utility Model
i
TABLE OF CONTENT
ABSTRACT ................................................................................................................................. i
ABBREVIATIONS ................................................................................................................... vi
LIST OF FIGURES ................................................................................................................. vii
LIST OF TABLES .................................................................................................................... ix
CHAPTER 1
INTRODUCTION ...................................................................................................................... 1
1.1 Problem statement ............................................................................................................... 1
1.2 Research objectives ............................................................................................................. 6
1.3 Scope of the study ............................................................................................................... 6
1.4 Structure of this thesis ......................................................................................................... 7
CHAPTER 2
LITERATURE REVIEW.......................................................................................................... 8
2.1 Previous studies without using RUM.................................................................................. 8
2.1.1 Researches on agricultural insurance using secondary data or combine with primary
data ............................................................................................................................................... 8
2.1.2 Researches not applying RUM on agricultural insurance using primary data .............. 9
2.2 Random utility model (RUM) and applications ................................................................ 11
2.2.1 Random utility model (RUM) ..................................................................................... 11
2.2.2 Researches applying RUM on agricultural insurance ................................................. 13
2.2.3 Review of flood insurance demand research using RUM ........................................... 18
2.3 Challenges of disaster insurance market ........................................................................... 21
ii
2.3.1 The ambiguity ............................................................................................................. 21
2.3.2 Adverse selection ........................................................................................................ 23
2.3.3 Charity hazard ............................................................................................................. 25
CHAPTER 3
RESEARCH METHODOLOGY ........................................................................................... 28
3.1 Demand for flood insurance .............................................................................................. 28
3.2 The advantages of Choice Experiment compared to Contingent Value Method .............. 28
3.3 General model ................................................................................................................... 29
3.4 Estimation ......................................................................................................................... 30
3.4.1 Exogenous sample ....................................................................................................... 30
3.4.2 Estimation on Subset of Alternatives .......................................................................... 33
3.5 Description of variables .................................................................................................... 35
3.5.1 Description of all attributes and levels ........................................................................ 35
3.5.2 Description of variables used to capture challenges for flood insurance market
development ............................................................................................................................... 37
3.6 Empirical models .............................................................................................................. 42
3.6.1 Empirical model with only attribute variables ............................................................ 42
3.6.2 Empirical model with attribute variables and their interaction with non-attribute
variables ..................................................................................................................................... 43
3.7 Calculation of Willingness-to-Pay (WTP) for specific insurance packages, and probability
of buying specify insurance packages with the changes in premium ........................................ 44
3.7.1 Calculation of Willingness to Pay (WTP) for each attribute and for specific insurance
packages ..................................................................................................................................... 44
3.7.2 Probability of buying specify insurance packages with changes in premium levels .. 47
3.8 Data collection .................................................................................................................. 47
iii
CHAPTER 4
RESEARCH RESULTS .......................................................................................................... 50
4.1 Descriptive statistics......................................................................................................... 50
4.2 Bivariate analysis ............................................................................................................. 56
4.2.1 No selection without consideration ............................................................................ 56
4.2.2 Bivariate analysis about the effects of personal perspectives and externalities on flood
insurance purchasing decision................................................................................................... 57
4.3 Empirical results............................................................................................................... 59
4.3.1 Estimation results ....................................................................................................... 59
4.3.2 The willingness to pay (WTP) ................................................................................... 67
4.3.3 The probability of willingness to pay of most preferred insurance packages ............ 73
CHAPTER 5
CONCLUSION......................................................................................................................... 80
5.1 Conclusion remark ............................................................................................................ 80
5.2 Policy implications ............................................................................................................ 82
5.3 Limitations ........................................................................................................................ 82
REFERENCES ......................................................................................................................... 84
APPENDIX ............................................................................................................................... 92
APPENDIX A: Questions are used from the survey .............................................................. 92
APPENDIX B: Conceptual Framework.................................................................................. 94
Appendix C: The statistic results about impacts of challenges ............................................... 95
Appendix D: The variation of WTP for flood insurance probability, with difference levels of
cover ......................................................................................................................................... 100
iv
Appendix E: The variation of WTP for flood insurance probability, with difference levels of
deductible rate .......................................................................................................................... 101
Appendix F: the regression result of models controlling the impacts of challenges and
household characteristics ......................................................................................................... 102
Appendix G: The regression result in Stata of models ......................................................... 104
Appendix H: The regression result from applying Nested Logit Model in Stata ................. 108
v
ABBREVIATIONS
BDT
Bangladeshi Taka
CE
Choice Experiment
CLL
Conditional Log Likelihood Function
CVM
Contingent Value Method
GIS
Geographic Information System
IFRC
International Federation Red Cross
IPCC
The Intergovernmental Panel on Climate Change
LL
Log Likelihood Function
MRD
Mekong River Delta
MRC
Mekong River Commission
OLS
Ordinary Least Squares
RUM
Random Utility Model
VND
The Vietnamese Dong
USD
The United States Dollar
WTP
Willingness to Pay
vi
LIST OF FIGURES
Figure 1.1 Flood damages in the Mekong River Delta from 1990s to 2000s ................................. 2
Figure 1.2 Disbursement process of IFRC funding contribution for Floods in MRD .................... 3
Figure 3.1 One choice card are used in the survey ....................................................................... 48
Figure 4.1 Statistical result of percentage of policy types chosen ................................................ 51
Figure 4.2 Statistical result of percentage of providers chosen .................................................... 52
Figure 4.3 Statistical result of percentage of deductibles rates chosen ......................................... 53
Figure 4.4 Statistical result of percentage of cover level chosen .................................................. 54
Figure 4.5 Statistical result of percentage of premium levels chosen ........................................... 55
Figure 4.6 Statistic results of the most interested attribute of farmers ......................................... 56
Figure 4.7 Percentages of observations choosing to purchase flood insurance ............................ 57
Figure 4.8 Amount of observations divided according to respondents’ perception ..................... 57
Figure 4.9 Probability of WTP for flood insurance covering triple disaster damages... ............... 74
Figure 4.10 Probability of WTP after controlling impacts of challenges ..................................... 74
Figure 4.11 Probability of buying flood insurance covering flood & inundation damages .......... 75
Figure 4.12 Probability of WTP for flood insurance covering flood and windstorm damages .... 76
Figure 4.13 Probability of WTP for flood insurance packages provided by corporation ............. 77
Figure 4.14 Probability of WTP after controlling impacts of challenges ..................................... 78
Figure 4.15 Probability of WTP for flood insurance provided by foreign company .................... 79
Figure 4.16 Probability of WTP for flood insurance provided by private company .................... 79
vii
LIST OF TABLES
Table 2.1 Attributes in the insurance package in Nganje’s study .............................................. 15
Table 2.2 Attributes of flood insurance package and their levels in previous study ................. 19
Table 3.1 Attributes of flood insurance packages ...................................................................... 35
Table 3.2 Variables used to capture impacts of challenges for flood insurance development .. 39
Table 3.3 Interactions between perceptive about flood insurance challenges and attributes..... 40
Table 3.4 Insurance packages are used to calculate the WTP.................................................... 45
Table 4.1 Amount of observations choosing alternatives in each order of choice cards ........... 56
Table 4.2 Estimate result of models ........................................................................................... 60
Table 4.3 WTP (VND/1000 𝑚2 / Farming season) for each levels of attributes ........................ 67
Table 4.4 WTP (VND/1000 𝑚2 /Farming season) for specific insurance packages .................. 70
viii
CHAPTER 1
INTRODUCTION
1.1 Problem statement
Natural disasters have been causing many losses of human life and property including direct
damage and indirect damage. The frequency of disasters is increasing together with climate
change. In the announcement of IPCC in 2007, since 1900 climate change has caused the increases
in global temperatures (roughly 0.76 𝑜𝐶 ) and sea level (approximately 20 centimeters). Along
with climate change, the damages caused by natural disasters are increasing gradually over time
and tend to be more serious in regions that are prone to be affected by calamities (Pielke et al.,
2005).
Mekong River Delta, located in downstream the Mekong River Basin, have been experiencing
seasonal floods due to great flow rates in the wet season (more than 65,000 𝑚3 /s) and low terrain.
According to the Vietnam Academy for Water Resources, from 1991 to 2009, annual floods have
caused damaged areas to increase from 1.6 million to 2 million hectares (To & Tang, 2011).
Annually, before the flood season, the local residents have carefully preparation to reduce the
flood damage. According Vietnam Mekong River Delta Project for enhancing resistance to flood
for poor households in 2011 with the support of United Nation, local government and residents
reinforced houses, had careful examinations of flood protection infrastructures, practiced aid and
provided necessary medicine for prioritized targets based on prudent plans. Despite of these
careful preparations, the 2011 flood caused more than 1,000 billion VND in property damage,
27,000 hectares area of rice and vegetables are damaged in which 10,000 hectares damaged 100%,
nearly 12.000 ha of fruit area also flooded.
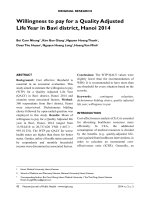
The statistical data of flood damage in the Mekong River Delta from 1990s to 2000s shows that
flood damages in downstream Mekong River Delta become abnormal.
1
Figure 1.1 Flood damages in the Mekong River Delta from 1990s to 2000s
Source: Collect from Nguyen, 2006; Dao & Bui, 2009; MRC, 2011; MRC, 2012
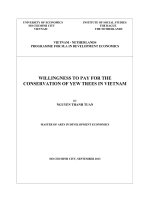
Recovery after floods in Mekong River Delta residents takes a long time. This is partly due to the
dependence on the aids from government and humanitarian organizations. In reality, the source
of aids is unstable, and people should not completely rely on them. In 2011, the severe flood
happened, local residents had to wait at least one year for entire of the aids from International
Federation Red Cross.
2
Figure 1.2 Disbursement process of IFRC funding contribution for Floods in MRD
Source: Report of International Federation Red Cross, 2013
In agricultural production, the post-flood relief cannot fully compensate for the costs of
agriculture, because farmers in the Mekong Delta invested heavily in their farms with an average
of 15 million dong per hectare. Thus, even if the government doubled the level of post-disaster
subsidy for local farmers to 5millions dong per hectare paddy after the severe flood in 2011, the
new subsidy level only offset against 30% of agricultural cost invested (Ngoc Anh, 2011).
Furthermore, the burdens of agricultural cost and default risk will increase more after floods or
other kinds of natural disaster, the farmers might have to face with threat of double liabilities. In
reality, because of financial constraints, many farmers have to purchase inputs on credit and pay
after harvesting at higher prices. In each season, many farmers and agents agreed to debit the
purchase agreement for four months, if these farmers cannot pay off the loan on the maturity, the
remaining debt will continue to be charged at the rate of 3-4% per month (Ngo, 2013).
Although farmers can access to bank loan, the threat of debt piling up is still there. While farmers
growing rice can only borrow from banks around 1 million VND per 1000𝑚2 , the average costs
for cultivation and harvesting of rice vary from 2.2 million VND to 2.5 million VND per 1000𝑚2 ,
and transferring value is about 40-50 million VND (Ngo, 2013). Therefore, occurrence of flood
might induce farmer to fall into debt piling up.
3
In 2000s, Mekong River Delta has contributed more than 48% of food production of Viet Nam
and 85% rice export volume (To & Tang, 2011). According to information of The Flood
Prevention Agency in HCMC about the prediction for 2030, approximately 45% area of Mekong
River Delta will be affected by salinity and damaged by severe floods and inundations, the
potential losses would be 17 billion USD (2008). In addition, a series of dams constructed and
operated in the Mekong River Basin has caused Vietnam to be passive in the flood discharge and
flood prevention, the consequences are unpredictable, downstream area of Mekong river basin
may be drought or flooded severely. For example, when a certain dam discharge due to
experiencing unusually heavy rains, it will create a domino effect for the whole system of 12 dams
and the damage is enormous. This hydropower system threats the future of the Mekong River
Delta and the whole country (Huynh & Phan, 2015).
In this circumstance, adaptation or “Living with floods” is the optimal solution to exploit the
benefits of flood and maintain the Vietnamese rice granary. Besides flood prevention
infrastructures, disaster insurance is a useful tools in adaptation strategy. For developing
countries, supporting development of catastrophe insurance is compared as a judicious
investment. It will facilitate damage reduction and repel disaster-induced poverty trap (Barnett et
al., 2008), as suitable designed insurance does not only have characteristics of useful instruments
in deployment of adaptation process but also contributes effectively in risks management and
recovery after adverse events (Botzen & Van den Bergh, 2008). Besides, flood insurance is also
able to remove financial burdens of government in recovery after natural disaster, this instrument
helps society to get back to routine faster. In the cases that natural disasters consequences are
severe, and households do not have resilience, insurance companies could spread the risk by
utilizing the premiums collected from other households to pay for devastation.
Market principles would promote private insurance companies to work more effectively in
implement risk-reduce processes than public ones (Priest, 1996). Devastation could be reduced
by rewarding for design climate-adaptable constructions or premium discount programs. Through
insurance policies, insurance companies could encourage households to participate in riskreduction activities. In the cases of seasonally flooded areas, in order to encourage residents to
use tile floors or flood-adapted building, insurance contracts might not pay for damages of wooden
floor, or they could introduce flood-adapted materials and buildings (Thieken et al., 2006). After
4
the 2002 flood, a survey conducted in Germany indicates that insurance buyers pay more attention
to flood mitigation than who does not (Thieken et al., 2006). As a result, recovery costs and
negative effects of natural disasters could be moderated.
However, flood insurance and other kinds of agricultural insurance are new products to
Vietnamese farmers. According to the Ministry of Finance, revenue from agricultural insurance
accounts for a very small proportion (0.015%) in total insurance revenue, and the implementation
of agricultural insurance has been in the pilot stage since 2011. The reason is that authorities have
yet to identify the objects, the risks to be insured, while the scope of target clients and geographical
deployment are quite wide; disaster and disease occur diversely, each locality has a different
situation; technical facilities, information technology systems of provinces and insurance
company are limited (Pham, 2015). In addition, many other obstacles such as ambiguity, adverse
selection, moral hazard, correlated risks make the penetration of private insurance market become
unappealing (Botzen & Van den Bergh, 2008). Therefore, conducting a research to capture the
demand for flood insurance and other kinds of agricultural insurance in disaster-prone areas is
necessary for flood insurance development projects and insurance companies.
The demand for flood insurance is not a new topic with developed countries, most of them used
the insurance statistics data to investigate the flood insurance demand (Kunreuther et al., 2009;
Michel-Kerjan & Kousky, 2010). However, it cannot be applied in the case that disaster insurance
market has yet to be formed such as Vietnam. Thus, employing primary data tends to be supported
(Aliagha et al., 2015; Brouwer & Akter, 2010; Brouwer et al., 2013, Reynaud et al., 2012). Some
of these studies tried to use Choice Experiment Model to capture potential markets of flood
insurance, but besides worth learning points, many mistakes still remain.
In Vietnam, since flood insurance has been a new product with farmers, using choice experiment
is suitable. Only two studies was conducted capture the demand for flood insurance in Central
Vietnam, the authors employed Choice Experiment Model as method for their studies. But they
still did not correct the mistakes of the previous studies and neglected the effect of local residents’
perspective their flood insurance demand. Furthermore, there is no study conducted to capture the
demand of flood insurance in Mekong River Delta.
Overall, facilitating the disaster insurance sector in developing countries like Vietnam is
necessary. The information about the willingness-to-pay (WTP) of Vietnamese in disaster-prone
5
areas as well as the impacts of obstacles mentioned above on WTP are very helpful in this
circumstance.
1.2 Research objectives
In this study, Choice Experiments was employed to achieve the main objective in this study that
is the evaluation of WTP for flood insurance of farmers in the Mekong River Delta.
Firstly, we estimate the impacts of flood insurance attributes on the utility of farmers in Mekong
River Delta.
Secondly, we consider how the effects of challenges for flood insurance market development and
local irrigation services such as ambiguity, adverse selection, charity hazard, improvement of
irrigation and accessibility to pumping station on the impacts of these attributes. Based on findings
of previous studies, the effects of these challenges are captured by using perception of local
farmers about their vulnerability, fear of flood, government responsibility, and local irrigation
services.
Thirdly, based on the estimate results above we will evaluate willingness-to-pay of local farmers
for each level of attributes and willingness-to-pay for specific flood insurance packages with the
different combinations of policy types and providers.
Fourthly, we determine the variation of probability of WTP of Mekong River Delta farmers who
are willing to pay for flood insurance with the changes in premium level.
Finally, we would like to present some appropriate suggestions to insurance companies and
policymakers.
1.3 Scope of the study
In order to conduct this study, the data of this study was collected in three districts in Mekong
River Delta including Gao Giong, Phu Loc, Tan Cong Chi in October, 2015. These districts have
been affected by flood and other natural disaster in recent years.
6
1.4 Structure of this thesis
This thesis consists of five chapters. Theories about choice experiment and challenges of flood
insurance will be presented in Chapter 2. Besides, many empirical studies about the demand for
flood insurance and other similar types insurance are also reviewed. In Chapter 3, the data
collection and methodology used for this study will be mentioned. Interpretations and discussion
about statistics and empirical results will be presented in Chapter 4. Based on the results of this
study, the conclusions and recommendations for flood insurance company will be presented in
the Chapter 5.
7
CHAPTER 2
LITERATURE REVIEW
This chapter firstly introduce different approaches of studying insurance demand. After that, the
advantages and disadvantages of approaches will be discussed. Then, theories about Random
Utility Model will be presented, so that we could know the advantages of this method and how it
was applied to study about the demand for flood insurance and other similar types of insurance.
Some definitions and studies about challenges of development of flood insurance are also
presented in this chapter.
2.1 Previous studies without using RUM
2.1.1 Researches on agricultural insurance using secondary data or combine with
primary data
The empirical attention for the demand of crop insurances is still very small compared to its
development capabilities, though agricultural insurances could be considered as useful tools in
government burden reduction such as damage reduction facilitation and repelling disaster-induced
poverty trap for developing, financial difficulties mitigation due to crop failures or devaluation
(Barnett et al., 2008). Most of empirical studied focus on North American market or other
developed countries, and these studies tend to employ secondary data (Atreya et al, 2015; Dumm
et al., 2012) or combining with raw data were conducted (Enjolral et al, 2012; Sherrick et al.,
2003).
By employing the data of 135 counties in Georgia from 1978 to 2010, the determinants of flood
insurance purchasing were investigated (Atreya, 2015). They found that economic variables,
demographic variables have influence on flood insurance demand but flood mitigation assistance
does not. In another study, similar above method and the impact of representative heuristic on
distorting the resident behavior in risk assessment (Volkman-Wise, 2012) were combined to
evaluate the flood insurance demand (Dumm et al., 2012). As a result, the damage caused by
natural disaster in recent years have the positive effect on the disaster insurance demand, but this
effect will decease with time, and predictions before disaster happen will be underweighted. Even
8
though using secondary data may be economical, it cannot be applied in the case that disaster
insurance market has yet to be formed. Furthermore, if the authors only base on the secondary
data, it will be hard explicit the factors influencing the insurance purchase decision of farmers.
Many studies tried to combine the available secondary data with primary data. In the context of
innovating insurance program, many attributes would be changed and new agricultural insurances
were introduced, a survey was conducted to learn how attributes influence farmers’ preference
(Sherrick et al., 2003). In order to get an insight into effects of economic and weather condition
on buying insurance decision, secondary data were employed and combined with primary data in
this study. Interestingly, the methodology applied in Sherrick’s study is conjoint analysis which
support to form a specific product through statistics about attributes evaluation of respondents.
Sherrick and his partners found that flexibility in choosing the type of insurance and coverage
level have strong influence in insurance preference of Montana farmers. However, conjoint
analysis also make insurance design seem to be more complex, and this method also require the
large sample size and meticulous attribute levels to achieve effectiveness. In other study, the
determinants such as farm size, irrigation and some individual indicators have effects on buying
crop insurance (Enjolral et al, 2012). Researches which can access to a sufficient data and perform
a two-stage analysis in expected utility framework including measurement of crop insurance
demand elasticity and determination of purchasing crop insurance decision factors such as
Enjolral’s study (2012) is rare, because using secondary data or combining of secondary data and
primary data only cannot be applied, if the market of that agricultural has yet to be formed or
inaccessible.
2.1.2 Researches not applying RUM on agricultural insurance using primary data
In some developing countries, since many kinds of agricultural insurance is still a new product,
secondary date is not sufficient, conducting a survey to capture potential development capacity of
crop insurance or disaster insurance is preferred. In order to define the determinants of flood
insurance demand in Malaysia, demographics, aspects of exposure level, the ability to resilience
and adapt, residents’ perception about vulnerability level were considered (Aliagha et al., 2015).
But this study is quite simple and the result does not explicit any prominent issue in insurance
market or any particular flood insurance package should be launched.
9
In insurance market, due to information asymmetries, market failure such as adverse selection and
moral hazard can occur. Therefore, studies applying Expected Utility Maximization in theoretical
framework were expanded besides controlling heterogeneity. They considered the effects of
adverse selection by testing the ability to reflect individual risk perception of premium (Smith &
Baquet, 1996). Based on the survey in Montana, Smith and Baquet (1996) applied two stages
estimation procedures of Heckman including participation in any agricultural insurance decision
(probit model) and level of coverage decision (OLS). Many determinants affected the
participation decisions of local farmer. Due to adverse selection, the coverage-levels decisions of
farmer having positive expected return is different from farmers having negative expected return,
and premium cannot promote as a useful tool in reducing loss ratio.
A few year later, Expected Utility Maximization and Random Utility Theorem in theoretical
framework was also applied to study the influences of insurance contract perceptions on
participation decision and multi-peril insurance demand (Ye at al., 2015). Expected Utility
Maximization framework is used to learn participation decision of farmers which depends on
premium, insurance perception and indirect utility. The effect of insurance perception on
participation is evaluated by Framework of Random Utility Theorem, insurance participation and
perception have simultaneous correlation which is expressed by simultaneous equations. But the
econometric analysis based on the data obtained from a survey in Hubei, China indicates that local
farmers have a low perception about insurance contract, despite of long-time government
subsidiaries. May be due to this context, the strong learning-by-doing evidence of insurance
market cannot be found (Ye at al., 2015).
The demand for flood insurance demand of farmers would increase after experiencing a severe
flood, the result would be more precise if risk behaviors, mitigation and adaptation activities,
financial constraints, psychology, and information gaps were controlled (Turner et al., 2014).
Since risk behaviors of farmers is hard to capture, a lottery experiment were conducted to evaluate
risk attitude of respondents. In the case of Pakistan, Expected Utility Maximization framework,
exhibited in Probit Model with binary insurance choice experiment as depend variable, was
employed to investigate the determinants of flood insurance participation (Turner et al., 2014).
Although using Binary Probit Models in Expected Utility Maximization framework is quite
effective in finding the determinant of flood or crop insurance participation, it does not consider
10
the effects of attributes on insurance participation decision. Potential clients might envision
unreasonable insurance packages, and when real flood insurance packages were introduced, they
would be likely to have bad perceptions about insurance or be disappointed. In order to overcome
this issue, some studies applied Contingent Value Method (CVM) to capture the demand for
agricultural insurances.
Contingent Value Method was used to obtain the WTP for breeding-sow insurance (Wan, 2014).
In the survey, the respondents were provided a payment card method containing table of
calculated premium, coverage and the premium per coverage ratio and asked to choose the most
suitable combination. If the respondent cannot found the most suitable one, some open-end
question will be asked to support. The Tobit Model were applied in this case because premium,
coverage willingness to pay (depend variable) is always positive. After running models with
premium and coverage as depend variable, average WTP for premium and average coverage level
found is quite larger than the current level (Wan, 2014). However, one of the noticeable
limitations of CVM in evaluating WTP is determining the maximum amount of WTP right from
one question, this might cause a significant bias. Besides, restriction in presentation of
circumstances or period and limitations on considering changes in insurance contracts
simultaneously have urged researchers to apply better approaches.
2.2 Random utility model (RUM) and applications
2.2.1 Random utility model (RUM)
According to classical economic theory, the self-interest of consumers will be tried to maximize
by themselves. In the heterogeneous preferences theories, the preferences of consumer in
maximizing their utility were expressed as a utility function U(x) of vector x, and x stands for the
level of goods consumed under the budget constrain. The budget constrain can be represented by
px ≤ a, in which p is the price vector, a is income. The demand is x = d (a, p) +𝜀, where 𝜀 is the
disturbance due to errors in x measurement. These disturbance in consumer behavior observation
might come from random factors existing in economic agent objectives or their constraints
(Griliches, 1975).
In 1927, a law of comparative judgment of Thurstone suggests that individuals will response to
stimulus, and during the making choice process, people will choose the alternative which provides
11
the highest stimulus level. The alternative j have objective level 𝑉𝑗 and random error term 𝜀𝑗 . In
1960, the stimulus level in Thurstone’s study were applied in economics and presented as utility
in Random Utility Maximization Model by considering random factors effects in the binarychoice and multiple choice probability of utility maximization (Marschak, 1960).
Marschak expressed as utility level will be 𝑈𝑗 = 𝑉𝑗 +𝜀𝑗 = 𝑋𝑗 𝛽 +𝜀𝑗 , where 𝑉𝑗 and 𝜀𝑗 also were
considered as systematic component and random component respectively.
In 1966, the appearance of the “new theory of consumer demand” of Lancaster was the
modification in theory of demand in standard microeconomic. This theory argue that the
consumption purpose is not acquisition of goods themselves, but obtain characteristics that goods
contain. This theory help researchers in considering the combination of desired characteristics of
consumers and estimating the demand curve for new products. McFadden developed his study by
exploiting this “new theory of consumer demand” of Lancaster, and the systematic component
does not only mention about quantity of good but also about the characteristics of goods.
In McFadden’s study (1978), systematic component is also the function of attributes of alternative
j: 𝑉𝑗 = 𝛽0𝑗 + 𝛽1 𝑥𝑗1 + 𝛽2 𝑥𝑗2 + ⋯ + 𝛽𝐾 𝑥𝑗𝑘 , in which 𝑥𝑗𝑘 is attribute k level of alternative j, 𝛽𝑘 is
the marginal utility of attribute k and 𝛽0𝑗 is the alternative specific constant which indicates the
preference of alternative without attributes. The error term is the random variable with Gumbel
distribution: 𝜀~G(𝜂, 𝜇), in which 𝜂 and 𝜇 are location parameter and scale parameter respectively.
There is no doubt that the alternative having highest utility level will be chosen.
In the binary choice, the utility function U(x) of vector x is random utility indicator when:
Pr (𝑈𝑥 ≥ 𝑈𝑦 ) = 𝑃𝑥𝑦
In the multiple-choice, the utility function U(x) of vector x is random utility indicator when:
Pr (𝑈𝑥 ≥ 𝑈𝑦 , all y in 𝑋 ∗ ) = 𝑃𝑥 (𝑋 ∗ )
with 𝑋 ∗ ∈ 𝑋0
12
To sum up, the probability of choosing alternative j:
𝑝𝑗 = Pr (j is chosen among C)
𝑝𝑗 = Pr (𝑈𝑗 >𝑈𝑙 , ∀ 𝑙 ≠ 𝑗, 𝑗, 𝑙 ∈ 𝐶)
𝑝𝑗 = Pr (𝑈𝑗 >
𝑚𝑎𝑥
𝑙∈𝐶−{𝑗}𝑈𝑙 )
= Pr (𝑈𝑗 > 𝑈 ∗ )
𝑝𝑗 = Pr (𝑉𝑗 + 𝜀𝑗 >𝑉 ∗ + 𝜀 ∗ ) = Pr (𝜀 ∗ − 𝜀𝑗 < 𝑉𝑗 − 𝑉 ∗ )
𝑃𝑗 =
1
1+ 𝑒
𝜇(𝑉 ∗ −𝑉𝑗 )
With the Gumbel distribution: (𝜇 = 1)
𝑃𝑗 =
𝑒 𝑉𝑗
∑𝐽𝑙=1 𝑒 𝑉𝑙
The coefficients of the utility functions are estimated by maximizing the log-likelihood function:
𝑁
𝐽
𝑙𝑜𝑔𝐿 = ∑ ∑ 𝑌𝑖𝑗 ln(𝑝𝑖𝑗 )
𝑖=1 𝑗=1
Where: 𝑌𝑖𝑗 the choice of individual i on alternative j (1 = chosen)
Besides, the random factor in Random Utility Model caused by unobserved heterogeneity such as
experience, tastes and information source about attributes. These random factor distributions
generate the choice probabilities model in terms of parameters. Since the unobserved components
in consumer characteristics are assumed to correlate with observed components and participate in
subjective perception constitution, there exist an index of continuous random field between
unobserved and observed characteristics.
2.2.2 Researches applying RUM on agricultural insurance
The potential bias and other disadvantages of CVM can be overcome by RUM, because this
approach can evaluate the maximum WTP through considering the choses between different
drafts of insurance contract. Furthermore, providing drafts of reasonable insurance package will
13