PHÂN TÍCH TÌNH HÌNH tài CHÍNH CÔNG TY cổ PHẦN dược PHẨM IMEXPHARM QUA báo cáo tài CHÍNH e
Bạn đang xem bản rút gọn của tài liệu. Xem và tải ngay bản đầy đủ của tài liệu tại đây (345.95 KB, 19 trang )
PHÂN TÍCH TÌNH HÌNH TÀI CHÍNH CÔNG TY CỔ PHẦN DƯỢC PHẨM
IMEXPHARM QUA BÁO CÁO TÀI CHÍNH
TASK 1
Each group selects a company listed on the Stock Exchange in Ho Chi Minh City (STC) to
implement the project entitled "Assessing the financial health of the company X through the
analysis of the Financial Statement in order to make investment decisions. "
TASK 2
With the selected firm X in Task 1; your project titled: "Buy, sell or hold shares of Company X
through the use of Enterprise-valuation models."
TASK 1:
TASK 1
PART I: INTRODUCTION TO THE PHARMACEUTICAL INDUSTRY AND THE
JOINT STOCK PHARMACEUTICAL CORPORATION-IMEXPHARM
World Pharmaceutical Industry had high growth in 2000 – 2007 but has gradually slowed,
particularly in the U.S. and European regions. Revenue from the pharmaceutical industry in
2009 was estimated at 760 billion U.S. dollars, down 1.68% compared to 2008. RNCOS predicts
the growth of the pharmaceutical industry in developing countries in the period 2009 – 2012 will
be 12% - 15%, while the world only 6% - 8%.
Vietnam’s pharmaceutical industry went through many stages of development from an early
production to integration of the world’s pharmaceutical industry.
- Period 1975 – 1990: Vietnam’s pharmaceutical industry during the subsidy period.
- Period 1991-2005: pharmaceutical industry entered a period of renewal, transitioning from
subsidized to market mechanisms.
- Period 2006-2007: The pharmacy continued to grow at high speed, about 18 -20% / year.
Vietnam’s accession to WTO brought advantages as well as difficulties for the pharmaceutical
industry. Period 2008-2011: Vietnam’s pharmacy preparation and active integration with other
countries in the region and the world to ensure adequate supply of quality drugs and safety
FACTORS AFFECTING THE PHARMACEUTICAL INDUSTRY IN THE COUNTRY
- Pharmacy is one of the few industries not much affected by the economic crisis.
- The standards of living of the people of Vietnam have been increasingly improved, creating
favorable conditions for pharmaceutical development.
- Pharmaceutical industry is subject to the strict control of the Government
CURRENT SITUATION PHARMACEUTICAL INDUSTRY IN VIETNAM
Vietnam's pharmaceutical industry developed at low medium stage. Health spending accounted
for 1.6% of GDP (2009)
Raw materials for the pharmaceutical industry were imported mainly from Asian countries.
Vietnam's pharmaceutical industry met only 50% of domestic market demand. Distribution
system of Vietnam's pharmaceutical companies overlapped, companies competed with each
other for market, did trading around.
However pharmaceutical spending on medical services, pharmaceuticals increasingly went up.
Pharmaceuticals are classified into categories of goods under stabilizing prices policy by the
Government.
IMEXPHARM PHARMACEUTICAL JOINT STOCK COMPANY
- Abbreviation: Imexpharm.
- stock symbol: IMP (registered at HCM - HOSE)
- Head office: 4 , 30/04 street, ward 1, Cao Lãnh, Đồng Tháp
Tel: +84-(0) 67- 3851 620, +84-(0)67 3851 941
Fax: +84-(0) 67- 3853 106
Website:
Email:
1. HISTORY:
1975 – 1986 : pharmaceutical Company Level II.
1986 – 1992 : Union of pharmaceutical Companies of Đồng Tháp.
1992 – 1999 : Đồng Tháp pharmaceutical Company.
1999 – 2001 : pharmaceutical CompanyNo. 7
From 25/7/2002–present: Joint stock pharmaceutical Corporation IMEXPHARM.
Volume of current stocks up to 31/12/2011: 15.214.500
Total listed value:
152.145.000.000 đ
Management Board:
Chairperson:
Trần Thị Đào
Member of the Board: Nguyễn Quốc Định
Member of the Board: Nguyễn Kiêm Phương
Member of the Board:Nguyễn Thị Thu Hồng
Member of the Board:Phan Hoàng Minh Trí
Member of the Board:Trần Anh Tuấn
Member of the Board:Võ Hữu Tuấn
Inspection Chief:
Nguyễn Đức Tuấn
Inspection member:
Đỗ Thị Thanh Thúy
Inspection member:
Lê Thị Kim Chung
2. Scopes of business:
Production, Trading, Import and Export of pharmaceuticals, devices and medical equipment,
raw materials, packaging production of medicines, traditional medicines, veterinary medicines
and cosmetics.
Food, functional foods, beverages, alcoholic beverages, carbonated soft drink, antiseptics,
disinfectants and to providing service storage for drugs, drug raw materials.
Growing and processing medicinal herbs and tourism resort, financial investments and real
estate business.
3. IMEXPHARM POSITION:
- Imexpharm was voted a strong brand in
Vietnam.
- - - Imexpharm was the 1st pharmaceutical
Company of Vietnam to get standards of good
manufacturing practice (GMP ASEAN) in
1997.
- - - Imexpharm was the 1st Pharmaceutical
Company of Vietnam to have franchise
production with European Pharmaceutical Groups.
- Obtained Good Manufacturing Practice GMP-WHO GMP, GLP, GSP, HACCP
ISO 9001: 2008 and 22000.
- Products:
Manufacturing more than 200 products, variety of species, European quality standards by:
Franchise manufacturing for corporations: Sandoz (Biochemie), Robinson Pharma, Pharma DP,
OPV, Galien, ...
Imexpharm products: The main products are antibiotics, Analgesic, Antipyretic,
Antiinflammatory, Musculoskeletal, vitamins, minerals, special therapy, and other products.
Joint Venture Products: diverse product line of the brand PMS-Imexpharm (Joint venture
between Pharmascience Imexpharm and Canada)
Export goods: Besides the franchise product line, Imexpharm has boosted to produce standard
products to export to foreign markets such as; Cambodia, France, South Africa, the Middle East,
Moldova, ...
- Sales and marketing: good, broad product coverage in the local market
- Human resources: employees with high qualifications and have dedication to the Company.
Develop policies to attract labors to the company.
4. DEVELOPMENT STRATEGY AND INVESTMENT:
- To be a Pharmaceutical manufacturer of high quality, reasonble price, customer-oriented
service, improving added value for customers and partners.
- To become the leading pharmaceutical company in Vietnam that multinational pharmaceutical
partners choose as their strategic partner in franchising production of their products in Vietnam
and internationally.
- Culture and business philosophy: having distinguished characteristics of Imexpharam.
- Imexpharm always involved, shared responsibility with the society and community on its way
to development and success.
PART II: BASIC ANALYSIS
I. ANALYSIS OF NON-FINANCIAL FACTORS
1. PRODUCTION CAPACITY:
With sufficient investment in the plant, equipment, people, so the current production capacity of
IMP can provide many times more than the amount consumed.
2. TECHNOLOGY:
IMP is the first unit of the pharmaceutical industry to invest effective lines of modern
technologies such as:
- Line versatile herbal extracts
- Production line of capsule
- Effervescent production line
- Pharmaceutical Ethanol system
- Equipped with advanced testing machines used for quality control of products such as:
The system high-pressure liquid chromatography, Gas chromatography system, Absorption
spectrometer, the machine voltage titration
3. HUMAN RESOURCES:
IMP team has nearly 500 employees, of which over 100 officials having university graduate and
post graduate and experienced, dedicated to ensuring the credibility and customer satisfaction
from research and development, quality control, storage, product delivery to customer care and
service.
II. ANALYSIS OF THE FINANCIAL REPORT
BALANCE SHEET
2011
2010
2009
2008
Assets
Current assets
Cash and equivalents
Short term financial investments
Short term Receivables
Reserve
others
Total Current Assets
Long term Receivables
Fixed Assets
(Accrued armortization)
Real estate investment
Long term financial investments
other long term investments
Trade advantage
Total long term Assets
TOTAL ASSETS
Payables
Short term debts
Long term debts
TOTAL SHORT TERM DEBTS
Capital
Equity
Other funds
TOTAL CAPITAL
Interest of Minority Shareholders
TOTAL LIABILITIES AND
CAPITAL
140,281
3,035
194,275
222,400
6,769
566,759
111,007
3,601
199,981
172,674
10,425
497,688
135,040
12,808
175,895
195,921
7,527
527,191
110,881
25,707
106,864
148,255
6,478
398,184
213,030
-117,314
205,073
-94,355
152,338
-91,995
131,977
-82,332
33,040
14,861
33,810
14,430
37,648
14,291
39,176
27,074
260.930
827,689
253.312
751,000
204.278
731,469
198.227
596,411
116,644
2,028
118,671
160,035
1,706
161,741
182,931
10,808
193,739
81,905
1,932
83,838
709,018
589,260
537,730
512,573
709,018
589,260
537,730
512,573
827,689
751,000
731,469
596,411
Business Results
Net Revenue
Cost of Goods sold
Gross income
Operating expenses
Finance expenses
In which interests accounted
Sales expenses
2011
2010
2009
2008
776,365 763,995 660,076 561,844
388,430 411,098 366,643 319,809
387,935 352,896 293,433 242,036
7,178
8,029
9,685 13,913
723
2,443
1,797
533
234,582 220,270 181,877 145,012
Managemnet expenses
Total operating expenses
Total financial revenue
Business revenue
Other profits
Total Income before Tax
Corporate Income Tax
Interest of Minority Shareholders
Income after income Tax
48,098
289,85
35,441
263,74
29,965
221,52
24,969
183,89
8
12,941
111,018
(530)
110,488
32,882
0
10,140
99,297
(1,177)
98,121
17,655
7
11,246
83,152
(2,623)
80,528
14,822
4
16,988
75,128
(4,355)
70,773
12,507
77,606
80,466
65,707
58,266
VERTICAL ANALYSIS BUSINESS RESULTS
Year
Revenue
Cost of Goods sold
Sales expenses
Management Expenses
Income before Tax
Income & other expenses
Income after Tax
2011
2010
2009
2008
%
100
50
30
6
14
1
%
100
54
29
5
13
0.28
11
%
100
56
28
5
12
0.24
10
%
100
57
26
4
13
1
10
10
ANALYSIS OF RESULTS OF BUSINESS OPERATIONS BY TIME
Year
2011
2010
2009
2008
Industry
%
%
%
%
average
2008 –
Revenue
Cost of goods sold
Sales expenses
Management expenses
Net income before tax
Net income after tax
38.18
21.46
61.77
92.63
56.12
56.12
35.98
28.54
51.90
41.94
38.64
38.64
17.48
14.64
25.42
20.01
13.78
13.78
1
1
1
1
1
1
2011 (%)
23
---36
30
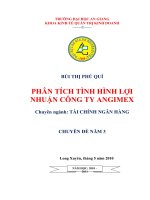
- Evaluation 1 :
+ Through vertical analysis of the results of business
operations it showed that the ratio of cost to revenue from
2008 to 2011 tended to decrease from 57% to 50% proving
that the company has demonstrated savings in cost,
reducting products cost. Selling expenses increased each
year also showed the company has had programs of
promotion, marketing, customer support policies ... to promote the consumption of goods.
- Evaluation2:
Through sequence analysis of the results of business operations &the growth chart of sales /
profitability showed stable revenue growth: 35.98% in 2010, 38.18% in 2011 compared to
industry average of 23% and these were good results to promote. However, management cost at
61.77% in 2011, while in 2010 at 41.94% was due to management cost in 2011 increased 60%
compared to 2010 (as per annual financial report 2011), this should be considered carefully
because it affects the profitability of the Company.
+ In summary, the report of the results of business operations from 2008 -2011 showed constant
revenue growth each year and it was higher than the industry average. Likewise profit also
increased from 13.78% (2009), 38.64% (2010) and 56.12% (2011) higher than the industry
average of 30%.
FINANCIAL INDICATORS
Allocation of Assets and Capital
2011
2010
2009
2008
Structures
%
Assets Structure
- Total current assets/Total Assets 68,47
%
%
%
66,27
72,07
66,76
(%)
- Total
assets/Total 31,53
33,73
27,93
33,24
Assets(%)
Capital structures
- Current debts /Total liabilities and 14,09
21,31
25,00
13,74
0,25
0,23
1,48
0,32
and owners' equity (%)
- Equity/ Total liabilities and owners' 85,66
78,46
73,52
85,94
long
term
owners' equity (%)
- Long term debts / Total liabilities
equity (%)
- Evaluation3:
Structure of assets: the company planned to develop intensive and long-term investment in
machinery and equipment, transport means, to purchase land to expand production scale. As per
the Balance Sheet, total assets increased annually: 596,411 (2008), 731,469 (2009) 751,000
(2010), 827,689 (2011), while the ratio of total of long term assets to the total assets did not
change much: 33,24% (2008) 27,93% (2009) 33,73% (2010) 31,53% (2011).
Regarding capital structure: the ratio of short-term
debts/total capital: 13.74% (2008), 25% (2009),
21.31% (2010), 14.09% (2011) areall smaller than the
ratio of total current assets / total assets: 66.76% (2008) 72.07% (2009) 66.27% (2010) 68.47%
(in 2011).These showeda good financial capability of the company, its strong growth of equity,
for investing in short-term and long-term projects.
FINANCIAL INDICATORS
Industry
average
TT
2008
Indicators
I
Debts ratios
1
2
Current ratio
Quick ration
ĐVT
Times
Times
2011
4,86
2,95
2010
3,11
2,03
2009
2,88
1,81
2008
-2011
4,86
3.05
2,10
1,45
- Evaluation 4:
Current ratio and quick ratio ofthe company decreased in 2009 but increased in 2010 and
higher than the industry average. It showed that the liquidity of the company improved.
II
Operating Ratios
Total Assets turnover
Total Fixed Assets turnover
Inventory turnover
Receivables turnover
times
times
times
times
1,07
3,64
1,75
3,99
1,02
3,73
2,38
3,82
0,9
4,33
1,87
3,75
0,94
4,26
2,16
5,26
1,56
-5,05
5,39
- Evaluation 5:
+ Efficiency of total assets in 2011: 1.07 which was higher than in 2010: 1.02; 2009: 0.9 and
2008: 0.94 but still lower than the industry average 1.56. This demonstratedthe use of assets of
not much effective. The company should take measures to improve this situation.
+ Efficiency of fixed assets of the company tended to decrease: in 2008: 4.26, 2009: 4.33;
2010: 3.73 and 2011: 3.64. This proved the use of fixed assets less effective, requiring remedial
measures immediately.
+ Inventory turnover in 2011: 1.75 which was lower than in 2010: 2.38; 2009: 1.87 and 2008:
2.16, and lower than the industry average 5.05. This showed the irrationality and inefficiency
in the management of reserve goods. Besides production and consumption of goods should
also be reviewed to provide a solution to handle the issue properly and timely.
+ Receivable turnover in 2009: 3.75; 2010: 3.82; and 2011: 3.99 which was not be improved
and lower than the industry average (5.05). This is a significant problem, because the increase
in receivables in 2009: 60% , 2010: 87%, 2011: 82% greater than revenue growth in 2009:
17%, in 2010 : 36% and 2011: 38%, showing stagnant capital in the payment process.
III Profitability Ratio
Income before tax/Total assets
%
(ROA)
13
13
11
12
13,55
11
14
12
11
18,80
%
Income after tax /Equity (ROE)
Evaluation 6:
Profitability ratio, return on assets - ROA increased steadily, but still lower than the industry
average. The reason is that sales and management expenses increased more than the revenue
growth, which affected the profitability of the Company and the inefficient use of assets.
+ Ratio of return on equity - ROE is of the most important for shareholders, this ratio measured
profitability on every dollar of shareholders’ capital. The financial statements showed the
increase of profits over the years: 2009: 13.78%, 2010: 38.64%, 2011: 56.12%, besides equity
increasefrom 2009 : 5%, 2010: 15% in 2011; 38% made ROE indicators over the years lower
than the industry average of 18.8%
IV
Debt Ratio
Debt Ratio to Total assets
Debt Ratio to Equity
%
%
14,34
16,74
21,53
27,45
26,48
36,03
14,06
16,36
35,00
39,00
- Evaluation7:
Debt ratio on total assets: This ratio is used to determine the obligations of business owners for
the creditors in the capital contribution. For Imexpharm, the debt ratio over the years was lower
than the industry average of 35%, demonstrating the Company's operations are relatively
stable.
+ Debt to equity was lower than the industry average of 39%, indicating good financial
situation, thus the bank will easily support the Company.
V /Stock index
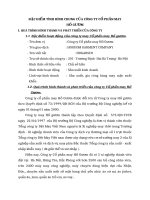
- Evaluation 8:
EPS showedthe profit per share each year investors
are entitled to. This indicator is rated as high as
possible because earnings per share then would be
higher.
Through EPS growth chart –its current price is taken
from ,
EPS increased
continuously in 2008: 3880; 2009: 4371; 2010: 5383; 2011: 5419 while the industry average
EPS is: 5220. This index was higher than the industry average, showing that high stock returns
of IMP which was one of the factors that help investors study the growth trend in the future to
invest in shares of IMP
indicators
2011
2010
2009
2008
Industry
average
P/E
6.7
10.4
15.2
14.8
7.2
5.419 5.383 4.371 3.880
5.220
(times)
EPS
(VND)
P/B
-23
42
85
68
90
(%)
`
- Evaluation 9:
P / E ratio shows how much the current stock prices higher than stocks, or how much an investor
has to spend to get a dollar income. Through EPS growth chart - current price, we have the
following P / E : 2008: 14.8; 2009: 15.2; 2010: 10.4; 2011: 6.7. This ratio tended to decrease and
lower than the industry average of 7.2 and it was affected by: * steady increase of EPS each year
& current decline in stock price.
+ Through volume growth chart - Book value, indicating ansteady growth of average trading
volume of IMP shares, of bookvalueof sharesthat made the P / B ratiodecreased. Thus the
current share price is lower IMP stock book value, ie IMP stocks are at good price,a factor for
investors to buy stocks on
PART III: HAVING AN INVESTMENT DECISION
Through the analysis of financial indicators above, it showed that IMP shares have good
financial strength, growth potential, quite attractive for investors.
Pharmacy is one of the few industries least affected by the economic crisis. The standard
of living of the people of Vietnam have been increasingly improved, creating favorable
conditions for pharmaceutical development. however, the pharmaceutical industry is still under
tight control by the Government.
The rise of the CPI also made pharmaceutical price increased. This has contributed to
ensuring the profitability of pharmaceutical companies for steady growth.
IMP is a strong brand in the industry. In recent years the input material prices increased,
but due to reasonable management,
reducing cost of production and management costs,
increasing productivity and capacity of the plant;thesekept IMP at stable profit.
IMP shares are inconsistent to short-term surfinginvestors becauseits liquidity is not
stable, lower than the average of many other key sectors. During the fluctuated periods of the
stock market, the stock prices of the pharmaceutical industry were not much declined so that
there would be less chance for a bigleap up.
IMP stocks are more suitable for medium and long term investors by a relatively stable
cash flow and high dividend
Task 2: Make a project : "Buying, selling or holding shares of the IMP through the use
of valuation models.
1. Valuation Model by book:
* EPS (Earnings per share) = (Net income - Preference Dividends) / Average number of
common shares of recent 4 quarters
= 77,606 bilion VND / 14,321 milion shares = 5.419 VND
* P / E (price earnings ratio) = Current Price / EPS = 36,500 / 5419 = 6.74 (times)
* Current shares = listed shares - Fund shares
= 15,021,568 - 0
= 15,021,568 shares
* Book value = Equity / Total volume of shares
= 709,018,000,000 / 15,021,568 = 47,200 VND / share
* P / B (market price ratio compared to book value) = Current Price / Book value
= 36,500 / 47,200 = 0.77 (times), ie the current stock market is lower rated than book
value of about 22%
* ROE (Return on equity) = Total Net income of the 4 recent quarters / Equity
= 77.606 billion VND / 709.018 billion VND = 11%
2. Dividend discount model:
This model applies to shares in the period of stable growth with a constant dividend and
stable. Rather than calculating the current value of each line of dividends and combined,
(GS) Myrin Gordon has developed formulas for the intrinsic value simply as:
Intrinsic value of the dividend = Expected Dividend of next year / (the expected return
rate - growth rate of dividends)
P = D1 / (kC - g) = [D0 ( 1+ g)] / (kC - g)
Of which:
P: stock price
D0: Current Dividend: 22%
D1: Dividend expected next year (2012)
kC : Net profit expectations of shareholders = 13.66%
Dividend rate in 2011 = 22%
g: growth rate of annual dividend = (1 - dividend ratio) * ROE
= Ratio * ROE retained earnings
g = (1-22%) * 11% = 0.78 * 11% = 8.6%
With the profits achieved in 2011, The shareholders’ Conference
passed the share
dividend in 2011 was 22% (2.200 VND / sahre), IMP is in stable growth period and the
expected dividends in the coming years will increase at constant growth rate of 8.6% per
year. If the expected rate of return of shareholders of 13.8% / year, the current stock price
of the IMP is defined as follows: "
PIMP = [D0 ( 1+ g)] / (kC - g) = [2.200 (1+ 8,6 %)] / (13,66% - 8,6 %) = 2.390 / 5,06 % =
47.200 VND/ share
3. Buying, selling or holding shares of IMP:
In recent years, macro-economic crisis has not come an end, most enterprises are still in
difficult situation. Owing to reasonable and cautious policies, IMP still ensures stable
profits .
With book value at 47,200 VND / share, or PIMP is 47,200 VND / share. Its share in market
is evaluated lower than the book value of about 22% books, P / E = 6.74 is pretty good, so
the price 36,500 / share is quite reasonable to invest.
However, Beta coefficient of IMP (0.01), ie IMP stock price fluctuations are small compared
to the volatility of the market. Because liquidity is not stable, lower than the industry
average, and many other industries, and more importantly the lack of mutation
information. During the strongly adjusted periods of market, IMP stock prices in particular
and the whole pharmaceutical industry in general did not decline much so there would
also less chances to greatly increase.
So IMP stocks are inconsistent to investors for surfing , but it is suitable for value investors
of medium and long term holding, due to cash flow and high dividend.
References:
IMP Balance sheet 2011 & Business Report 2011
/> />