THUYẾT TRÌNH KINH tế LƯỢNG
Bạn đang xem bản rút gọn của tài liệu. Xem và tải ngay bản đầy đủ của tài liệu tại đây (6.26 MB, 36 trang )
THUYẾT TRÌNH KINH TẾ LƯỢNG
PHÂN TÍCH CÁC YẾU TỐ ẢNH HƯỞNG
ĐẾN CHIỀU CAO SINH VIÊN UEH
Danh sách thành viên Nhóm 7
1. Dương Mỹ Hảo
2. Nguyễn Hoàng Minh Châu
3. Phan Thành Đạt
4. Đào Thúy Ngân
5. Nguyễn Thị Thúy
6. Trần Quang Tuấn
7. Phan Thị Hải Trang
8. Nguyễn Thảo Vi
9. Trương Tố Yên
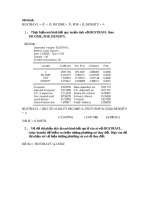
Thực hiện khảo sát trên 140 sinh viên UEH, ta có các số liệu và kết quả sau:
Câu 1:
1.Hồi quy biến chiều cao theo biến chiều cao ba.
Dependent Variable: Y
Method: Least Squares
Date: 11/29/18 Time: 17:45
Sample: 1 140
Included observations: 140
Variable
Coefficient
Std. Error
t-Statistic
Prob.
C
YBA
1.008898
0.359843
0.154584
0.092048
6.526530
3.909298
0.0000
0.0001
R-squared
Adjusted R-squared
S.E. of regression
Sum squared resid
Log likelihood
F-statistic
Prob(F-statistic)
0.099702
0.093178
0.074316
0.762164
166.2751
15.28261
0.000145
Mean dependent var
S.D. dependent var
Akaike info criterion
Schwarz criterion
Hannan-Quinn criter.
Durbin-Watson stat
1.612714
0.078041
-2.346788
-2.304764
-2.329711
1.877447
2. Hồi quy biến chiều cao theo biến chiều cao mẹ.
Dependent Variable: Y
Method: Least Squares
Date: 11/29/18 Time: 18:15
Sample: 1 140
Included observations: 140
Variable
Coefficient
Std. Error
t-Statistic
Prob.
C
YME
0.743409
0.553345
0.196777
0.125194
3.777920
4.419905
0.0002
0.0000
R-squared
Adjusted R-squared
S.E. of regression
Sum squared resid
Log likelihood
F-statistic
Prob(F-statistic)
0.124007
0.117660
0.073306
0.741588
168.1909
19.53556
0.000020
Mean dependent var
S.D. dependent var
Akaike info criterion
Schwarz criterion
Hannan-Quinn criter.
Durbin-Watson stat
1.612714
0.078041
-2.374156
-2.332132
-2.357078
1.813260
3. Hồi quy biến chiều cao theo biến weight
Dependent Variable: Y
Method: Least Squares
Date: 11/29/18 Time: 18:17
Sample: 1 140
Included observations: 140
Variable
Coefficient
Std. Error
t-Statistic
Prob.
C
WEIGHT
1.304065
0.005824
0.026028
0.000483
50.10302
12.04995
0.0000
0.0000
R-squared
Adjusted R-squared
S.E. of regression
Sum squared resid
Log likelihood
F-statistic
Prob(F-statistic)
0.512714
0.509183
0.054674
0.412521
209.2463
145.2012
0.000000
Mean dependent var
S.D. dependent var
Akaike info criterion
Schwarz criterion
Hannan-Quinn criter.
Durbin-Watson stat
1.612714
0.078041
-2.960662
-2.918639
-2.943585
2.029664
4. Hồi quy biến chiều cao theo biến Sport
Dependent Variable: Y
Method: Least Squares
Date: 11/29/18 Time: 18:36
Sample: 1 140
Included observations: 140
Variable
Coefficient
Std. Error
t-Statistic
Prob.
C
SPORT
1.582645
0.011049
0.007979
0.001949
198.3488
5.669784
0.0000
0.0000
R-squared
Adjusted R-squared
S.E. of regression
Sum squared resid
Log likelihood
F-statistic
Prob(F-statistic)
0.188934
0.183057
0.070537
0.686623
173.5815
32.14645
0.000000
Mean dependent var
S.D. dependent var
Akaike info criterion
Schwarz criterion
Hannan-Quinn criter.
Durbin-Watson stat
1.612714
0.078041
-2.451164
-2.409140
-2.434087
1.905169
5. Hồi quy biến chiều cao theo biến Sleep
Dependent Variable: Y
Method: Least Squares
Date: 11/29/18 Time: 18:39
Sample: 1 140
Included observations: 140
Variable
Coefficient
Std. Error
t-Statistic
Prob.
C
SLEEP
1.573412
0.005519
0.035805
0.004942
43.94384
1.116761
0.0000
0.2660
R-squared
Adjusted R-squared
S.E. of regression
Sum squared resid
Log likelihood
F-statistic
Prob(F-statistic)
0.008956
0.001775
0.077972
0.838986
159.5528
1.247154
0.266037
Mean dependent var
S.D. dependent var
Akaike info criterion
Schwarz criterion
Hannan-Quinn criter.
Durbin-Watson stat
1.612714
0.078041
-2.250755
-2.208731
-2.233678
1.804085
6. Hồi quy biến chiều cao theo biến Milk
Dependent Variable: Y
Method: Least Squares
Date: 11/29/18 Time: 18:46
Sample: 1 140
Included observations: 140
Variable
Coefficient
Std. Error
t-Statistic
Prob.
C
MILK
1.599071
0.010914
0.008866
0.004823
180.3647
2.262832
0.0000
0.0252
R-squared
Adjusted R-squared
S.E. of regression
Sum squared resid
Log likelihood
F-statistic
Prob(F-statistic)
0.035777
0.028790
0.076910
0.816281
161.4733
5.120406
0.025208
Mean dependent var
S.D. dependent var
Akaike info criterion
Schwarz criterion
Hannan-Quinn criter.
Durbin-Watson stat
1.612714
0.078041
-2.278191
-2.236167
-2.261114
1.840829
7. Hồi quy biến chiều cao theo biến GPA
Dependent Variable: Y
Method: Least Squares
Date: 11/29/18 Time: 18:53
Sample: 1 140
Included observations: 140
Variable
Coefficient
Std. Error
t-Statistic
Prob.
C
GPA
1.612779
-7.60E-06
0.009512
0.000800
169.5555
-0.009507
0.0000
0.9924
R-squared
Adjusted R-squared
S.E. of regression
Sum squared resid
Log likelihood
F-statistic
Prob(F-statistic)
0.000001
-0.007246
0.078323
0.846568
158.9231
9.04E-05
0.992428
Mean dependent var
S.D. dependent var
Akaike info criterion
Schwarz criterion
Hannan-Quinn criter.
Durbin-Watson stat
1.612714
0.078041
-2.241759
-2.199735
-2.224682
1.841472
8. Hồi quy biến chiều cao theo biến ACE
Dependent Variable: Y
Method: Least Squares
Date: 11/29/18 Time: 18:54
Sample: 1 140
Included observations: 140
Variable
Coefficient
Std. Error
t-Statistic
Prob.
C
ACE
1.630408
-0.007790
0.014355
0.005618
113.5781
-1.386497
0.0000
0.1678
R-squared
Adjusted R-squared
S.E. of regression
Sum squared resid
Log likelihood
F-statistic
Prob(F-statistic)
0.013739
0.006592
0.077784
0.834938
159.8914
1.922375
0.167831
Mean dependent var
S.D. dependent var
Akaike info criterion
Schwarz criterion
Hannan-Quinn criter.
Durbin-Watson stat
1.612714
0.078041
-2.255592
-2.213569
-2.238515
1.841246
9. Hồi quy biến chiều cao theo biến Money
Dependent Variable: Y
Method: Least Squares
Date: 11/29/18 Time: 18:48
Sample: 1 140
Included observations: 140
Variable
Coefficient
Std. Error
t-Statistic
Prob.
C
MONEY
1.593293
0.006972
0.009803
0.002647
162.5318
2.633718
0.0000
0.0094
R-squared
Adjusted R-squared
S.E. of regression
Sum squared resid
Log likelihood
F-statistic
Prob(F-statistic)
0.047859
0.040959
0.076426
0.806053
162.3560
6.936470
0.009410
Mean dependent var
S.D. dependent var
Akaike info criterion
Schwarz criterion
Hannan-Quinn criter.
Durbin-Watson stat
1.612714
0.078041
-2.290800
-2.248776
-2.273723
1.827589
ðTheo R-squared , thì Weight có R-squared lớn nhất,
chọn weight để tiếp tục chạy hồi quy các biến sau
a. WEIGHT LIN-LOG
Dependent Variable: Y
Method: Least Squares
Date: 11/29/18 Time: 18:58
Sample: 1 140
Included observations: 140
Variable
Coefficient
Std. Error
t-Statistic
Prob.
C
LOG(WEIGHT)
0.254838
0.343261
0.109059
0.027545
2.336712
12.46169
0.0209
0.0000
R-squared
Adjusted R-squared
S.E. of regression
Sum squared resid
Log likelihood
F-statistic
Prob(F-statistic)
0.529482
0.526073
0.053725
0.398326
211.6975
155.2938
0.000000
Mean dependent var
S.D. dependent var
Akaike info criterion
Schwarz criterion
Hannan-Quinn criter.
Durbin-Watson stat
1.612714
0.078041
-2.995679
-2.953656
-2.978602
2.006439
b. WEIGHT LOG-LOG
Dependent Variable: LOG(Y)
Method: Least Squares
Date: 11/29/18 Time: 19:00
Sample: 1 140
Included observations: 140
Variable
Coefficient
Std. Error
t-Statistic
Prob.
C
LOG(WEIGHT)
-0.347199
0.208297
0.066431
0.016779
-5.226446
12.41436
0.0000
0.0000
R-squared
Adjusted R-squared
S.E. of regression
Sum squared resid
Log likelihood
F-statistic
Prob(F-statistic)
0.527586
0.524162
0.032726
0.147796
281.0981
154.1164
0.000000
Mean dependent var
S.D. dependent var
Akaike info criterion
Schwarz criterion
Hannan-Quinn criter.
Durbin-Watson stat
0.476787
0.047442
-3.987115
-3.945092
-3.970038
2.017500
c. WEIGHT LOG-LIN
Dependent Variable: LOG(Y)
Method: Least Squares
Date: 11/29/18 Time: 19:09
Sample: 1 140
Included observations: 140
Variable
Coefficient
Std. Error
t-Statistic
Prob.
C
WEIGHT
0.290100
0.003523
0.015906
0.000295
18.23860
11.92644
0.0000
0.0000
R-squared
Adjusted R-squared
S.E. of regression
Sum squared resid
Log likelihood
F-statistic
Prob(F-statistic)
0.507565
0.503997
0.033412
0.154060
278.1927
142.2401
0.000000
Mean dependent var
S.D. dependent var
Akaike info criterion
Schwarz criterion
Hannan-Quinn criter.
Durbin-Watson stat
0.476787
0.047442
-3.945609
-3.903586
-3.928532
2.036666
d. WEIGHT qua gốc tọa độ
Dependent Variable: Y
Method: Least Squares
Date: 11/29/18 Time: 19:02
Sample: 1 140
Included observations: 140
Variable
Coefficient
Std. Error
t-Statistic
Prob.
WEIGHT
0.029657
0.000375
79.17772
0.0000
R-squared
Adjusted R-squared
S.E. of regression
Sum squared resid
Log likelihood
Durbin-Watson stat
-8.351345
-8.351345
0.238650
7.916555
2.436649
1.843925
Mean dependent var
S.D. dependent var
Akaike info criterion
Schwarz criterion
Hannan-Quinn criter.
1.612714
0.078041
-0.020524
0.000488
-0.011985
e. WEIGHT bậc 2
Dependent Variable: Y
Method: Least Squares
Date: 11/29/18 Time: 19:04
Sample: 1 140
Included observations: 140
Variable
Coefficient
Std. Error
t-Statistic
Prob.
C
WEIGHT^2
1.480343
4.57E-05
0.012797
4.09E-06
115.6780
11.15834
0.0000
0.0000
R-squared
Adjusted R-squared
S.E. of regression
Sum squared resid
Log likelihood
F-statistic
Prob(F-statistic)
0.474303
0.470493
0.056788
0.445039
203.9351
124.5085
0.000000
Mean dependent var
S.D. dependent var
Akaike info criterion
Schwarz criterion
Hannan-Quinn criter.
Durbin-Watson stat
1.612714
0.078041
-2.884788
-2.842764
-2.867711
2.044662
Dựa vào tiêu chuẩn Log-likehood, R-squared (càng lớn càng tốt),
AIC, SC, HQC (càng nhỏ càng tốt) , trong đó AIC được nhiều
người tin tưởng nhất vậy mô hình log – log được chọn
Ý nghĩa hệ số góc của từng mô hình
Câu 2: Chạy hàm hồi quy Y theo các biến YBA YME FEMALE SPORT KVS-TT
Y: chiều cao của sv UEH (m)
Yba: chiều cao ba (m)
Yme: chiều cao mẹ(m)
Female: biến giả có giá trị bằng 1 nếu là nữ
Sport: thời gian chơi thể thao trung bình mỗi tuần ( giờ/tuần)
Kvs-TT : biến giả có giá trị bằng 1 nếu ở vùng thành thị
Dependent Variable: Y
Method: Least Squares
Date: 11/29/18 Time: 18:19
Sample: 1 140
Included observations: 140
Variable
Coefficient
Std. Error
t-Statistic
Prob.
C
YBA
YME
FEMALE
SPORT
KVS__TT
0.549251
0.362951
0.332216
-0.109597
0.004772
0.018624
0.179058
0.062913
0.085357
0.009605
0.001431
0.014018
3.067451
5.769128
3.892072
-11.41006
3.334999
1.328585
0.0026
0.0000
0.0002
0.0000
0.0011
0.1862
R-squared
Adjusted R-squared
S.E. of regression
Sum squared resid
Log likelihood
F-statistic
Prob(F-statistic)
0.653026
0.640080
0.046820
0.293737
233.0185
50.43928
0.000000
Mean dependent var
S.D. dependent var
Akaike info criterion
Schwarz criterion
Hannan-Quinn criter.
Durbin-Watson stat
1.612714
0.078041
-3.243121
-3.117051
-3.191890
1.993912
• H0: β3=0,02 ; H1: β3 ≠ 0,02 (kiểm định t theo giá trị tới
hạn) với mức ý nghĩa 5%
134
t 0 , 025
ð Chấp nhận H0
Wald Test:
Equation: CAU2
Test Statistic
t-statistic
F-statistic
Chi-square
Value
df
Probability
-13.49225
182.0407
182.0407
134
(1, 134)
1
0.0000
0.0000
0.0000
Value
Std. Err.
-0.129597
0.009605
Null Hypothesis: C(4)=0.02
Null Hypothesis Summary:
Normalized Restriction (= 0)
-0.02 + C(4)
Restrictions are linear in coefficients.
Wald Test:
Equation: CAU2
Test Statistic
F-statistic
Chi-square
Value
df
Probability
94174.81
282524.4
(3, 134)
3
0.0000
0.0000
Null Hypothesis: C(2)=0,C(3)=3,C(4)=-5
Null Hypothesis Summary:
Normalized Restriction (= 0)
C(2)
-3 + C(3)
5 + C(4)
Value
Std. Err.
0.362951
-2.667784
4.890403
0.062913
0.085357
0.009605
Restrictions are linear in coefficients.
Wald Test:
Equation: CAU2
Test Statistic
F-statistic
Chi-square
Value
df
Probability
62.87211
251.4884
(4, 134)
4
0.0000
0.0000
Null Hypothesis: C(2)=C(3)=C(4)=C(5)=0
Null Hypothesis Summary:
Normalized Restriction (= 0)
C(2)
C(3)
C(4)
C(5)
Value
Std. Err.
0.362951
0.332216
-0.109597
0.004772
0.062913
0.085357
0.009605
0.001431
Restrictions are linear in coefficients.
Coefficient Confidence Intervals
Date: 11/29/18 Time: 18:58
Sample: 1 140
Included observations: 140
95% CI
Variable
Coefficient
Low
High
C
YBA
YME
FEMALE
SPORT
KVS__TT
0.549251
0.362951
0.332216
-0.109597
0.004772
0.018624
0.195106
0.238521
0.163395
-0.128594
0.001942
-0.009101
0.903397
0.487381
0.501038
-0.090599
0.007603
0.046350
Ta có:
Giá trị trung bình của chiều
cao là: 1,612714 (m)
Giá trị trung bình của chiều
cao ba là: 1,678 (m)
Giá trị trung bình của chiều
cao mẹ là: 1,571(m)
Ta có:
VIF< 10 nên các biến độc lập có đa cộng
tuyến thấp.
Variance Inflation Factors
Date: 11/29/18 Time: 20:12
Sample: 1 140
Included observations: 140
Variable
C
YBA
YME
FEMALE
SPORT
KVS__TT
Coefficient Uncentered
Variance
VIF
0.032062
0.003958
0.007286
9.23E-05
2.05E-06
0.000197
2047.675
712.9370
1149.575
4.419312
2.192443
1.165383
Centered
VIF
NA
1.176963
1.139575
1.104828
1.223859
1.057169