5 determining risk appetite
Bạn đang xem bản rút gọn của tài liệu. Xem và tải ngay bản đầy đủ của tài liệu tại đây (1.68 MB, 7 trang )
Determining
g Risk Appetite
pp
Sim Segal, FSA, CERA, MAAA
President
SimErgy Consulting LLC
ERM Symposium
S
Session
i 5F:
5F Ri
Risk
k Aggregation
A
ti L
Leading
di tto Ri
Risk
k Appetite
A
tit
April 14, 2010
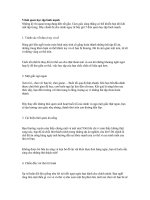
Traditional approach does not support
t
i l
l aggregation
ti
enterprise-level
Traditional Approach
NO Only financial risks
All risks quantified?
Is risk interactivity
captured?
Unifying metric?
robustly quantified
Violates “significant
digits” rule
NO Quantified on silo /
standalone basis
Correlation matrices
common
Multiple competing
O Multiple,
NO
metrics
2
Copyright © SimErgy. All rights reserved.
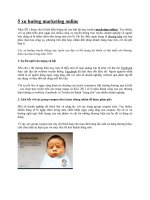
Value-Based ERM Framework
Risk Appetite
Strategy
Qualitative
Assessment
Risk
Mgmt
Tactics
ERM
Committee
Scenario
Development
Value Impact
Enterprise Risk
Exposure
24
32
22
21
17
18
5
15
26
12
3
25
34
1
16
35 27
2
31
19
28
6
23
30
13
11
4
8
20
All
Risks
14
10
9
7
Likelihood
Key Risk
Scenarios
Correlation
Likelihood
Severitty
33
29
Mostly Objective
X
Enterprise Value
FINANCIAL
Market
Credit
…
STRATEGIC
Key
Risks
Strategy
1+ events / sim
1 event / sim
Mostly Subjective
Execution
…
ERM
Model
Baseline
Value
▪ ΔValue
OPERATIONAL
HR
“Pain Point”
Likelihood
ΔValue ≤ -10%
15%
ΔValue ≤ -20%
3%
Individual Risk
Exposures
Enterprise Value Impact
IT Risk 1
Legislatiion Risk
Process
Loss of Critical EEs
…
M&A Risk
Execution Risk
International Risk 1
Loss of Keyy Supplier
pp
Loss of Key Distributor
IT Risk 2
International Risk 2
Union Negotiations
Competitor Risk 1
Consumer Relations Risk
0.0% -5.0% -10.0% -15.0% -20.0% -25.0%
Identification
Quantification
Decision-Making
Copyright © SimErgy. All rights reserved.
ILLUSTRATIVE
EXAMPLE
Likelihood
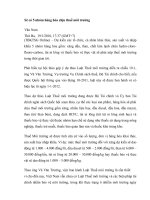
Enterprise risk exposure “pain points” are
d to
t define
d fi risk
i k appetite
tit
used
Enterprise Value
Likelihood
|
-10%
What is it
now?
What do we
want it to be?
“Pain Point”
Likelihood
Likelihood
ΔValue ≤ -10%
15%
?
ΔValue ≤ -20%
20%
3%
?
C
t exposure
Current
(calculated)
|
-20%
T
t exposure
Target
(defined by ERM
Committee)
Enterprise Value
RISK APPETITE
4
Copyright © SimErgy. All rights reserved.
Modified case study: Other key metrics
supplement
l
t enterprise
t
i value
l metrics
ti
“Pain Point”
Modified
Case
Study
Likelihood
Decrease in enterprise value of more
than
th 10%
5%
15%
Ratings downgrade – one level
7%
g short of Planned revenue
Falling
growth by more than 200 basis points
11%
Falling short of Planned earnings by
more than 2¢
per share
¢p
10%
5
Copyright © SimErgy. All rights reserved.
Value-based approach provides enterprisel
l aggregation
ti
level
Traditional Approach
NO Only financial risks
All risks quantified?
Is risk interactivity
captured?
Unifying metric?
robustly quantified
Violates “significant
digits” rule
NO Quantified on silo /
standalone basis
Correlation matrices
common
Multiple competing
O Multiple,
NO
metrics
Value-based Approach
YES All risks quantified
consistently
Apples-to-apples
math
YES Quantified on
integrated basis
Direct calculation of
interactivity
Single unifying
S Single,
YES
value metric
6
Copyright © SimErgy. All rights reserved.
Contact
Co
tact information
o at o
Sim Segal, FSA, CERA, MAAA
President
SimErgy Consulting LLC
Chrysler Building
405 Lexington Ave., 26th Flr
New York, NY 10174
(917) 699-3373 Mobile
(646) 862-6134 Office
((347)) 342-0346 Fax
www.simergy.com
7
Copyright © SimErgy. All rights reserved.