emering technology and architecture for big data analytics
Bạn đang xem bản rút gọn của tài liệu. Xem và tải ngay bản đầy đủ của tài liệu tại đây (12.35 MB, 332 trang )
Anupam Chattopadhyay
Chip Hong Chang
Hao Yu Editors
Emerging
Technology and
Architecture
for Big-data
Analytics
Emerging Technology and Architecture
for Big-data Analytics
Anupam Chattopadhyay • Chip Hong Chang
Hao Yu
Editors
Emerging Technology and
Architecture for Big-data
Analytics
123
Editors
Anupam Chattopadhyay
School of Computer Science
and Engineering, School of Physical
and Mathematical Sciences
Nanyang Technological University
Singapore
Chip Hong Chang
School of Electrical and Electronic
Engineering
Nanyang Technological University
Singapore
Hao Yu
School of Electrical and Electronic
Engineering
Nanyang Technological University
Singapore
ISBN 978-3-319-54839-5
ISBN 978-3-319-54840-1 (eBook)
DOI 10.1007/978-3-319-54840-1
Library of Congress Control Number: 2017937358
© Springer International Publishing AG 2017
This work is subject to copyright. All rights are reserved by the Publisher, whether the whole or part of
the material is concerned, specifically the rights of translation, reprinting, reuse of illustrations, recitation,
broadcasting, reproduction on microfilms or in any other physical way, and transmission or information
storage and retrieval, electronic adaptation, computer software, or by similar or dissimilar methodology
now known or hereafter developed.
The use of general descriptive names, registered names, trademarks, service marks, etc. in this publication
does not imply, even in the absence of a specific statement, that such names are exempt from the relevant
protective laws and regulations and therefore free for general use.
The publisher, the authors and the editors are safe to assume that the advice and information in this book
are believed to be true and accurate at the date of publication. Neither the publisher nor the authors or
the editors give a warranty, express or implied, with respect to the material contained herein or for any
errors or omissions that may have been made. The publisher remains neutral with regard to jurisdictional
claims in published maps and institutional affiliations.
Printed on acid-free paper
This Springer imprint is published by Springer Nature
The registered company is Springer International Publishing AG
The registered company address is: Gewerbestrasse 11, 6330 Cham, Switzerland
Preface
Everyone loves to talk about big data, of course for various reasons. We got into that
discussion when it seemed that there is a serious problem that big data is throwing
down to the system, architecture, circuit and even device specialists. The problem is
of scale, of which everyday computing experts were not really aware of. The last big
wave of computing is driven by embedded systems and all the infotainment riding
on top of that. Suddenly, it seemed that people loved to push the envelope of data
and it does not stop growing at all.
®
According to a recent estimate done by Cisco Visual Networking Index (VNI),
global IP traffic crossed the zettabyte threshold in 2016 and grows at a compound
annual growth rate of 22%. Now, zettabyte is 1018 bytes, which is something that
might not be easily appreciated. To give an everyday comparison, take this estimate.
The amount of data that is created and stored somewhere in the Internet is 70 times
that of the world’s largest library—Library of Congress in Washington DC, USA.
Big data is, therefore, an inevitable outcome of the technological progress of human
civilization. What lies beneath that humongous amount of information is, of course,
knowledge that could very much make or break business houses. No wonder that we
are now rolling out course curriculum to train data scientists, who are gearing more
than ever to look for a needle in the haystack, literally. The task is difficult, and here
enters the new breed of system designers, who might help to downsize the problem.
The designers’ perspectives that are trickling down from the big data received
considerable attention from top researchers across the world. Upfront, it is the
storage problem that had to be taken care of. Denser and faster memories are
very much needed, as ever. However, big data analytics cannot work on idle data.
Naturally, the next vision is to reexamine the existing hardware platform that
can support intensive data-oriented computing. At the same time, the analysis of
such a huge volume of data needs a scalable hardware solution for both big data
storage and processing, which is beyond the capability of pure software-based
data analytic solutions. The main bottleneck that appeared here is the same one,
known in computer architecture community for a while—memory wall. There is a
growing mismatch between the access speed and processing speed for data. This
disparity no doubt will affect the big data analytics the hardest. As such, one
v
vi
Preface
needs to redesign an energy-efficient hardware platform for future big data-driven
computing. Fortunately, there are novel and promising researches that appeared in
this direction.
A big data-driven application also requires high bandwidth with maintained
low-power density. For example, Web-searching application involves crawling,
comparing, ranking, and paging of billions of Web pages or images with extensive
memory access. The microprocessor needs to process the stored data with intensive
memory access. The present data storage and processing hardware have well-known
bandwidth wall due to limited accessing bandwidth at I/Os, but also power wall due
to large leakage power in advanced CMOS technology when holding data by charge.
As such, a design of scalable energy-efficient big data analytic hardware is a highly
challenging problem. It reinforces well-known issues, like memory and power wall
that affects the smooth downscaling of current technology nodes. As a result, big
data analytics will have to look beyond the current solutions—across architectures,
circuits, and technologies—to address all the issues satisfactorily.
In this book, we attempt to give a glimpse of the things to come. A range
of solutions are appearing that will help a scalable hardware solution based on
the emerging technology (such as nonvolatile memory device) and architecture
(such as in-memory computing) with the correspondingly well-tuned data analytics
algorithm (such as machine learning). To provide a comprehensive overview in this
book, we divided the contents into three main parts as follows:
Part I: State-of-the-Art Architectures and Automation for Data Analytics
Part II: New Approaches and Applications for Data Analytics
Part III: Emerging Technology, Circuits, and Systems for Data Analytics
As such, this book aims to provide an insight of hardware designs that capture
the most advanced technological solutions to keep pace with the growing data and
support the major developments of big data analytics in the real world. Through
this book, we tried our best to justify different perspectives in the growing research
domain. Naturally, it would not be possible without the hard work from our excellent
contributors, who are well-established researchers in their respective domains. Their
chapters, containing state-of-the-art research, provide a wonderful perspective of
how the research is evolving and what practical results are to be expected in future.
Singapore
Anupam Chattopadhyay
Chip Hong Chang
Hao Yu
Contents
Part I State-of-the-Art Architectures and Automation
for Data-Analytics
1
Scaling the Java Virtual Machine on a Many-Core System . . . . . . . . . . .
Karthik Ganesan, Yao-Min Chen, and Xiaochen Pan
2
Accelerating Data Analytics Kernels with Heterogeneous
Computing. . . . . . . . . . . . . . . . . . . . . . . . . . . . . . . . . . . . . . . . . . . . . . . . . . . . . . . . . . . . . . . . . . .
Guanwen Zhong, Alok Prakash, and Tulika Mitra
25
Least-squares-solver Based Machine Learning Accelerator
for Real-time Data Analytics in Smart Buildings . . . . . . . . . . . . . . . . . . . . . . .
Hantao Huang and Hao Yu
51
3
3
4
Compute-in-Memory Architecture for Data-Intensive Kernels . . . . . . .
Robert Karam, Somnath Paul, and Swarup Bhunia
77
5
New Solutions for Cross-Layer System-Level and High-Level
Synthesis . . . . . . . . . . . . . . . . . . . . . . . . . . . . . . . . . . . . . . . . . . . . . . . . . . . . . . . . . . . . . . . . . . . . . 103
Wei Zuo, Swathi Gurumani, Kyle Rupnow, and Deming Chen
Part II Approaches and Applications for Data Analytics
6
Side Channel Attacks and Their Low Overhead
Countermeasures on Residue Number System Multipliers . . . . . . . . . . . . 137
Gavin Xiaoxu Yao, Marc Stöttinger, Ray C.C. Cheung,
and Sorin A. Huss
7
Ultra-Low-Power Biomedical Circuit Design
and Optimization: Catching the Don’t Cares . . . . . . . . . . . . . . . . . . . . . . . . . . . 159
Xin Li, Ronald D. (Shawn) Blanton, Pulkit Grover,
and Donald E. Thomas
8
Acceleration of MapReduce Framework on a Multicore Processor . . 175
Lijun Zhou and Zhiyi Yu
vii
viii
9
Contents
Adaptive Dynamic Range Compression for Improving
Envelope-Based Speech Perception: Implications for Cochlear
Implants . . . . . . . . . . . . . . . . . . . . . . . . . . . . . . . . . . . . . . . . . . . . . . . . . . . . . . . . . . . . . . . . . . . . . 191
Ying-Hui Lai, Fei Chen, and Yu Tsao
Part III Emerging Technology, Circuits and Systems
for Data-Analytics
10
Neuromorphic Hardware Acceleration Enabled by Emerging
Technologies . . . . . . . . . . . . . . . . . . . . . . . . . . . . . . . . . . . . . . . . . . . . . . . . . . . . . . . . . . . . . . . . . 217
Zheng Li, Chenchen Liu, Hai Li, and Yiran Chen
11
Energy Efficient Spiking Neural Network Design
with RRAM Devices . . . . . . . . . . . . . . . . . . . . . . . . . . . . . . . . . . . . . . . . . . . . . . . . . . . . . . . . 245
Yu Wang, Tianqi Tang, Boxun Li, Lixue Xia, and Huazhong Yang
12
Efficient Neuromorphic Systems and Emerging Technologies:
Prospects and Perspectives . . . . . . . . . . . . . . . . . . . . . . . . . . . . . . . . . . . . . . . . . . . . . . . . 261
Abhronil Sengupta, Aayush Ankit, and Kaushik Roy
13
In-Memory Data Compression Using ReRAMs . . . . . . . . . . . . . . . . . . . . . . . . . 275
Debjyoti Bhattacharjee and Anupam Chattopadhyay
14
Big Data Management in Neural Implants: The Neuromorphic
Approach . . . . . . . . . . . . . . . . . . . . . . . . . . . . . . . . . . . . . . . . . . . . . . . . . . . . . . . . . . . . . . . . . . . . 293
Arindam Basu, Chen Yi, and Yao Enyi
15
Data Analytics in Quantum Paradigm: An Introduction . . . . . . . . . . . . . . 313
Arpita Maitra, Subhamoy Maitra, and Asim K. Pal
About the Editors
Anupam Chattopadhyay received his BE degree from Jadavpur University, India,
in 2000. He received his MSc from ALaRI, Switzerland, and PhD from RWTH
Aachen in 2002 and 2008, respectively. From 2008 to 2009, he worked as a
member of consulting staff in CoWare R&D, Noida, India. From 2010 to 2014,
he led the MPSoC Architectures Research Group in UMIC Research Cluster at
RWTH Aachen, Germany, as a junior professor. Since September 2014, he has
been appointed as an assistant professor in the School of Computer Science and
Engineering (SCSE), NTU, Singapore. He also holds adjunct appointment at the
School of Physical and Mathematical Sciences, NTU, Singapore.
During his PhD, he worked on automatic RTL generation from the architecture description language LISA, which was commercialized later by a leading
EDA vendor. He developed several high-level optimizations and verification flow
for embedded processors. In his doctoral thesis, he proposed a language-based
modeling, exploration, and implementation framework for partially reconfigurable
processors, for which he received outstanding dissertation award from RWTH
Aachen, Germany.
Since 2010, Anupam has mentored more than ten PhD students and numerous master’s/bachelor’s thesis students and several short-term internship projects.
Together with his doctoral students, he proposed domain-specific high-level synthesis for cryptography, high-level reliability estimation flows, generalization of classic
linear algebra kernels, and a novel multilayered coarse-grained reconfigurable
architecture. In these areas, he published as a (co)author over 100 conference/journal
papers, several book chapters for leading press, e.g., Springer, CRC, and Morgan
Kaufmann, and a book with Springer. Anupam served in several TPCs of top
conferences like ACM/IEEE DATE, ASP-DAC, VLSI, VLSI-SoC, and ASAP. He
regularly reviews journal/conference articles for ACM/IEEE DAC, ICCAD, IEEE
TVLSI, IEEE TCAD, IEEE TC, ACM JETC, and ACM TEC; he also reviewed
book proposal from Elsevier and presented multiple invited seminars/tutorials in
prestigious venues. He is a member of ACM and a senior member of IEEE.
ix
x
About the Editors
Chip Hong Chang received his BEng (Hons) degree from the National University
of Singapore in 1989 and his MEng and PhD degrees from Nanyang Technological
University (NTU) of Singapore, in 1993 and 1998, respectively. He served as
a technical consultant in the industry prior to joining the School of Electrical
and Electronic Engineering (EEE), NTU, in 1999, where he is currently a tenure
associate professor. He holds joint appointments with the university as assistant
chair of School of EEE from June 2008 to May 2014, deputy director of the 100strong Center for High Performance Embedded Systems from February 2000 to
December 2011, and program director of the Center for Integrated Circuits and
Systems from April 2003 to December 2009. He has coedited four books, published
10 book chapters, 87 international journal papers (of which 54 are published in the
IEEE Transactions), and 158 refereed international conference papers. He has been
well recognized for his research contributions in hardware security and trustable
computing, low-power and fault-tolerant computing, residue number systems, and
digital filter design. He mentored more than 20 PhD students, more than 10 MEng
and MSc research students, and numerous undergraduate student projects.
Dr. Chang had been an associate editor for the IEEE Transactions on Circuits and
Systems I from January 2010 to December 2012 and has served IEEE Transactions
on Very Large Scale Integration (VLSI) Systems since 2011, IEEE Access since
March 2013, IEEE Transactions on Computer-Aided Design of Integrated Circuits
and Systems since 2016, IEEE Transactions on Information Forensic and Security
since 2016, Springer Journal of Hardware and System Security since 2016, and
Microelectronics Journal since May 2014. He had been an editorial advisory board
member of the Open Electrical and Electronic Engineering Journal since 2007 and
an editorial board member of the Journal of Electrical and Computer Engineering
since 2008. He also served Integration, the VLSI Journal from 2013 to 2015.
He also guest-edited several journal special issues and served in more than 50
international conferences (mostly IEEE) as adviser, general chair, general vice chair,
and technical program cochair and as member of technical program committee.
He is a member of the IEEE Circuits and Systems Society VLSI Systems and
Applications Technical Committee, a senior member of the IEEE, and a fellow of
the IET.
Dr. Hao Yu obtained his BS degree from Fudan University (Shanghai China) in
1999, with 4-year first-prize Guanghua scholarship (top 2) and 1-year Samsung
scholarship for the outstanding student in science and engineering (top 1). After
being selected by mini-CUSPEA program, he spent some time in New York University and obtained MS/PhD degrees both from electrical engineering department
at UCLA in 2007, with major in integrated circuit and embedded computing. He
has been a senior research staff at Berkeley Design Automation (BDA) since 2006,
one of top 100 start-ups selected by Red Herring at Silicon Valley. Since October
2009, he has been an assistant professor at the School of Electrical and Electronic
Engineering and also an area director of VIRTUS/VALENS Centre of Excellence,
Nanyang Technological University (NTU), Singapore.
About the Editors
xi
Dr. Yu has 165 peer-reviewed and referred publications [conference (112) and
journal (53)], 4 books, 5 book chapters, 1 best paper award in ACM Transactions
on Design Automation of Electronic Systems (TODAES), 3 best paper award
nominations (DAC’06, ICCAD’06, ASP-DAC’12), 3 student paper competition
finalists (SiRF’13, RFIC’13, IMS’15), 1 keynote paper, 1 inventor award from
semiconductor research cooperation (SRC), and 7 patent applications in pending.
He is the associate editor of Journal of Low Power Electronics; reviewer of IEEE
TMTT, TNANO, TCAD, TCAS-I/II, TVLSI, ACM-TODAEs, and VLSI Integration; and a technical program committee member of several conferences (DAC’15,
ICCAD’10-12, ISLPED’13-15, A-SSCC’13-15, ICCD’11-13, ASP-DAC’11-13’15,
ISCAS’10-13, IWS’13-15, NANOARCH’12-14, ISQED’09). His main research
interest is about the emerging technology and architecture for big data computing
and communication such as 3D-IC, THz communication, and nonvolatile memory
with multimillion government and industry funding. His industry work at BDA is
also recognized with an EDN magazine innovation award and multimillion venture
capital funding. He is a senior member of IEEE and member of ACM.
Part I
State-of-the-Art Architectures and
Automation for Data-Analytics
Chapter 1
Scaling the Java Virtual Machine
on a Many-Core System
Karthik Ganesan, Yao-Min Chen, and Xiaochen Pan
1.1 Introduction
Today, many big data applications use the Java SE platform [13], also called
Java Virtual Machine (JVM), as the run-time environment. Examples of such
applications include Hadoop Map Reduce [1], Apache Spark [3], and several graph
processing platforms [2, 11]. In this chapter, we call these applications the JVM
applications. Such applications can benefit from modern multicore servers with
large memory capacity and the memory bandwidth needed to access it. However,
with the enormous amount of data to process, it is still a challenging mission for
the JVM platform to scale well with respect to the needs of big data applications.
Since the JVM is a multithreaded application, one needs to ensure that the JVM
performance can scale well with the number of threads. Therefore, it is important to
understand and improve performance and scalability of JVM applications on these
multicore systems.
To be able to scale JVM applications most efficiently, the JVM and the various
libraries must be scalable across multiple cores/processors and be capable of
handling heap sizes that can potentially run into a few hundred gigabytes for some
applications. While such scaling can be achieved by scaling-out (multiple JVMs)
or scaling-up (single JVM), each approach has its own advantages, disadvantages,
and performance implications. Scaling-up, also known as vertical scaling, can be
very challenging compared to scaling-out (also known as horizontal scaling), but
also has a great potential to be resource efficient and opens up the possibility
K. Ganesan
Oracle Corporation, 5300 Riata Park Court Building A, Austin, TX 78727, USA
e-mail:
Y.-M. Chen ( ) • X. Pan
Oracle Corporation, 4180 Network Circle, Santa Clara, CA 95054, USA
e-mail: ;
© Springer International Publishing AG 2017
A. Chattopadhyay et al. (eds.), Emerging Technology and Architecture
for Big-data Analytics, DOI 10.1007/978-3-319-54840-1_1
3
4
K. Ganesan et al.
for features like multi-tenancy. If done correctly, scaling-up usually can achieve
higher CPU utilization, putting the servers operating in a more resource and energy
efficient state. In this work, we restrict ourselves to the challenges of scaling-up on
enterprise-grade systems to provide a focused scope. We elaborate on the various
performance bottlenecks that ensue when we try to scale up a single JVM to multiple
cores/processors, discuss the potential performance degradation that can come out
of these bottlenecks, provide solutions to alleviate these bottlenecks, and evaluate
their effectiveness using a representative Java workload.
To facilitate our performance study we have chosen a business analytics workload written in the Java language because Java is one of the most popular
programming languages with many existing applications built on it. Optimizing
JVM for a representative Java workload would benefit many JVM applications
running on the same platform. Towards this purpose, we have selected the LArge
Memory Business Data Analytics (LAMBDA) workload. It is derived from the
SPECjbb2013 benchmark,1;2 developed by Standard Performance Evaluation Corporation (SPEC) to measure Java server performance based on the latest features
of Java [15]. It is a server side benchmark that models a world-wide supermarket
company with multiple point-of-sale stations, multiple suppliers, and a headquarter
office which manages customer data. The workload stores all its retail business data
in memory (Java heap) without interacting with an external database that stores data
on disks. For our study we modify the benchmark in such a way as to scale to very
large Java heaps (hundreds of GBs). We condition its run parameter setting so that
it will not suffer from an abnormal scaling issue due to inventory depletion.
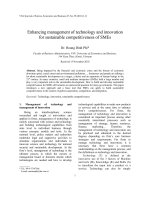
As an example, Fig. 1.1 shows the throughput performance scaling on our
workload as we increase the number of SPARC T5 CPU cores from one to 16.3 By
Throughput Scaling over 16 Cores
18
16
14
12
10
8
6
4
2
0
1
2
3
4
5
6
7
8
9
10
Number of cores
Throughput scaling factor (measured)
11
12
13
14
15
Throughput scaling factor (perfect scaling)
Fig. 1.1 Single JVM scaling on a SPARC T5 server, running the LAMBDA workload
1
The use of SPECjbb2013 benchmark conforms to SPEC Fair Use Rule [16] for research use.
The SPECjbb2013 benchmark has been retired by SPEC.
3
Experimental setup for this study is described in Sect. 1.2.3.
2
16
1 Scaling the Java Virtual Machine on a Many-Core System
5
Throughput Scaling over 8 Sockets
10
8
6
4
2
0
1
2
3
4
5
Number of sockets
Throught scaling factor (measured)
6
7
8
Throughput scaling factor (perfect scaling)
Fig. 1.2 Single JVM scaling on a SPARC M6 server with JDK8 Build 95
contrast, the top (“perfect scaling”) curve shows the ideal case where the throughput
increases linearly with the number of cores. In reality, there is likely certain system
level, OS, Java VM, or application bottleneck to prevent the applications from
scaling linearly. And quite often it is a combination of multiple factors that causes
the scaling to be non-linear. The main goal of the work described in this chapter is
to facilitate application scaling to be as close to linear as possible.
As an example of sub-optimal scaling, Fig. 1.2 shows the throughput performance scaling on our workload as we increase the number of SPARC M6 CPU
nsockets from one to eight.4 There are eight processors (“sockets”) on an M6-8
server, and we can run the workload subject to using only the first N sockets. By
contrast, the top (“perfect scaling”) curve shows the ideal case where the throughput
increases linearly with the number of sockets. Below, we discuss briefly the common
factors that lead to sub-optimal scaling. We will expand on the key ideas later in this
chapter.
1. Sharing of data objects. When shared objects that are rarely written to are
cached locally, they have the potential to reduce space requirements and increase
efficiency. But, the same shared objects can become a bottleneck when being
frequently written to, incurring remote memory access latency in the order of
hundreds of CPU cycles. Here, a remote memory access can mean accessing the
memory not affined to the local CPU, as in a Non-Uniform Memory Access
(NUMA) system [5], or accessing a cache that is not affined to the local
core, in both cases resulting in a migratory data access pattern [8]. Localized
implementations of such shared data objects have proven to be very helpful in
improving scalability. A case study that we use to explain this is the concurrent
hash map initialization that uses a shared random seed to randomize the layout
of hash maps. This shared random seed object causes major synchronization
overhead when scaling an application like LAMBDA which creates many
transient hash maps.
4
Experimental setup for this study is described in Sect. 1.2.3.
6
K. Ganesan et al.
2. Application and system software locks. On large systems with many cores, locks
in both user code and system libraries for serialized implementations can be
equally lethal in disrupting application scaling. Even standard system calls like
malloc in libc library tend to have serial portions which are protected by perprocess locks. When the same system call is invoked concurrently by multiple
threads of same process on a many-core system, these locks around serial portions of implementation become a critical bottleneck. Special implementations of
memory allocator libraries like MT hot allocators [18] are available to alleviate
such bottlenecks.
3. Concurrency framework. Another major challenge involved in scaling is due
to inefficient implementations of concurrency frameworks and collection data
structures (e.g., concurrent hash maps) using low level Java concurrency control
constructs. Utilizing concurrency utilities like JSR166 [10] that provide high
quality scalable implementations of concurrent collections and frameworks has a
significant potential to improve scalability of applications. One such example is
performance improvement of 57% for a workload like LAMBDA derived out of
a standard benchmark when using JSR166.
4. Garbage collection. As a many-core system is often provisioned with a proportionally large amount of memory, another major challenge in scaling a single
JVM on a large enterprise system involves efficiently scaling the Garbage
Collection (GC) algorithm to handle huge heap sizes. From our experience,
garbage collection pause times (stop-the-world young generation collections) can
have a significant effect on the response time of application transactions. These
pause times typically tend to be proportional to the nursery size of the Java
heap. To reduce the pause times, one solution is to eliminate serial portions of
GC phases, parallelizing them to remove such bottlenecks. One such case study
includes improvements to the G1 GC [6] to handle large heaps and a parallelized
implementation of “Free Cset” phase of G1, which has the potential to improve
the throughput and response time on a large SPARC system.
5. NUMA. The time spent collecting garbage can be compounded due to remote
memory accesses on a NUMA based system if the GC algorithm is oblivious
to the NUMA characteristics of the system. Within a processor, some cache
memories closest to the core can have lower memory access latencies compared
to others and similarly across processors of a large enterprise system, some
memory banks that are closest to the processor can have lower access latencies
compared to remote memory banks. Thus, incorporating the NUMA awareness
into the GC algorithm can potentially improve scalability. Most of the scaling
bottlenecks that arise out of locks on a large system also tend to become worse
on NUMA systems as most of the memory accesses to lock variables end up
being remote memory accesses.
The different scalability optimizations discussed in this chapter are accomplished
by improving the system software like the Operating System or the Java Virtual
Machine instead of changing the application code. The rest of the chapter is
1 Scaling the Java Virtual Machine on a Many-Core System
7
organized as follows: Sect. 1.2 provides the background including the methodologies and tools used in the study and the experimental setup. Section 1.3 addresses
the sharing of data objects. Section 1.4 describes the scaling of memory allocators.
Section 1.5 expounds on the effective usage of concurrency API. Section 1.6
elaborates on scalable Garbage Collection. Section 1.7 discusses scalability issues
in NUMA systems and Sect. 1.8 concludes with future directions.
1.2 Background
The scaling study is often an iterative process as shown in Fig. 1.3. Each iteration
consists of four phases: workload characterization, bottleneck identification, performance optimization, and performance evaluation. The goal of each iteration is
to remove one or more performance bottlenecks to improve performance. It is an
iterative process because a bottleneck may hide other performance issues. When
the bottleneck is removed, performance scaling may still be limited by another
bottleneck or improvement opportunities which were previously overshadowed by
the removed bottleneck.
1. Workload characterization. Each iteration starts with characterization using
a representative workload. Section 1.2.1 describes selecting a representative
workload for this purpose. During workload characterization, performance tools
are used in monitoring and capturing key run-time status information and
statistics. Performance tools will be described in more detail in Sect. 1.2.2. The
result of the characterization is a collection of profiles that can be used in the
bottleneck identification phase.
2. Bottleneck identification. This phase typically involves modeling, hypothesis
testing, and empirical analysis. Here, a bottleneck refers to the cause, or limiting
factor, for sub-optimal scaling. The bottleneck often points to, but is not limited
to, inefficient process, thread or task synchronization, an inferior algorithm or
sub-optimal design and code implementation.
3. Performance optimization. Once a bottleneck is identified in the previous phase,
in the current phase we try to work out an alternative design or implementation to
alleviate the bottleneck. Several possible implementations may be proposed and
a comparative study can be conducted to select the best alternative. This phase
itself can be an iterative process where several alternatives are evaluated either
through analysis or through actual prototyping and subsequent testing.
Apps
Workload
Characterizat¶on
BoƩleneck
Ident¶f¶cat¶on
Performance
Opt¶mizat¶on
Performance
Evaluat¶on
Opt¶mized
Performance
Fig. 1.3 Iterative process for performance scaling: (1) workload characterization, (2) bottleneck
identification, (3) performance optimization, and (4) performance evaluation
8
K. Ganesan et al.
4. Performance evaluation. With the implementation from the performance optimization work in the previous phase, we evaluate whether the performance
scaling goal is achieved. If the goal is not yet reached even with the current
optimization, we go back to the workload characterization phase and start another
iteration.
At each iteration, Amdahl’s law [9] is put to practice in the following sense.
The goal of many-core scaling is to minimize the serial portion of the execution
and maximize the degree of parallelism (DOP) whenever parallel execution is
possible. For applications running on enterprise servers, the problem can be solved
by resolving issues in the hardware and the software levels. At the hardware level,
multiple hardware threads can share an execution pipeline and when a thread is
stalled from loading data from memory, other threads can proceed with useful
instruction execution in the pipeline. Similarly, at the software level, multiple
software threads are mapped to these hardware threads by the operating system in a
time-shared fashion. To achieve maximum efficiency, sufficient number of software
threads or processes are needed to keep feeding sequences of instructions to ensure
that the processing pipelines are busy. A software thread or process being blocked
(such as when waiting for a lock) can lead to reduction in parallelism. Similarly,
shared hardware resources can potentially reduce parallelism in execution due to
hardware constraints. While the problem, as defined above, consists of softwarelevel and hardware-level issues, in this chapter we focus on the software-level issues
and consider the hardware micro-architecture as a given constraint to our solution
space.
The iterative process continues until the performance scaling goal is reached or
adjusted to reflect what is actually feasible.
1.2.1 Workload Selection
In order to expose effectively the scaling bottlenecks of Java libraries and the JVM,
one needs to use a Java workload that can scale to multiple processors and large
heap sizes from within a single JVM without any inherent scaling problems in the
application design. It is also desirable to use a workload that is sensitive to GC
pause times as the garbage collector is one of the components that is most difficult
to scale when it comes to using large heap sizes and multiple processors. We have
found the LAMBDA workload quite suitable for this investigation. The workload
implements a usage model based on a world-wide supermarket company with an
IT infrastructure that handles a mix of point-of-sale requests, online purchases,
and data-mining operations. It exercises modern Java features and other important
performance elements, including the latest data formats (XML), communication
using compression, and messaging with security. It utilizes features such as the
fork-join pool framework and concurrent hash maps, and is very effective in
exercising JVM components such as Garbage Collector by tracking response times
as small as 10 ms in granularity. It also provides support for virtualization and cloud
environments.
1 Scaling the Java Virtual Machine on a Many-Core System
9
The workload is designed to be inherently scalable, both horizontally and
vertically using the run modes called multi-JVM and composite modes respectively.
It contains various aspects of e-commerce software, yet no database system is
used. As a result, the benchmark is very easy to install and use. The workload
produces two final performance metrics: maximum throughput (operations per
second) and weighted throughput (operations per second) under response time
constraint. Maximum throughput is defined as the maximum achievable injection
rate on the System under Test (SUT) until it becomes unsettled. Similarly weighted
throughput is defined as the geometric mean of maximum achievable Injection Rates
(IR) for a set of response time Service Level Agreements (SLAs) of 10, 50, 100,
200, and 500 ms using the 99th percentile data. The maximum throughput metric is a
good measurement of maximum processing capacity, while the weighted throughput
gives good indication of the responsiveness of the application running on a server.
1.2.2 Performance Analysis Tools
To study application performance scaling, performance observability tools are
needed to illustrate what happens inside a system when running a workload. The
performance tools used for our study include Java GC logs, Solaris operating
system utilities including cpustat, prstat, mpstat, lockstat, and the Solaris Studio
Performance Analyzer.
1. GC logs. The logs are very vital in understanding the time spent in garbage
collection, allowing us to specify correctly JVM settings targeting the most
efficient way to run the workload achieving the least overhead from GC pauses
when scaling to multiple cores/processors. An example segment is shown in
Fig. 1.4, for the G1 GC [6]. There, we see the breakdown of a stop-the-world
(STW) GC event that lasts 0.369 s. The total pause time is divided into four parts:
Parallel Time, Code Root Fixup, Clear, and Other. The parallel time represents
the time spent in the parallel processing by the 25 GC worker threads. The other
parts comprise the serial phase of the STW pause. As seen in the example,
Parallel Time and Other are further divided into subcomponents, for which
statistics are reported. At the end of the log, we also see the heap occupancy
changes from 50.2 GB to 3223 MB. The last line describes that the total user
time spent by all GC threads consists of 8.10 s in user land and 0.01 s in the
system (kernel), while the elapsed real time is 0.37 s.
2. cpustat. The Solaris cpustat [12] utility on SPARC uses hardware counters to
provide hardware level profiling information such as cache miss rates, accesses
to local/remote memory, and memory bandwidth used. These statistics are
invaluable in identifying bottlenecks in the system and ensure that we use the
system to the fullest potential. Cpustat provides critical information such as
system utilization in terms of cycles per instruction (CPI) and its reciprocal
instructions per cycle (IPC) statistics, instruction mix, branch prediction related
10
K. Ganesan et al.
Fig. 1.4 Example of a segment in the Garbage Collector (GC) log showing (1) total GC pause
time; (2) time spent in the parallel phase and the number GC worker threads; (3) amounts of time
spent in the Code Root Fixup and Clear CT, respectively; (4) amount of time spent in the other part
of serial phase; and (5) reduction in heap occupancy due to the GC
Fig. 1.5 An example of cpustat output that shows utilization related statistics. In the figure, we
only show the System Utilization section, where CPI, IPC, and Core Utilization are reported
statistics, cache and TLB miss rates, and other memory hierarchy related statistics. Figure 1.5 shows a partial cpustat output that provides system utilization
related statistics.
3. prstat and mpstat. Solaris prstat and mpstat utilities [12] provide resource
utilization and context switch information dynamically to identify phase behavior
and time spent in system calls in the workload. This information is very useful
in finding bottlenecks in the operating system. Figures 1.6 and 1.7 are examples
of a prstat and mpstat output, respectively. The prstat utility looks at resource
usage from the process point of view. In Fig. 1.6, it shows that at time instant
2:13:11 the JVM process, with process ID 1472, uses 63 GB of memory, 90%
of CPU, and 799 threads while running the workload. However, at time 2:24:33,
1 Scaling the Java Virtual Machine on a Many-Core System
11
Fig. 1.6 An example of prstat output that shows dynamic process resource usage information. In
(a), the JVM process (PID 1472) is on cpu4 and uses 90% of the CPU. By contrast, in (b) the
process goes into GC and uses 5.8% of cpu2
Fig. 1.7 An example of mpstat output. In (a) we show the dynamic system activities when the
processor set (ID 0) is busy. In (b) we show the activities when the processor set is fairly idle
the same process has gone into the garbage collection phase, resulting in CPU
usage dropped to 5.8% and the number of threads reduced to 475. By contrast,
rather than looking at a process, mpstat takes the view from a vCPU (hardware
thread) or a set of vCPUs. In Fig. 1.7 the dynamic resource utilization and
system activities of a “processor set” is shown. The processor set, with ID
0, consists of 64 vCPUs. The statistics are taken during a sampling interval,
typically one second or 5 s. One can contrast the difference in system activities
and resource usage taken during a normal running phase (Fig. 1.7a) and during a
GC phase (Fig. 1.7b).
4. lockstat and plockstat. Lockstat [12] helps us to identify the time spent spinning
on system locks and plockstat [12] provides the same information regarding
user locks enabling us to understand the scaling overhead that is coming out of
spinning on locks. The plockstat utility provides information in three categories:
mutex block, mutex spin, and mutex unsuccessful spin. For each category it lists
the time (in nanoseconds) in descending order of the locks. Therefore, on the
top of the list is the lock that consumes the most time. Figure 1.8 shows an
example of plockstat output, where we only extract the lock on the top from
each category. For the mutex block category, the lock at address 0x10015ef00
was called 19 times during the capturing interval (1 s for this example). It was
12
K. Ganesan et al.
Fig. 1.8 An example of plockstat output, where we show the statistics from three types of locks
called by “libumem.so.1‘umem_cache_alloc+0x50” and consumed 66258 ns of
CPU time. The locks in the other categories, mutex spin and mutex unsuccessful
spin, can be understood similarly.
5. Solaris studio performance analyzer. Lastly, Solaris Studio Performance Analyzer [14] provides insights into program execution by showing the most
frequently executed functions, caller-callee information along with a timeline
view of the dynamic events in the execution. This information about the code
is also augmented with hardware counter based profiling information helping
to identify bottlenecks in the code. In Fig. 1.9, we show a profile taken while
running the LAMBDA workload. From the profile we can identify hot methods
that use a lot of CPU time. The hot methods can be further analyzed using the
call tree graph, such as the example shown in Fig. 1.10.
1.2.3 Experimental Setup
Two hardware platforms are used in our study. The first is a two-socket system
based on the SPARC T5 [7] processor (Fig. 1.11), the fifth generation multicore
microprocessor of Oracle’s SPARC T-Series family. The processor has a clock
frequency of 3.6 GHz, 8 MB of shared last level (L3) cache, and 16 cores where
each core has eight hardware threads, providing a total of 128 hardware threads,
also known as virtual CPUs (vCPUs), per processor. The SPARC T5-2 system used
in our study has two SPARC T5 processors, giving a total of 256 vCPUs available
for application use. The SPARC T5-2 server runs Solaris 11 as its operating system.
Solaris provides a configuration utility (“psrset”) to condition an application to use
1 Scaling the Java Virtual Machine on a Many-Core System
13
Fig. 1.9 An example of Oracle Solaris Studio Performer Analyzer profile, where we show the
methods ranked by exclusive cpu time
Fig. 1.10 An example of Oracle Solaris Studio Performer Analyzer call tree graph
only a subset of vCPUs. Our experimental setup includes running the LAMBDA
workload on configurations of 1 core (8 vCPUs), 2 cores (16 vCPUs), 4 cores (32
vCPUs), 8 cores (64 vCPUs), 1 socket (16 cores/128 vCPUs), and 2 sockets (32
cores/256 vCPUs).
The second hardware platform is an eight-socket SPARC M6-8 system that is
based on the SPARC M6 [17] processor (Fig. 1.12). The SPARC M6 processor has
a clock frequency of 3.6 GHz, 48 MB of L3 cache, and 12 cores. Same as SPARC
T5, each M6 core has eight hardware threads. This gives a total of 96 vCPUs per
14
K. Ganesan et al.
Fig. 1.11 SPARC T5
processor [7]
Fig. 1.12 SPARC M6 processor [17]
processor socket, for a total of 768 vCPUs for the full M6-8 system. The SPARC
M6-8 server runs Solaris 11. Our setup includes running the LAMBDA workload on
configurations of 1 socket (12 cores/96 vCPUs), 2 sockets (24 cores/192 vCPUs), 4
sockets (48 cores/384 vCPUs), and 8 sockets (96 cores/384 vCPUs).
Several JDK versions have been used in the study. We will call out the specific
versions in the sections to follow.
1 Scaling the Java Virtual Machine on a Many-Core System
15
1.3 Thread-Local Data Objects
A globally shared data object when protected by locks on the critical path of
application leads to the serial part of Amdahl’s law. This causes less than perfect
scaling. To improve degree of parallelism, the strategy is to “unshare” such data
objects that cannot be efficiently shared. Whenever possible, we try to use data
objects that are local to the thread, and not shared with other threads. This can be
more subtle than it sounds, as the following case study demonstrates.
Hash map is a frequently used data structure in Java programming. To minimize
the probability of collision in hashing, JDK 7u6 introduced an alternative hash map
implementation that adds randomness in the initiation of each HashMap object.
More precisely, the alternative hashing introduced in JDK 7u6 includes a feature
to randomize the layout of individual map instances. This is accomplished by
generating a random mask value per hash map. However, the implementation in JDK
7u6 uses a shared random seed to randomize the layout of hash maps. This shared
random seed object causes significant synchronization overhead when scaling an
application like LAMBDA which creates many transient hash maps during the run.
Using Solaris Studio Analyzer profiles, we observed that for an experiment run
with 48 cores of M6, CPUs were saturated and 97% of CPU time was spent in the
java.util.Random.nextInt() function achieving less than 15% of the system’s projected performance. The problem came out of java.util.Random.nextInt() updating
global state, causing synchronization overhead as shown in Fig. 1.13.
Fig. 1.13 Scaling bottleneck due to java.util.Random.nextInt