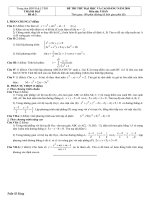
task 03 line chart
Bạn đang xem bản rút gọn của tài liệu. Xem và tải ngay bản đầy đủ của tài liệu tại đây (37.25 KB, 1 trang )
The shown line graph provides the ratio of four different modern technological device
in home at UK between 1996 and 2003. As is presented, CD player is the most
popular during the period time surveyed.
Now, turning to the details, the CD accounted for 60 percents in 1996, keeping the fist
position. However, after 8 years, the data about user numbers just lightly increased by
20%. The same as CD growth, the amounts of computer just climbed roughly 30%,
from 29% in 1996 to 58% in the last period. However, just standing at around 20%,
the percentage of cell phone had a doubling in boom up to 45% in 1999. Next, it kept
a levelling of in 2000 and coutinueing rise to 70% in the year 2003. Finally, although
internet was borned latest within 4 equipments but it seem to be the quickest trend
with 10% in 1998, next 05 years the internet Access sharply uplifted until 40% in
2003.