Macroeconomics 2nd edition by krugman and wells solution manual
Bạn đang xem bản rút gọn của tài liệu. Xem và tải ngay bản đầy đủ của tài liệu tại đây (3.59 MB, 69 trang )
Macroeconomics 2nd edition by Krugman and Wells
Solution Manual
Link full download solution manual: />
Chapter 2 Trade-offs and Trade
1.
Two important industries on the island of Bermuda are fishing and tourism. According to data
from the Food and Agriculture Organization of the United Nations and the Bermuda
Department of Statistics, in the year 2009 the 306 registered fish-ers in Bermuda caught 387
tonnes of marine fish. And the 2719 people employed by hotels produced 554 400 hotel stays
(measured by the number of visitor arriv-als). Suppose that this production point is efficient in
production. Assume also that the opportunity cost of 1 additional tonne of fish is 2000 hotel
stays and that this opportunity cost is constant (the opportunity cost does not change).
a. If all 306 registered fishers were to be employed by hotels (in addition to the 2719 peo-ple
already working in hotels), how many hotel stays could Bermuda produce?
b. If all 2719 hotel employees were to become fishers (in addition to the 306 fishers already
working in the fishing industry), how many tonnes of fish could Bermuda produce?
c. Draw a production possibility frontier for Bermuda, with fish on the horizontal axis and
hotel stays on the vertical axis, and label Bermuda‘s actual production point for the year
2009.
Solution1.
a.Forgoingthe production of 1 tonne of fish allows Bermuda to produce
2000 addi-tional hotel stays. Therefore, forgoing the production of 387 tonnes of fish allows
Bermuda to produce 2000 × 387 = 774 000 additional hotel stays. If all fishers worked in
the hotel industry, Bermuda could produce
554 000 + 774 000 = 1 328 400 hotel stays.
b. Forgoing the production of 2000 hotel stays allows Bermuda to produce 1 addi-tional
tonne of fish, so giving up 554 400 hotel stays allows Bermuda to produce 554 400/2000 =
277.2 additional tonnes of fish. If all hotel employees worked in the fishing industry,
Bermuda could produce 387 + 277.2 = 664.2 tonnes of fish.
c. The accompanying diagram shows the production possibility frontier for Bermuda. Note that
it is a straight line because the opportunity cost is constant. Point A is Bermuda‘s actual
production point.
Quantity of
hotel stays
(thousands)
1328.4
A
554.4
Bermuda
PPF
0
387
664.2
Quantity of fish (tonnes)
S-11
S-12
CHAPTER 2
ECONOMICMODELS:TRADE-OFFSANDTRADE
2.
Atlantis is a small, isolated island in the South Atlantic. The inhabitants grow pota-toes and
catch fish. The accompanying table shows the maximum annual output combinations of
potatoes and fish that can be produced. Obviously, given their lim-ited resources and available
technology, as they use more of their resources for potato production, there are fewer resources
available for catching fish.
Maximum annual
output options
Quantity of potatoes
(kilograms)
Quantity of fish
(kilograms)
A
1000
B
800
300
C
600
500
D
400
600
E
200
650
F
0
675
0
a. Draw a production possibility frontier with potatoes on the horizontal axis and fish on
the vertical axis illustrating these options, showing points A–F.
b. Can Atlantis produce 500 kg of fish and 800 kg of potatoes? Explain. Where would
this point lie relative to the production possibility frontier?
c. What is the opportunity cost of increasing the annual output of potatoes from 600 to 800
kg?
d. What is the opportunity cost of increasing the annual output of potatoes from 200 to 400
kg?
e. Can you explain why the answers to parts (c) and (d) are not the same? What does this
imply about the slope of the production possibility frontier?
Solution2.
a.Theaccompanying diagram shows the production possibility frontier for Atlantis.
Quantity
of fish
(kg)
675 F
E
650
D
600
500
C
G
B
300
Atlantis
PPF
A
0
200
400
600
800
1000
Quantity of potatoes (kg)
b. No, Atlantis cannot produce 500 kg of fish and 800 kg of potatoes. If it produces 500 kg of
fish, the most potatoes it can produce is 600 kg. This point would lie outside the production
possibility frontier, at point G on the diagram.
c. The opportunity cost of increasing output from 600 to 800 kg of potatoes is
200 kg of fish. If Atlantis increases output from 600 to 800 kg of potatoes, it has to cut fish
production from 500 kg to 300 kg, that is, by 200 kg.
CHAPTER 2
ECONOMICMODELS:TRADE-OFFSANDTRADE
S-13
d. The opportunity cost of increasing output from 200 to 400 kg of potatoes is 50 kg of fish. If
Atlantis increases output from 200 to 400 kg of potatoes, it has to cut fish production from
650 kg to 600 kg, that is, by 50 kg.
e. The answers to parts (c) and (d) imply that the more potatoes Atlantis produces, the higher
the opportunity cost becomes. For instance, as you grow more and more potatoes, you have
to use less and less suitable land to do so. As a result, you have to divert increasingly more
resources away from fishing as you grow more potatoes, meaning that you can produce
increasingly less fish. This implies, of course, that the production possibility frontier
becomes steeper the farther you move along it to the right; that is, the production possibility
frontier is bowed out. (Mathematicians call this shape concave.)
3.
According to Statistics Canada, 11.0 million hectares of land in Canada were used for wheat
or corn farming in 2012. Of those 11.0 million hectares, farmers used
9.6 million hectares to grow 999.62 million bushels of wheat and 1.4 million hect-ares of land
to grow 514.15 million bushels of corn. Suppose that Canada‘s wheat farming and corn
farming are efficient in production. At that production point, the opportunity cost of producing
1 additional bushel of wheat is 1.7 fewer bushels of corn. However, because farmers have
increasing opportunity costs at higher levels of wheat production, additional bushels of wheat
have an opportunity cost greater than 1.7 bushels of corn. For each of the following production
points, decide whether that production point is (i) feasible and efficient in production, (ii)
feasible but not efficient in production, (iii) not feasible, or (iv) unclear as to whether or not it
is feasible.
a. Farmers use 1.6 million hectares of land to produce 180 million bushels of wheat, and they
use 2.4 million hectares of land to produce 900 million bushels of corn. The remaining 7.0
million hectares are left unused.
b. From their original production point, farmers transfer 1.6 million hectares of land from corn
to wheat production. They now produce 1009.62 million of bushels of wheat and 497.15
million bushels of corn.
c. Farmers reduce their production of wheat to 950 million bushels and increase their
production of corn to 588.58 million bushels. Along the production possibil-ity frontier, the
opportunity cost of going from 514.15 million bushels of corn to 588.58 million bushels of
corn is 0.666 bushels of wheat per bushel of corn.
Solution3.
a.Ifresourcesare left unused, then this combination of production must lie
inside the production possibilities frontier. So it is feasible, but it cannot be efficient.
b. The transfer of resources has increased wheat production by 10 million bushels and reduced
corn production by 17 million bushels. This is the opportunity cost given in the question, so
production is moving to another point on the production possibilities frontier. Therefore, it is
both feasible and efficient.
c. The increase in the production of corn led to a decline in wheat production of
49.62 million bushels (999.62 – 950). If the opportunity cost is 0.666 bushels of wheat per
bushel of corn, then we should get about 75.5 million more bushels of corn, which is the
extra amount of corn produced. So the economy is again mov-ing along its production
possibilities frontier and the production point is feasible and efficient.
S-14
CHAPTER 2
ECONOMICMODELS:TRADE-OFFSANDTRADE
4.
In the ancient country of Roma, only two goods, spaghetti and meatballs, are pro-duced. There
are two tribes in Roma, the Tivoli and the Frivoli. By themselves, the Tivoli each month can
produce either 30 kg of spaghetti and no meatballs, or 50 kg of meatballs and no spaghetti, or
any combination in between. The Frivoli, by them-selves, each month can produce 40 kg of
spaghetti and no meatballs, or 30 kg of meatballs and no spaghetti, or any combination in
between.
a. Assume that all production possibility frontiers are straight lines. Draw one diagram
showing the monthly production possibility frontier for the Tivoli and another showing the
monthly production possibility frontier for the Frivoli. Show how you calculated them.
b. Which tribe has the comparative advantage in spaghetti production? In meatball
production?
In A.D. 100 the Frivoli discover a new technique for making meatballs that doubles the
quantity of meatballs they can produce each month.
c. Draw the new monthly production possibility frontier for the Frivoli.
d. After the innovation, which tribe now has an absolute advantage in producing meatballs? In
producing spaghetti? Which has the comparative advantage in meat-ball production? In
spaghetti production?
Solution4.
a.Theaccompanying diagram shows the production possibility frontier for the
Tivoli in panel (a) and for the Frivoli as the line labelled ―Original Frivoli PPF‖ in panel (b).
(a) Production possibility frontier
for the Tivoli
Quantity
of spaghetti
(kg)
(b) Production possibility frontier
for the Frivoli
Quantity
of spaghetti
(kg)
Original Frivoli PPF
50
50
40
40
30
30
20
20
10
10
0
10 20 30 40
50 60
0
Quantity of meatballs (kg)
New Frivoli PPF
10 20 30 40 50
60
Quantity of meatballs (kg)
The production possibility frontier for the Tivoli was calculated as follows: the Tivoli can
produce either 30 kg of spaghetti and no meatballs, or they can pro-duce no spaghetti but 50
3
kg of meatballs. That is, the opportunity cost of 1 kg of meatballs is ⁄5 of a kg of spaghetti:
3
in order to produce 1 more kg of meatballs, the Tivoli have to give up ⁄5 of a kg of spaghetti.
3
This means that the slope of their production possibility frontier is – ⁄5. A similar argument
4
for the Frivoli shows that their production possibility frontier has a slope of – ⁄3.
3
b. For the Tivoli, the opportunity cost of 1 kg of meatballs is ⁄5 of a kg of spaghetti. For the
4
Frivoli, the opportunity cost of 1 kg of meatballs is ⁄3 kg of spaghetti. That is, the Tivoli
have a comparative advantage in meatball production because their opportunity cost is
5
lower. For the Tivoli, the opportunity cost of 1 kg of spaghetti is ⁄3 kg of meatballs. For the
Frivoli, the opportunity cost of 1 kg of spaghetti is
3
⁄4 kg of meatballs. That is, the Frivoli have a comparative advantage in spaghetti
production because their opportunity cost is lower.
CHAPTER 2
ECONOMICMODELS:TRADE-OFFSANDTRADE
S-15
c. The Frivoli‘s new production possibility frontier is the line labelled ―New Frivoli PPF‖ in
panel (b) of the diagram. Instead of producing 30 kg of meatballs (if they produce no
spaghetti), they can now produce 60 kg.
d. Now the Frivoli have the absolute advantage in both meatball production and spaghetti
4
2
production. The Frivoli‘s opportunity cost of meatballs has now fallen to ⁄6 = ⁄3; that is,
for each kilogram of meatballs that the Frivoli now produce, they have to give up producing
2
2
⁄3 of a kilogram of spaghetti. Since the Frivoli‘s oppor-tunity cost of meatballs ( ⁄3) is still
3
higher than the Tivoli‘s ( ⁄5), the Tivoli still have the comparative advantage in meatball
3
production. The Frivoli‘s opportunity cost of spaghetti is ⁄2 kg of meatballs and the Tivoli‘s
5
is ⁄3 kg of meatballs, so the Frivoli have the comparative advantage in spaghetti production.
5.
According to the Canadian International Merchandise Trade Database from Statistics Canada,
in December 2012, Canada sold aircraft and spacecraft worth $27.23 mil-lion to China and
bought aircraft and spacecraft worth only $8.1 million from China. During the same month,
however, Canada bought $255.1 million worth of apparel and clothing accessories from China
but sold only $56 253 worth of apparel and clothing accessories to China. Using what you have
learned about how trade is determined by comparative advantage, answer the following
questions.
a. Which country has the comparative advantage in aircraft production? In produc-tion of
apparel and clothing accessories?
b. Can you determine which country has the absolute advantage in aircraft produc-tion? In
apparel and clothing accessories?
Solution5.
a.Iftradeittaking place according to comparative advantage, then we can
conclude that Canada has a comparative advantage in aircraft production and China has a
comparative advantage in clothing.
b. No, we can‘t say because trade depends only on comparative, not absolute,
advantage.
6.
Peter Pundit, an economics reporter, states that the European Union (EU) is increas-ing its
productivity very rapidly in all industries. He claims that this productivity advance is so rapid
that output from the EU in these industries will soon exceed that of Canada and, as a result,
Canada will no longer benefit from trade with the EU.
a. Do you think Peter Pundit is correct or not? If not, what do you think is the source of
his mistake?
b. If the EU and Canada continue to trade, what do you think will characterize the goods that
the EU sells to Canada and the goods that Canada exports to the EU?
Solution6.
a.PeterPundit is not correct. He confuses absolute and comparative
advantage. Even if the EU had an absolute advantage over Canada in every product it
produced, Canada would still have a comparative advantage in some products. And Canada
should continue to produce those products: trade will make both the EU and Canada better
off.
b. You should expect to see the EU export those goods in which it has the compara-tive
advantage and Canada export those goods in which it has the comparative advantage.
S-16
CHAPTER 2
ECONOMICMODELS:TRADE-OFFSANDTRADE
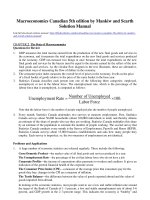
7.
You are in charge of allocating residents to your dormitory‘s baseball and basketball teams.
You are down to the last four people, two of whom must be allocated to base-ball and two to
basketball. The accompanying table gives each person‘s batting aver-age and free-throw
average.
Name
Batting average
Free-throw average
Kelley
70%
60%
Jackie
50%
50%
Curt
10%
30%
Yui
80%
70%
a. Explain how you would use the concept of comparative advantage to allocate the
players. Begin by establishing each player‘s opportunity cost of free throws in terms of
batting average.
b. Why is it likely that the other basketball players will be unhappy about this arrangement
but the other baseball players will be satisfied? Nonetheless, why would an economist
say that this is an efficient way to allocate players for your dormitory‘s sports teams?
Solution7.
a.Let‘sbeginby establishing the opportunity cost of free throws for each
player. If you allocate Kelley to the basketball team, the team gains a player with a 60%
free-throw average and the baseball team loses a player with a 70% batting aver-age. That
7
is, the opportunity cost of allocating Kelley to the basketball team is ⁄6. Similarly, Jackie‘s
opportunity cost of playing basketball is 1; Curt‘s opportunity cost of playing basketball is
1
8
⁄3, and Yui‘s opportunity cost of playing basketball is ⁄7. Jackie and Curt have the lowest
opportunity costs of playing basketball; that is, they have the comparative advantage in
basketball. Therefore, they should be allocated to the basketball team. Kelley and Yui have
the comparative advantage in baseball and should therefore play on the baseball team.
b. It is likely that the basketball team will be unhappy with this arrangement. Both Jackie and
Curt have an absolute disadvantage at playing basketball, compared to the other two
players. (They also have an absolute disadvantage at playing baseball, but they are
comparatively less bad at basketball than at baseball.) The baseball team is likely to be
happy about this allocation because both Kelley and Yui have an absolute advantage at
playing baseball. However, if you are concerned with the total number of wins for the
dormitory (as an economist who would be concerned about efficiency), this allocation is the
best one: it maximizes the over-all chances of the dormitory winning at any sport.
8.
The inhabitants of the fictional economy of Atlantis use money in the form of cowry shells.
Draw a circular-flow diagram showing households and firms. Firms produce potatoes and fish,
and households buy potatoes and fish. Households also provide the land and labour to firms.
Identify where in the flows of cowry shells or physical things (goods and services, or
resources) each of the following impacts would occur. Describe how this impact spreads
around the circle.
a. A devastating hurricane floods many of the potato fields.
b. A very productive fishing season yields a very large number of fish caught.
c. The inhabitants of Atlantis discover Shakira and spend several days a month at dancing
festivals.
CHAPTER 2
ECONOMICMODELS:TRADE-OFFSANDTRADE
Solution8.
Theaccompanying diagram illustrates the circular flow for Atlantis.
Shells
Shells
Households
Potatoes
and fish
Land and
labour
Markets for
goods and
services
Factor
markets
Potatoes
and fish
Land and
labour
Firms
Shells
Shells
a. The flooding of the fields will destroy the potato crop. Destruction of the potato crop
reduces the flow of goods from firms to households: fewer potatoes produced by firms now
are sold to households. An implication, of course, is that fewer cowry shells flow from
households to firms as payment for the potatoes in the market for goods and services. Since
firms now earn fewer shells, they have fewer shells to pay to households in the factor
markets. As a result, the amount of fac-tors flowing from households to firms is also
reduced.
b. The productive fishing season leads to a greater quantity of fish produced by firms to
flow to households. An implication is that more money flows from households to firms
through the markets for goods and services. As a result, firms want to buy more factors
from households (the flow of shells from firms to households increases) and, in return, the
flow of factors from households to firms increases.
c. Time spent at dancing festivals reduces the flow of labour from households to firms and
therefore reduces the number of shells flowing from firms to house-holds through the
factor markets. In return, households now have fewer shells to buy goods with (the flow of
shells from households to firms in the markets for goods and services is reduced), implying
that fewer goods flow from firms to households.
9.
An economist might say that colleges and universities ―produce‖ education, using faculty
members and students as inputs. According to this line of reasoning, educa-tion is then
―consumed‖ by households. Construct a circular-flow diagram to repre-sent the sector of the
economy devoted to college education: colleges and universities represent firms, and
households both consume education and provide faculty and students to universities. What are
the relevant markets in this diagram? What is being bought and sold in each direction? What
would happen in the diagram if the government decided to subsidize 50% of all college and
university students‘ tuition?
S17
S-18
CHAPTER 2
ECONOMICMODELS:TRADE-OFFSANDTRADE
Solution9.
Theaccompanying diagram shows the circular flow for the education sector.
Salaries,
scholarships
Tuition
Households
Education
Faculty,
students
Academic job
market, market
for students
Education
market
Faculty,
students
Education
Tuition
Colleges,
universities
Salaries,
scholarships
Colleges and universities buy faculty on the academic job market and attract students from the
market for students. (Many colleges and universities actively try to attract good students by
offering scholarships and the like.) They sell education to house-holds in the market for
education, and households buy education in that market from one (or sometimes several) of the
sellers.
If the government subsidized half of all students‘ tuition, households would demand more
education. As a result, colleges and universities would hire more fac-ulty and accept more
students, meaning that more money in terms of salaries and scholarships would flow from
universities and colleges to the households.
10.
Your dormitory roommate plays loud music most of the time; you, however, would prefer
more peace and quiet. You suggest that she buy some earphones. She responds that although
she would be happy to use earphones, she has many other things that she would prefer to spend
her money on right now. You discuss this situation with a friend who is an economics major.
The following exchange takes place:
He: How much would it cost to buy earphones?
You: $15.
He: How much do you value having some peace and quiet for the rest of the semester?
You: $30.
He: It is efficient for you to buy the earphones and give them to your roommate. You gain
more than you lose; the benefit exceeds the cost. You should do that.
You: It just isn’t fair that I have to pay for the earphones when I’m not the one making the
noise.
a. Which parts of this conversation contain positive statements and which parts contain
normative statements?
b. Construct an argument supporting your viewpoint that your roommate should be the one to
change her behaviour. Similarly, construct an argument from the view-point of your
roommate that you should be the one to buy the earphones. If your dormitory has a policy
that gives residents the unlimited right to play music, whose argument is likely to win? If
your dormitory has a rule that a person must stop playing music whenever a roommate
complains, whose argument is likely to win?
CHAPTER 2
ECONOMICMODELS:TRADE-OFFSANDTRADE
S-19
Solution10.
a.―Itisefficient for you to buy the earphones‖ is a positive statement
(it is either right or wrong); that is, it is about description. ―You should do that‖ (that is,
buy the earphones) is strictly speaking a normative statement; that is, it is about
prescription (although you would find all economists agree that all trades that improve
efficiency should be made). ―It just isn‘t fair‖ is a normative statement— that is, it is about
prescription—and you would likely find much disagreement about the fairness of the
proposed trade.
b. One argument that your roommate should buy the earphones is that everyone has the right to
peace and quiet. If your roommate therefore wants to listen to music, she should have to be
responsible for making sure that others‘ peace and quiet is not disturbed. Your roommate
might argue that since she has the right to play as much music as she wants, it is your
responsibility to make sure that you are not disturbed—for instance, by buying her
earphones. If the dormitory has a policy that establishes the right to unlimited music, your
roommate‘s argument wins. If the rule is that there is a right to peace and quiet, your
argument wins.
11.
A representative of the Canadian clothing industry recently made the following state-ment:
―Workers in Asia often work in sweatshop conditions earning only pennies an hour. Canadian
workers are more productive and as a result earn higher wages. In order to preserve the dignity
of the Canadian workplace, the government should enact legislation banning imports of low wage Asian clothing.‖
a. Which parts of this quote are positive statements? Which parts are normative
statements?
b. Is the policy that is being advocated consistent with the preceding statements about the
wages and productivities of Canadian and Asian workers?
c. Would such a policy make some Canadians better off without making any other Canadians
worse off? That is, would this policy be efficient from the viewpoint of all Canadians?
d. Would low-wage Asian workers benefit from or be hurt by such a policy?
Solution11.
a.Thefirsttwo sentences contain the positive statements about wages and
about productivity and its connection with wages. The last sentence, recommending the ban on
imports, is normative.
b. The policy advocated could be consistent with the positive statements. The state-ments
about wages and productivity are related to absolute advantage. However, the Asian
workers could have a comparative advantage (and in reality do have a comparative
advantage). Without protection against imports, the Canadian workers could be displaced
by cheaper imports. If ―preserving the dignity of the Canadian workplace‖ means those
workers keeping their jobs, then protec-tion might be necessary (unless the Canadian
workers have some special niche market).
c. The policy would make Canadian clothing workers better off, but the buyers of cheap
imported clothing worse off. By moving the country away from its areas of comparative
advantage, total incomes in Canada would have to be lower; the policy would therefore
be inefficient from the viewpoint of all Canadians.
d. Some low-wage Asian workers would be worse off if exports to Canada stopped. As with
Canada, Asia would have some resources moved out of the sector where it has a
comparative advantage, so total incomes would fall.
S-20
CHAPTER 2
ECONOMICMODELS:TRADE-OFFSANDTRADE
12. Are the following statements true or false? Explain your answers.
a. ―When people must pay higher taxes on their wage earnings, it reduces their
incentive to work‖ is a positive statement.
b. ―We should lower taxes to encourage more work‖ is a positive statement.
c. Economics cannot always be used to completely decide what society ought to do.
d. ―The system of public education in this country generates greater benefits to soci-ety than
the cost of running the system‖ is a normative statement.
e. All disagreements among economists are generated by the media.
Solution12.
a.True.Thisis a positive statement. It has a factual answer; that is, it is
either right or wrong. There has been some debate about whether the statement is actually true
or false, but in principle there is only one answer.
b. False. This is a statement about what we should do, and this statement has no clearly
right or wrong answer. Your view will depend on whether you think encouraging more
work is a good or a bad idea.
c. True. Economics is best at giving positive answers, for instance, answers about what the
most efficient way is of achieving a certain aim. The question of how society ought to
be organized is mostly decided in the realm of politics.
d. False. This is a positive statement. In principle, it has an answer that is either right or wrong.
e. False. Some disagreements among economists arise from the fact that in building a model,
one economist thinks that a certain abstraction from reality is admissible but another
economist may think that that abstraction is not admissible. Some dis-agreements arise from
the fact that economists sometimes disagree about values.
13.
Evaluate the following statement: ―It is easier to build an economic model that accu-rately
reflects events that have already occurred than to build an economic model to forecast future
events.‖ Do you think this is true or not? Why? What does this imply about the difficulties of
building good economic models?
Solution13.
True.Withhindsight it is easier to see the important features of the
situation that a model should have captured. For predictive purposes, a model needs to
anticipate which features of reality are important (and so should be included) and which are
unimportant (and so can be ignored). This is why the famed British economist John Maynard
Keynes referred to economics as an art as well as a science.
14.
Economists who work for the government are often called on to make policy recommendations. Why do you think it is important for the public to be able to differenti-ate
normative statements from positive statements in these recommendations?
Solution14.
Positivestatements are those based on fact—or at least on our best
estimate of what the facts are. Therefore, these statements are also those that do not depend on
the political views of the economist. Normative statements may sometimes be influenced by the
economist‘s own values. Whether someone agrees with an economist‘s nor-mative statement
may depend on whether they share values. It is therefore important that the public be able to
distinguish normative from positive statements.
CHAPTER 2
15.
ECONOMICMODELS:TRADE-OFFSANDTRADE
The mayor of Gotham City, worried about a potential epidemic of deadly influenza this
winter, asks an economic adviser the following series of questions. Determine whether a
question requires the economic adviser to make a positive assessment or a normative
assessment.
a. How much vaccine will be in stock in the city by the end of November?
b. If we offer to pay 10% more per dose to the pharmaceutical companies providing the
vaccines, will they provide additional doses?
c. If there is a shortage of vaccine in the city, whom should we vaccinate first—the elderly
or the very young? (Assume that a person from one group has an equal likelihood of
dying from influenza as a person from the other group.)
d. If the city charges $25 per shot, how many people will pay?
e. If the city charges $25 per shot, it will make a profit of $10 per shot, money that can go
to pay for inoculating poor people. Should the city engage in such a scheme?
Solution15.
a.Positive
b. Positive
c. Normative
d. Positive
e. Normative
16.
Assess the following statement: ―If economists just had enough data, they could solve all policy
questions in a way that maximizes the social good. There would be no need for divisive
political debates, such as whether the government should provide free medical care for all.‖
Solution16.
Whatistrueis that if economists had enough data, they could predict
precisely what the outcome would be of any proposed policy (such as free medical care). That is,
economists can answer positive questions. But no amount of data can lead to
a determination about what a society should do—that is a normative question. An economist
can predict how much it will cost to provide free medical care and what effects different ways
of raising taxes will have on people‘s behaviour (for instance, a sales tax will reduce
consumption behaviour; an income tax may discourage workers from working as much as
before). But whether this is a trade-off worth making is a question that can be answered only in
political discourse.
S21
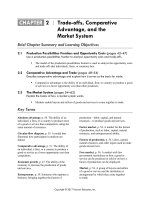
chapter
2
Economic Models:
Trade-offs and Trade
Chapter Objectives
• Explain why models play a crucial role in economics.
• Present two simple but important models: the production possibilities frontier and
comparative advantage.
• Present the circular-flow diagram.
• Explain the difference between positive and normative economics.
• Explain why economists do not always agree.
Chapter Outline
Opening Example: The Wright Brothers invented a wind tunnel to test models of air-planes.
Boeing ran 15 000 hours of wind tunnel tests when it was developing its latest jet, the Dreamliner.
Testing models is cheaper and safer than building full-scale versions. Economists use models in the
same way.
I. Models in Economics: Some Important Examples
A. Definition: A model is a simplified representation of a real situation that is used to better
understand real-life situations.
B. Models allow economists to see the effects of only one change at a time.
C. Definition: The other things equal assumption (ceteris paribus) means that all other
relevant factors remain unchanged.
D. Economic models make use of mathematical tools, especially graphs.
II. Trade-offs: The Production Possibility Frontier
A. Definition: The production possibility frontier illustrates the trade-offs facing an
economy that produces only two goods. It shows the maximum quantity of one good that
can be produced with available resources and technology for any given production of the
other.
B. The graph of the production possibilities frontier shows the possible combin-ations of
two goods which can be produced given the scarce resources of the society.
C. A point inside the frontier is a feasible combination of two goods that can be pro-duced,
but does not use all resources fully, and a point outside the frontier is not feasible given
the current amount of resources. See text Figure 2-1, shown next.
11
12
CHAPTER2
ECONOMICMODELS:TRADE-OFFSANDTRADE
The Production Possibility Frontier
Quantity of
subway
Not
trains
D
feasible
70
Feasible and
efficient in
production
A
35
Feasible but
not efficient
B Production
21
C
0
possibility
frontier
PPF
Quantity of jets
10 14 20
D. The production possibility model illustrates the concepts of:
1. Efficiency: Any point on the frontier represents an efficient use of resour-ces, and
any combination of goods inside the frontier represents a point of inefficiency.
a. If an economy produces on its production possibilities frontier, it is efficient
in production.
b. An economy is efficient in allocation if it allocates resources so that consumers are as well off as possible.
2. Opportunity costs: The negative slope of the frontier means that an increase in
the production of one good must require a sacrifice of some quantity of the
other good.
3. The case of increasing costs: If the frontier is bowed out, the opportunity costs
increase as more of one good is produced because resources are not easily
transferable from the production of one good to another.
4. Economic growth: Over time as a society gains more resources, the produc-tion
possibility frontier shifts outward. See text Figure 2-3, shown on the next page.
a. Economic growth comes from two basic sources: an increase in factors of
production, and changes in technology.
b. Definition: Factors of production are resources used to produce goods and
services.
c. Definition: Technology is the technical means for producing goods and
services.
CHAPTER2
ECONOMICMODELS:TRADE-OFFSANDTRADE
Economic Growth
Quantity of
subway trains
E
70
60
A
50
40
30
Original
PPF
20
New
10
0
PPF
10 20
12
30 40 50 60
25
Quantity of jets
III. Comparative Advantage and Gains from Trade
A. Definition: An individual has a comparative advantage in producing a good if the
opportunity cost of producing the good is lower for that individual than for other
people. The same principle holds for countries.
B. Definition: An individual has an absolute advantage in an activity if he or she can do it
better than other people can. Having an absolute advantage is not the same thing as
having a comparative advantage.
C. Comparative advantage, not absolute advantage, is the basis for the gains from trade.
D. The gains from trade are illustrated in text Figure 2-5 (shown next), with a straightline production possibility frontier for each of two countries:
Comparative Advantage and International Trade
(a) Canadian Production and Consumption
Quantity
of subway
trains
70
(b) Brazilian Production and Consumption
Quantity
of subway
trains
Canadian consumption
without trade
Canadian consumption
with trade
29
28
Brazilian
production
with trade
60
Brazilian consumption
with trade
31
30
Brazilian consumption
without trade
Canadian Canadian production
PPF
with trade
0
12
14
20
Brazilian
PPF
0
Quantity of jets
5
10
6
Quantity of jets
E. Individuals or countries will engage in trade only if the price of the good each is obtaining
from trade is less than its own opportunity cost of producing the good.
13
14
CHAPTER2
ECONOMICMODELS:TRADE-OFFSANDTRADE
IV. Transactions: The Circular-Flow Diagram
A. Definition: Trade takes the form of barter when people directly exchange goods they
have for goods they want.
B. Definition: The circular-flow diagram is a model that represents the trans-actions
in an economy by flows around a circle.
C. Definition: A household is a person or a group of people who share their
income.
D. Definition: A firm is an organization that produces goods for sale.
E. Definition: Firms sell goods and services that they produce to households in
markets for goods and services.
F. Definition: Firms buy the resources they need to produce—factors of
production—in factor markets.
G. Definition: Income distribution is the way in which total income is divided among
the owners of the various factors of production.
H. The circular-flow diagram is a simplified picture of an economy, as demon-strated
in text Figure 2-6, shown here.
Circular-Flow Diagram
Money
Money
Households
Factors
Goods
and
services
Markets for
goods and Factor markets services
Goods
and
services
Factors
Money
Money
Firms
V. Positive versus Normative Economics
A. Definition: Positive economics is the branch of economic analysis that
describes the way the economy actually works.
B. Definition: Normative economics makes prescriptions about the way the econ-omy
should work.
C. Definition: A forecast is a simple prediction of the future.
D. Models are especially helpful in answering ―what if‖ questions such as, How will
revenues change with a tax cut? The answer is a predictive one, not prescriptive; it does
not tell you if the policy is good or bad.
CHAPTER2
ECONOMICMODELS:TRADE-OFFSANDTRADE
15
E. Economists do engage in normative economics. Economic analysis can be used to show
that some policies are clearly better than others, especially if one solu-tion is more
efficient than another. For example, most economists would favour subsidies to renters
over rent-control laws as a more efficient solution.
VI. When and Why Economists Disagree
A. Because economists have used different models and made differing simplifying
assumptions, they can arrive at different conclusions. Many disagreements are
eventually resolved by the accumulation of evidence.
B. Economists may also have different value judgements, for example, about what
constitutes a fair distribution of income. These are normative disagreements.
C. Economic analysis is a method, not a set of conclusions.
Teaching Tips
Models in Economics
Creating Student Interest
Ask students why economists (and economics students) use simplified models. (Because the real
world is too complex to consider everything at once. You want to use a more complicated model
only if the benefits of added understanding exceed the costs of added difficulty and complexity.)
Construct a paper airplane during class. When you are finished, ask the students what you have
made. Give your airplane a test flight. Have the class identify the ways the paper air-plane is like a
real airplane (for instance, it has wings, it flew). If they have trouble, remind them that they knew
what it was, so there must have been some things in common! Have the class identify the ways it is
not like a real airplane (size, weight, other details, it did not fly). The paper airplane can help an
aerodynamics student learn the basic principles of flight (without the complexity of a 747), just as
economic models can help students learn about the basic principles of economics. As
understanding increases, so can the complexity of the models used.
An alternative to the paper airplane example is a simple smiley face drawn on the board or an
emoticon used in text messages, :) or
. Use these representations to have the same discussion
with students. How is the image like a real smiling face and how is it different? Why is it so useful
in text messaging? (It is simplified and we all know what it means.) How might the level of
complexity be increased for the smiley face model? (Add ears, hair.)
Presenting the Material
After introducing the idea of a model as a simplified representation of reality (airplane or smiley
face), segue into models in economics by asking students how they think economists represent
reality. Try to get students to identify types of economic models. Help them by ask-ing what
representations they see when looking through their textbook. They should be able to identify
tables, graphs, and equations as representations of economic models.
Explain that in later chapters they will learn the law of demand. Ask them what happens to the
amount of a good that they purchase when its price rises. Most students will know that people buy
less when the price rises and buy more when the price falls. The concept will be easy for them to
understand. (They don‘t need an economics course to figure out the law of demand!) Tell the
students that they already know an important economic ―law.‖ Show them how economists model
(represent) the law of demand using a demand schedule, a graph and an equation (see next page).
16
CHAPTER2
ECONOMICMODELS:TRADE-OFFSANDTRADE
Price
Bottles of Pepsi
Price
Quantity
purchased
$0.50
0.75
1.00
1.25
4
3
2
1
$1.25
P = 1.50 – 0.25Q
or
Q = 6 – 4P
1.00
0.75
0.50
0
1
2
3
4
Bottles of Pepsi
Trade-offs: The Production Possibilities Frontier
Creating Student Interest
Introduce the production possibilities model by evoking the image of a person (or people) stranded
on an island. This could be Robinson Crusoe, Gilligan, Tom Hanks in Cast Away, contestants on
―Survivor‖—have your students select the image that they can relate to the most. Present that as an
example of the simplest economy you can imagine. Explain to students that you are going to build
a model of the economy on the island. Have students list the limited resources available on the
island (for example, trees, sand, water, fish, labour, entrepreneurship). Then have the class
consider the immediate needs that must be met using these resources (food, shelter). Explain that
the model will represent production in the island economy.
Presenting the Material
Use students ―producing‖ grades as a simple example of a production possibility frontier. Put
economics on the vertical axis of a graph and accounting on the horizontal axis. Students‘ time and
energy are fixed for the moment, and putting more time into one subject involves a lower grade in
the other subject. (Assuming that the student is equally efficient in ―pro-ducing‖ both subjects, the
production possibilities graph is a straight line.) Points on the frontier show the possible
combinations of grades that the student can achieve.
Use an example of a country that can produce wheat or airplanes. Here are the points on the
production possibility frontier:
Maximum annual output options
Wheat
Airplanes
A
1000
0
B
800
150
C
600
250
D
400
325
E
200
375
F
0
400
CHAPTER2
ECONOMICMODELS:TRADE-OFFSANDTRADE
17
Ask students: What is the opportunity cost of expanding production from 150 airplanes to 250
airplanes? (200 wheat.) Why is the production possibility graph negatively sloped? (Given
scarcity, producing more of one good means producing less of the other.) Why is it bowed out
from the origin? (That reflects increasing opportunity costs. Perhaps not all resources are equally
good at producing both goods.)
Comparative Advantage and Gains from Trade
Creating Student Interest
Ask students if they agree with the idea that, if it is cheaper to buy a product from another country
than to make it yourself, you should buy it from the other country.
Provoke a discussion by asking students if the Canadian economy would be better off with-out
importing so many clothing items from Bangladesh. Get them to start thinking about the idea that
every action has a benefit and a cost. Who benefits from being able to import clothing from
Bangladesh? (Consumers, because the clothing is cheaper.) Who loses as a result of importing
more clothing from Bangladesh? (Domestic producers, because fac-tories close and jobs are lost.)
Presenting the Material
Give a simple example of two economies that can produce the following two goods, in the same
time period, with a fixed amount of resources. Assume a straight line production possibility
frontier.
Lozano
Quantity
of pizza
Bilma
Quantity
of pizza
15
7
D
25
Quantity of cola
D
12
Quantity of cola
Indicate that Lozano has an absolute advantage in both goods. Students often need help in
seeing how to calculate the opportunity costs of producing both goods in each country. The
opportunity cost of pizza in Lozano is the ratio of cola to pizza, or 25/15
= 1.67, and the opportunity cost of pizza in Bilma is 12/7 = 1.7. Thus, Lozano has the
comparative advantage in pizza and Bilma has the comparative advantage in producing cola.
Transactions: The Circular-Flow Diagram
Creating Student Interest
Use the example of a dollar in your pocket. Explain where the dollar came from. (It came from
your bank account, it was put there by a direct deposit from your university.) Consider where the
dollar will go. (You will buy lunch and leave it as a tip, it will become income for a waitress and
then she will have money to spend.) Ask students to think about the last dollar they spent. Where
did it come from and where did it go?
18
CHAPTER2
ECONOMICMODELS:TRADE-OFFSANDTRADE
Presenting the Material
Identify and define the two major components of the circular-flow diagram first: house-holds and
firms. Then draw in the upper loop—the spending loop—of the circular-flow model. Use a
concrete example of their spending money on clothes at a local store. Then add the bottom loop of
the model, the factor market. Use a concrete example of their earning wages from a job.
Use your ample artistic skills to draw a house on the left side of the board and a factory on the
right. Tell the class these represent households and firms. Create the circular-flow diagram by
asking students the following series of questions. (It will help some students to see the step-by-step
construction of the diagram in addition to the completed diagram in the text.)
What do households get from the firms? (Goods and services.) Draw an arrow above the pictures
from the firm to the households and label it ―goods and services.‖
What do the firms get in exchange for the goods and services? (Payment/money.) Draw a line
above the pictures back from the households to the firm and label it ―$.‖
What do the households provide to the firms? (Worker/labour—add that they provide the other
resources also.) Draw a line below the pictures from the household to the firm and label it
―resources.‖
What do the households get from the firm in return for their labour/resources? (Payments— wages,
rent, interest, profit.) Draw a line below the pictures back from the firm to the households and label
it ―wages, rent, interest, profit.‖
Point out that the top flow is the product market (market for products) and the bottom flow is the
factor market (market for factors of production). You may want to link changes in the size of the
flows to the business cycle discussed in Chapter 1. During expansions, the flow increases; during
recessions, it decreases.
Positive versus Normative Economics
Creating Student Interest
Find an estimate of the average annual tuition at your institution. Write the estimate on the board
and tell students you want them to know two things about this number (write them on the board):
First, it is the average annual tuition at your institution. Second, this amount is too low. Tell them
to write down the two statements. This should cause one or more students to express disagreement
with at least one of the statements. If not, ask them if they agree with them or not (and why). Use
the statements to lead into your presentation of positive versus normative in economics.
Presenting the Material
After explaining the difference between positive and normative, quiz the class by asking them to
determine if each of the following statements is positive or normative. If a student identifies the
statement as positive, ask how the statement could be tested. Remind them that a positive statement
need not be correct, it only needs to be testable. Also remind them that even if everyone agrees
with a normative statement, it is still normative.
Tell students that the top marginal federal income tax rate in Canada is 29% (on taxable incomes
over $136 270 in 2014). (That‘s a positive statement.) To update, see the Canada Revenue
Agency‘s website: />Then ask them: should that top marginal rate be higher or lower? Or should we have a separate top
marginal rate, as some advocate, for incomes much higher than this? What about those making tens
of millions every year?
CHAPTER2
ECONOMICMODELS:TRADE-OFFSANDTRADE
19
The price of gas is too high. (Normative: What is ―too high‖?)
The Bank of Canada lowered interest rates yesterday. (Positive: You can test this by going to The
Bank of Canada website or by looking at interest rates.)
The national debt should be reduced. (Normative: How can you know/test what ―should‖ be done?)
Foreign imports are bad for the economy. (Normative: How do you define ―bad‖?)
Inflation is expected to rise. (Positive: You can survey people and see/test whether they expect
inflation to rise.)
Common Student Pitfalls
• Misunderstanding comparative advantage. Students confuse absolute advantage with
comparative advantage. Explain that absolute advantage means you can produce more than
someone else can. Comparative advantage means that you can produce something at a lower
opportunity cost than someone else.
Use the example of two students working on a joint project. One student may be better at
every task required to complete the project (have an absolute advantage in all tasks).
However, it wouldn‘t be efficient to have the one student do everything for the project while
the other does nothing. There must be a task that the other student is relatively good at (has a
comparative advantage). The pair should identify that task and have the students specialize
accordingly.
Most students understand the basic idea behind comparative advantage, but many students
struggle with the calculation of opportunity cost. They may need to see and work a few
examples before the concept sinks in. Start with the example from the text, and then move on
to other examples.
• The use of the term positive. Students may not understand the different use of the word
positive. (It comes from ‗logical positivism‘ in philosophy.) Make sure they understand that it
is not being used in the same way they are familiar with (the oppos-ite of negative). There are
many places where economists use generally familiar words to mean something specific to
their discipline. Prepare them to get used to learning the new meanings in these cases. In this
context, ―positive economics‖ explains the way the world works. It is factual and can
therefore be tested.
Case Studies in the Text
Economics in Action
Rich Nation, Poor Nation—Much of our clothing is produced in another country much poorer than
Canada. The case study explains that this is because the countries have a comparative advantage in
producing clothing.
Ask students the following questions:
1. Why are some countries poor? (Their workers are not as productive as workers in
richer economies. This is not because these workers don‘t work hard; they have less
capital, both human and physical, to work with.)
2. Why do consumers in Canada import so much cheap clothing from poor coun-tries?
(Despite their poverty, poor countries have a comparative advantage in producing
clothing relative to Canada.)
20
CHAPTER2
ECONOMICMODELS:TRADE-OFFSANDTRADE
Economists, Beyond the Ivory Tower—This EIA discusses the various roles that economists play in
the business world, and in government and international organizations.
Ask students the following questions:
1. Why do companies in the private sector hire economists? (To forecast and pre-dict
what will happen to prices.)
2. Why does the government employ large numbers of economists? (To analyze the
economic effects of government decisions.)
For Inquiring Minds
The Model That Ate the Economy—This FIM discusses a model used by financial traders on Wall
Street, beginning in 2000, to estimate the likelihood of losing money on mort-gage-backed
securities (MBTs). As subsequent economic events proved, the model seriously underestimated the
risk of buying the MBTs.
When Economists Agree—This FIM notes that although economists often disagree, there are some
statements that they generally agree on. One statement of agreement: Trade restrictions reduce
economic welfare. Note that this reflects common value judgements and is not a conclusion from
positive economics. See Robert Driskill, ―Deconstructing the argument for free trade: a case study
of the role of economists in policy debates‖, Economics and Philosophy, 2012, pp. 1–30.)
Global Comparison
Pajama Republics—Poor countries have low productivity in clothing manufacturing, but even
lower productivity in other industries, thus they have a comparative advantage in clothing
manufacturing.
Business Case
Efficiency, Opportunity Cost, and the Logic of Lean Production at Boeing—This business case
explains the idea behind lean production, with reference to the experiences of Boeing and Toyota.
Activities
Creating a Production Possibilities Curve (15–25 minutes)
For this activity you will need two desks, paper (this can be in half-sheets), and two stap-lers—
capital. You will also need four or six volunteers to participate in the activity—labour. Have
another student take responsibility for graphing results of the activity on the board. This activity
identifies the alternative combinations of output (called widgets and whatsits) that can be produced
given the available resources (capital/desks, paper and staplers, and labour/students). That is, the
students will generate a production possibilities frontier. Have the nonlabour students draw a
production possibilities graph and label the axes. Then have the student grapher draw the graph.
Explain to students that the capital and labour will be used to produce widgets or whats-its. A
widget is a piece of paper folded twice into a square and stapled. A whatsit is a piece of paper
folded three times. Start by having the students use all their resources to produce widgets for 30
seconds. Count the number of widgets and whatsits produced (whatsits will equal 0). Have the
students graph the data point. Next have the students use all their
CHAPTER2
ECONOMICMODELS:TRADE-OFFSANDTRADE
21
resources to produce whatsits. Count the production and graph the data point. Finally, have the
students divide the resources in half. Have one half produce widgets and the other produce
whatsits. Graph this third data point. Connect the points to show the production possibilities
frontier.
Canadian Comparative Advantage (2–3 minutes)
Make a list on the board or overhead with student answers to this question: What com-parative
advantages does Canada have? You could begin by listing the commodity group-ings in the
following table. This table shows the trade flows in 2013. The trade balance for each commodity
group gives a broad idea of where Canada‘s comparative advantage lies.
Commodity Grouping
Exports
(billions of
dollars)
Farm, fishing, and intermediate food products
Imports
(billions of
dollars)
Balance
of Trade
(billions of
dollars)
27.9
13.1
14.8
111.0
44.0
67
Metal ores and non-metallic minerals
17.9
11.5
6.4
Metals and non-metallic mineral products
54.0
40.0
14.0
Basic and industrial chemical, plastic, and rubber
products
34.9
40.8
–5.9
Forestry products
33.8
21.0
12.0
Industrial machinery, equipment and parts
26.9
45.4
–18.5
Electronic and electrical equipment and parts
22.6
56.5
–33.9
Motor vehicles and parts
68.2
85.0
–16.8
Aircraft and other transportation equipment and parts
17.4
14.9
2.5
Consumer goods
52.2
97.7
–45.2
Energy products
(Source: Statistics Canada, Canadian International Merchandise Trade, Cat. 65-001-X, Vol.67, No.12, (December 2013),
Tables 1 and 2.)
Pros and Cons of Trade (3–5 minutes)
Pair students and ask them to brainstorm the pros and cons of the following proposition: ―Canada
should limit imported textiles from China to create jobs at home.‖ or ―Canada should prohibit the
importation of products from abroad that are made with child labour.‖
Tracing the Circular Flow (5–10 minutes)
Pair students and tell them they will trace the following events through the circular flow:
(a) the introduction of a new technology which boosts productivity; (b) the decision of consumers
to save more money; and (c) an increase in government spending.
Simulating the Circular Flow (15–30 minutes)
In a lecture, add banks, government, and exports and imports to the circular flow. Divide the class
into the following groups: households, firms, workers, sellers of raw materials, sellers of capital
goods, banks, exporters, and importers. Introduce an event into this hypo-thetical economy:
Consumers decide to spend more money and save less. Give this event card to the household
group. Have this group write down how it will affect them and pass it on to the next group they
feel will be most immediately affected. The next group writes down its impact on them and passes
it on. Make sure the event passes to each group. Have one group use the circular-flow diagram to
illustrate on the board how the event affected the economy.
22
CHAPTER2
ECONOMICMODELS:TRADE-OFFSANDTRADE
Positive or Normative? (3–5 minutes)
Read the following sentences to the class, and ask students to label each one as normative or
positive:
• ―More than 60% of women are in the labour market.‖ (Positive.)
• ―Rent control laws should be implemented because they help to achieve equity or fairness in
housing.‖ (Normative.)
• ―Society should take measures to end domestic violence.‖ (Normative.)
• ―People who smoke pass on increased medical costs to the whole society.‖ (Positive.)
• ―Single mothers are more than twice as likely as married mothers to be in poverty.‖ (Positive.)
Change It to Normative (5–10 minutes)
Pair students. Ask one student in each pair to write a positive economic statement of fact, and the
other student to rewrite the statement as a normative one. Ask a few pairs to report.
Appendix
Creating Student Interest
Have students discuss the relationship between calories consumed and weight. What is the
independent variable? What is the dependent variable?
Presenting the Material
Give an example of data and how a graph is set up, then explain how to interpret the graph.
Year
Health Expenditures, as percent of GDP
1975
7.0
1985
8.2
1995
9.2
2005
10.2
2010
11.6
2013 (estimated)
11.2
(Source: Canadian Institute of Health Information, National Health Expenditure Trends 1975–2013, Table A1.)
Ask students the following questions:
1. With health expenditures as a percent of GDP on the vertical axis of a graph and years on
the horizontal axis of the graph, plot the data on the graph.
2. Is the line positively or negatively sloped? (It is positively sloped; as the years have
increased, the percent share of GDP has increased.)
3. Is it a linear function? (No, the line is not a straight line.)
4. What does the graph not tell us? (It does not indicate what is causing the change in health
expenditures as a percent of GDP.)
Common Student Pitfalls
Students forget the basic setup of a graph: that each point on the graph refers to a specific quantity
on the vertical axis and horizontal axis. Use a demand curve to illustrate: point A on the demand
curve means that at a price of $1.00, consumers will buy 200 of the good, for example. You may
want to point out which axis on the graph is referred to as the ver-tical axis and which is the
horizontal axis.