Solution manual for engineering fundamentals an introduction to engineering 5th edition by saeed moaveni
Bạn đang xem bản rút gọn của tài liệu. Xem và tải ngay bản đầy đủ của tài liệu tại đây (337.61 KB, 7 trang )
Chapter 4: Engineering Communication
Download Full Solution Manual for Engineering Fundamentals An
Introduction to Engineering 5th Edition by Saeed Moaveni
/>4.14 Plot the following data. Use two different y-axes. Use a scale of zero to 100°F for
temperature, and zero to 12 mph for wind speed. Present your work using the
ideas discussed in this chapter and engineering papers.
Time (p.m.)
1
2
3
4
5
6
7
8
Temperature (°F) Wind Speed (mph)
75
4
80
5
82
8
82
5
78
5
75
4
70
3
68
3
90
9
80
8
70
7
60
6
50
5
Temperature (F)
40
Wind Speed (mph)
4
30
3
20
2
10
1
0
0
0
1
2
3
4
5
6
Time (p.m.)
Figure 4-14 Plot of temperature and wind speed as a function of time
7
8
Wind Speed (mph)
Temperat
ure (F)
SOLUTION
1
©2016 Cengage Learning. All Rights Reserved. May not be scanned, copied or duplicated, or posted to a publicly accessible website, in whole or in part.
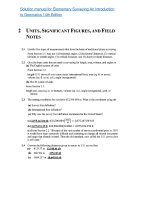
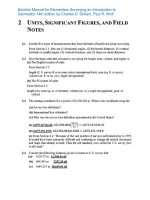
4. 15 Create a table that shows the relationship between the units of temperature in degree
Celsius and Fahrenheit in the range of -50° to 50°C. Use Increments of 10°C. Present
your work using the ideas discussed in this chapter and engineering paper.
SOLUTION
Table 4.15 The relationship between the units of temperature in degrees Celsius and
Fahrenheit
Temperature (°C) Temperature (°F)
-50
-58
-45
-49
-40
-40
-35
-31
-30
-22
-25
-13
-20
-4
-15
5
-10
14
-5
23
0
32
5
41
10
50
15
59
20
68
25
77
30
86
35
95
40
104
45
113
50
122
4.16
Create a table that shows the relationship between the units of mass in kilogram
and pound mass in the range of 50 kg to 120 kg. Use increments of 10 kg. Present
your work using the ideas discussed in this chapter and engineering paper.
2
©2016 Cengage Learning. All Rights Reserved. May not be scanned, copied or duplicated, or posted to a publicly accessible website, in whole or in part.
SOLUTION
Table 4.16 The relationship between the units of mass in kilograms and pound mass
mass (kg) mass (lbm)
50
110.2
60
132.3
70
154.3
80
176.4
90
198.4
100
220.5
110
242.5
120
264.6
4.17
Plot the following data: a model known as stopping sight distance is used by civil
engineers to design roadways. This simple model estimates the distance a driver
needs in order to stop his car traveling at a certain speed after detecting an hazard.
Present your work using the ideas discussed in this chapter and engineering
papers.
SOLUTION
Speed
(mph)
0
5
10
15
20
25
30
35
40
45
50
55
60
65
70
75
80
Speed
(ft/s)
0.0
7.3
14.7
22.0
29.3
36.7
44.0
51.3
58.7
66.0
73.3
80.7
88.0
95.3
102.7
110.0
117.3
Stopping Sight Distance (ft)
0
21
47
78
114
155
201
252
309
370
436
508
584
666
753
844
941
Figure 4.17 The stopping sight distance for a car traveling up to speed of 80 mph.
3
©2016 Cengage Learning. All Rights Reserved. May not be scanned, copied or duplicated, or posted to a publicly accessible website, in whole or in part.
4.18
Plot the following data: the velocity distribution for a flow of a fluid inside a pipe
with a radius of 0.1 m is given below. Present your work using the ideas discussed
in this chapter and engineering papers.
SOLUTION
r
u(r)
-0.1
-0.09
-0.08
-0.07
-0.06
-0.05
-0.04
-0.03
-0.02
-0.01
0
0.1
0.2
0.3
0.4
0.5
0.6
0.7
0.8
0.9
0.1
0
0.095
0.18
0.255
0.32
0.375
0.42
0.455
0.48
0.495
0.5
0.495
0.48
0.455
0.42
0.375
0.32
0.255
0.18
0.095
0
Figure 4.18 A fluid velocity distribution inside a pipe.
4.19
Plot the following data: Inn an annealing process – a process wherein materials
such as glass and metal are heated to high temperatures and then cooled slowly to
toughen them —thin steel plates are heated to temperatures of 900ºC and then
cooled in an environment with temperature of 35ºC. Present your work using the
ideas discussed in this chapter and engineering paper.
4
©2016 Cengage Learning. All Rights Reserved. May not be scanned, copied or duplicated, or posted to a publicly accessible website, in whole or in part.
SOLUTION
Time
(hr)
0
0.2
0.4
0.6
0.8
1
1.2
1.4
1.6
1.8
2
2.2
2.4
2.6
2.8
3
3.2
3.4
3.6
3.8
4
4.2
4.4
4.6
4.8
5
Temperature (ºC)
900
722
580
468
379
308
252
207
172
143
121
103
89
78
69
62
57
52
49
46
44
42
40
39
38
38
Figure 4.19 The cooling of a piece of metal
4.20 Plot the following data: the relationship between spring force and its deflection is
given below. Present your work using the ideas discussed in this chapter and engineering
paper.
5
©2016 Cengage Learning. All Rights Reserved. May not be scanned, copied or duplicated, or posted to a publicly accessible website, in whole or in part.
SOLUTION
X (mm)
0
5
10
15
20
F (N)
0
10
20
30
40
Figure 4.20 The relationship between a spring force and its deflection
6
©2016 Cengage Learning. All Rights Reserved. May not be scanned, copied or duplicated, or posted to a publicly accessible website, in whole or in part.