Getting started with python data analysis learn to use powerful python libraries for effective data processing and analysis
Bạn đang xem bản rút gọn của tài liệu. Xem và tải ngay bản đầy đủ của tài liệu tại đây (4.22 MB, 185 trang )
Getting Started with Python
Data Analysis
Learn to use powerful Python libraries for effective
data processing and analysis
Phuong Vo.T.H
Martin Czygan
BIRMINGHAM - MUMBAI
Getting Started with Python Data Analysis
Copyright © 2015 Packt Publishing
All rights reserved. No part of this book may be reproduced, stored in a retrieval
system, or transmitted in any form or by any means, without the prior written
permission of the publisher, except in the case of brief quotations embedded in
critical articles or reviews.
Every effort has been made in the preparation of this book to ensure the accuracy
of the information presented. However, the information contained in this book is
sold without warranty, either express or implied. Neither the authors, nor Packt
Publishing and its dealers and distributors will be held liable for any damages
caused or alleged to be caused directly or indirectly by this book.
Packt Publishing has endeavored to provide trademark information about all of the
companies and products mentioned in this book by the appropriate use of capitals.
However, Packt Publishing cannot guarantee the accuracy of this information.
First published: October 2015
Production reference: 1231015
Published by Packt Publishing Ltd.
Livery Place
35 Livery Street
Birmingham B3 2PB, UK.
ISBN 978-1-78528-511-0
www.packtpub.com
[ FM-2 ]
Credits
Authors
Copy Editors
Phuong Vo.T.H
Ting Baker
Martin Czygan
Trishya Hajare
Reviewers
Project Coordinator
Dong Chao
Sanjeet Rao
Hai Minh Nguyen
Proofreader
Kenneth Emeka Odoh
Safis Editing
Commissioning Editor
Indexer
Dipika Gaonkar
Priya Sane
Acquisition Editor
Production Coordinator
Harsha Bharwani
Nitesh Thakur
Content Development Editor
Shweta Pant
Cover Work
Nitesh Thakur
Technical Editor
Naveenkumar Jain
[ FM-3 ]
About the Authors
Phuong Vo.T.H has a MSc degree in computer science, which is related to
machine learning. After graduation, she continued to work in some companies
as a data scientist. She has experience in analyzing users' behavior and building
recommendation systems based on users' web histories. She loves to read machine
learning and mathematics algorithm books, as well as data analysis articles.
Martin Czygan studied German literature and computer science in Leipzig,
Germany. He has been working as a software engineer for more than 10 years. For
the past eight years, he has been diving into Python, and is still enjoying it. In recent
years, he has been helping clients to build data processing pipelines and search
and analytics systems. His consultancy can be found at .
[ FM-4 ]
About the Reviewers
Dong Chao is both a machine learning hacker and a programmer. He’s currently
conduct research on some Natural Language Processing field (sentiment analysis on
sequences data) with deep learning in Tsinghua University. Before that he worked
in XiaoMi one year ago, which is one of the biggest mobile communication
companies in the world. He also likes functional programming and has some
experience in Haskell and OCaml.
Hai Minh Nguyen is currently a postdoctoral researcher at Rutgers University.
He focuses on studying modified nucleic acid and designing Python interfaces for
C++ and the Fortran library for Amber, a popular bimolecular simulation package.
One of his notable achievements is the development of a pytraj program, a frontend
of a C++ library that is designed to perform analysis of simulation data
( />
Kenneth Emeka Odoh presented a Python conference talk at Pycon, Finland, in
2012, where he spoke about Data Visualization in Django to a packed audience. He
currently works as a graduate researcher at the University of Regina, Canada, in the
field of visual analytics. He is a polyglot with experience in developing applications
in C, C++, Python, and Java programming languages.
He has strong algorithmic and data mining skills. He is also a MOOC addict, as he
spends time learning new courses about the latest technology.
Currently, he is a masters student in the Department of Computer Science, and will
graduate in the fall of 2015. For more information, visit />in/kenluck2001. He has written a few research papers in the field of visual analytics
for a number of conferences and journals.
When Kenneth is not writing source code, you can find him singing at the Campion
College chant choir.
[ FM-5 ]
www.PacktPub.com
Support files, eBooks, discount offers, and more
For support files and downloads related to your book, please visit
www.PacktPub.com.
Did you know that Packt offers eBook versions of every book published, with PDF
and ePub files available? You can upgrade to the eBook version at www.PacktPub.
com and as a print book customer, you are entitled to a discount on the eBook copy.
Get in touch with us at for more details.
At www.PacktPub.com, you can also read a collection of free technical articles,
sign up for a range of free newsletters and receive exclusive discounts and offers
on Packt books and eBooks.
TM
/>
Do you need instant solutions to your IT questions? PacktLib is Packt's online digital
book library. Here, you can search, access, and read Packt's entire library of books.
Why subscribe?
• Fully searchable across every book published by Packt
• Copy and paste, print, and bookmark content
• On demand and accessible via a web browser
Free access for Packt account holders
If you have an account with Packt at www.PacktPub.com, you can use this to access
PacktLib today and view 9 entirely free books. Simply use your login credentials for
immediate access.
[ FM-6 ]
Table of Contents
Prefacev
Chapter 1: Introducing Data Analysis and Libraries
1
Data analysis and processing
2
An overview of the libraries in data analysis
5
Python libraries in data analysis
7
NumPy8
Pandas8
Matplotlib9
PyMongo9
The scikit-learn library
9
Summary9
Chapter 2: NumPy Arrays and Vectorized Computation
11
NumPy arrays
12
Data types
12
Array creation
14
Indexing and slicing
16
Fancy indexing
17
Numerical operations on arrays
18
Array functions
19
Data processing using arrays
21
Loading and saving data
22
Saving an array
22
Loading an array
23
Linear algebra with NumPy
24
NumPy random numbers
25
Summary28
[i]
Table of Contents
Chapter 3: Data Analysis with Pandas
31
Chapter 4: Data Visualization
59
Chapter 5: Time Series
83
An overview of the Pandas package
31
The Pandas data structure
32
Series32
The DataFrame
34
The essential basic functionality
38
38
Reindexing and altering labels
Head and tail
39
Binary operations
40
41
Functional statistics
Function application
43
Sorting44
Indexing and selecting data
46
Computational tools
47
Working with missing data
49
Advanced uses of Pandas for data analysis
52
Hierarchical indexing
52
The Panel data
54
Summary56
The matplotlib API primer
60
Line properties
63
Figures and subplots
65
Exploring plot types
68
Scatter plots
68
Bar plots
69
Contour plots
70
Histogram plots
72
Legends and annotations
73
Plotting functions with Pandas
76
Additional Python data visualization tools
78
Bokeh79
MayaVi79
Summary81
Time series primer
Working with date and time objects
Resampling time series
[ ii ]
83
84
92
Table of Contents
Downsampling time series data
92
Upsampling time series data
95
97
Time zone handling
Timedeltas98
Time series plotting
99
Summary103
Chapter 6: Interacting with Databases
105
Chapter 7: Data Analysis Application Examples
125
Chapter 8: Machine Learning Models with scikit-learn
145
Interacting with data in text format
105
Reading data from text format
105
110
Writing data to text format
Interacting with data in binary format
111
HDF5112
Interacting with data in MongoDB
113
Interacting with data in Redis
118
The simple value
118
List119
Set120
Ordered set
121
Summary122
Data munging
126
Cleaning data
128
Filtering131
134
Merging data
Reshaping data
137
Data aggregation
139
Grouping data
142
Summary144
An overview of machine learning models
145
The scikit-learn modules for different models
146
Data representation in scikit-learn
148
Supervised learning – classification and regression
150
Unsupervised learning – clustering and dimensionality reduction
156
Measuring prediction performance
160
Summary162
Index165
[ iii ]
Preface
The world generates data at an increasing pace. Consumers, sensors, or scientific
experiments emit data points every day. In finance, business, administration and the
natural or social sciences, working with data can make up a significant part of the job.
Being able to efficiently work with small or large datasets has become a valuable skill.
There are a variety of applications to work with data, from spreadsheet applications,
which are widely deployed and used, to more specialized statistical packages for
experienced users, which often support domain-specific extensions for experts.
Python started as a general purpose language. It has been used in industry for a
long time, but it has been popular among researchers as well. Around ten years
ago, in 2006, the first version of NumPy was released, which made Python a first
class language for numerical computing and laid the foundation for a prospering
development, which led to what we today call the PyData ecosystem: A growing
set of high-performance libraries to be used in the sciences, finance, business or
anywhere else you want to work efficiently with datasets.
In contrast to more specialized applications and environments, Python is not
only about data analysis. The list of industrial-strength libraries for many general
computing tasks is long, which makes working with data in Python even more
compelling. Whether your data lives inside SQL or NoSQL databases or is out there
on the Web and must be crawled or scraped first, the Python community has already
developed packages for many of those tasks.
[v]
Preface
And the outlook seems bright. Working with bigger datasets is getting simpler and
sharing research findings and creating interactive programming notebooks has never
been easier. It is the perfect moment to learn about data analysis in Python. This
book lets you get started with a few core libraries of the PyData ecosystem: Numpy,
Pandas, and matplotlib. In addition, two NoSQL databases are introduced. The final
chapter will take a quick tour through one of the most popular machine learning
libraries in Python.
We hope you find Python a valuable tool for your everyday data work and that we
can give you enough material to get productive in the data analysis space quickly.
What this book covers
Chapter 1, Introducing Data Analysis and Libraries, describes the typical steps involved
in a data analysis task. In addition, a couple of existing data analysis software
packages are described.
Chapter 2, NumPy Arrays and Vectorized Computation, dives right into the core of
the PyData ecosystem by introducing the NumPy package for high-performance
computing. The basic data structure is a typed multidimensional array which
supports various functions, among them typical linear algebra tasks. The data
structure and functions are explained along with examples.
Chapter 3, Data Analysis with Pandas, introduces a prominent and popular data
analysis library for Python called Pandas. It is built on NumPy, but makes a lot
of real-world tasks simpler. Pandas comes with its own core data structures,
which are explained in detail.
Chapter 4, Data Visualizaiton, focuses on another important aspect of data analysis:
the understanding of data through graphical representations. The Matplotlib
library is introduced in this chapter. It is one of the most popular 2D plotting
libraries for Python and it is well integrated with Pandas as well.
Chapter 5, Time Series, shows how to work with time-oriented data in Pandas. Date
and time handling can quickly become a difficult, error-prone task when implemented
from scratch. We show how Pandas can be of great help there, by looking in detail at
some of the functions for date parsing and date sequence generation.
Chapter 6, Interacting with Databases, deals with some typical scenarios. Your data
does not live in vacuum, and it might not always be available as CSV files either.
MongoDB is a NoSQL database and Redis is a data structure server, although many
people think of it as a key value store first. Both storage systems are introduced to
help you interact with data from real-world systems.
[ vi ]
Preface
Chapter 7, Data Analysis Application Examples, applies many of the things covered
in the previous chapters to deepen your understanding of typical data analysis
workflows. How do you clean, inspect, reshape, merge, or group data – these are the
concerns in this chapter. The library of choice in the chapter will be Pandas again.
Chapter 8, Machine Learning Models with scikit-learn, would like to make you familiar
with a popular machine learning package for Python. While it supports dozens of
models, we only look at four models, two supervised and two unsupervised. Even if
this is not mentioned explicitly, this chapter brings together a lot of the existing tools.
Pandas is often used for machine learning data preparation and matplotlib is used
to create plots to facilitate understanding.
What you need for this book
There are not too many requirements to get started. You will need a Python
programming environment installed on your system. Under Linux and Mac OS X,
Python is usually installed by default. Installation on Windows is supported by an
excellent installer provided and maintained by the community.
This book uses a recent Python 2, but many examples will work with Python 3
as well.
The versions of the libraries used in this book are the following: NumPy 1.9.2,
Pandas 0.16.2, matplotlib 1.4.3, tables 3.2.2, pymongo 3.0.3, redis 2.10.3, and
scikit-learn 0.16.1. As these packages are all hosted on PyPI, the Python package
index, they can be easily installed with pip. To install NumPy, you would write:
$ pip install numpy
If you are not using them already, we suggest you take a look at virtual
environments for managing isolating Python environment on your computer.
For Python 2, there are two packages of interest there: virtualenv and
virtualenvwrapper. Since Python 3.3, there is a tool in the standard library called
pyvenv ( which serves the
same purpose.
Most libraries will have an attribute for the version, so if you already have a library
installed, you can quickly check its version:
>>> import redis
>>> redis.__version__
'2.10.3'
[ vii ]
Preface
This works well for most libraries. A few, such as pymongo, use a different attribute
(pymongo uses just version, without the underscores).
While all the examples can be run interactively in a Python shell, we recommend
using IPython. IPython started as a more versatile Python shell, but has since
evolved into a powerful tool for exploration and sharing. We used IPython 4.0.0 with
Python 2.7.10. IPython is a great way to work interactively with Python, be it in the
terminal or in the browser.
Who this book is for
We assume you have been exposed to programming and Python and you want
to broaden your horizons and get to know some key libraries in the data analysis
field. We think that people with different backgrounds can benefit from this book.
If you work in business, finance, in research and development at a lab or university,
or if your work contains any data processing or analysis steps and you want know
what Python has to offer, then this book can be of help. If you want to get started
with basic data processing tasks or time series, then you can find lot of hands-on
knowledge in the examples of this book. The strength of this book is its breadth.
While we cannot dive very deep into a single package – although we will use Pandas
extensively - we hope that we can convey a bigger picture: how the different parts
of the Python data ecosystem work and can work together to form one of the most
innovative and engaging programming environments.
Conventions
In this book, you will find a number of styles of text that distinguish between
different kinds of information. Here are some examples of these styles, and an
explanation of their meaning.
Code words in text, database table names, folder names, filenames, file extensions,
pathnames, dummy URLs, user input, and Twitter handles are shown as follows:
"We can include other contexts through the use of the include directive."
A block of code is set as follows:
>>> import numpy as np
>>> np.random.randn()
When we wish to draw your attention to a particular part of a code block, the
relevant lines or items are set in bold:
>>> import pandas as pd
[ viii ]
Preface
Any command-line input or output is written as follows:
$ cat "data analysis" | wc -l
New terms and important words are shown in bold. Words that you see on the
screen, in menus or dialog boxes for example, appear in the text like this: "clicking
the Next button moves you to the next screen".
Warnings or important notes appear in a box like this.
Tips and tricks appear like this.
Reader feedback
Feedback from our readers is always welcome. Let us know what you think about
this book—what you liked or may have disliked. Reader feedback is important for us
to develop titles that you really get the most out of.
To send us general feedback, simply send an e-mail to ,
and mention the book title via the subject of your message.
If there is a topic that you have expertise in and you are interested in either writing
or contributing to a book, see our author guide on www.packtpub.com/authors.
Customer support
Now that you are the proud owner of a Packt book, we have a number of things to
help you to get the most from your purchase.
Downloading the example code
You can download the example code files for all Packt books you have purchased
from your account at . If you purchased this book
elsewhere, you can visit and register to have
the files e-mailed directly to you.
[ ix ]
Preface
Errata
Although we have taken every care to ensure the accuracy of our content, mistakes
do happen. If you find a mistake in one of our books—maybe a mistake in the text or
the code—we would be grateful if you would report this to us. By doing so, you can
save other readers from frustration and help us improve subsequent versions of this
book. If you find any errata, please report them by visiting ktpub.
com/submit-errata, selecting your book, clicking on the errata submission form link,
and entering the details of your errata. Once your errata are verified, your submission
will be accepted and the errata will be uploaded on our website, or added to any list of
existing errata, under the Errata section of that title. Any existing errata can be viewed
by selecting your title from />
Piracy
Piracy of copyright material on the Internet is an ongoing problem across all media.
At Packt, we take the protection of our copyright and licenses very seriously. If you
come across any illegal copies of our works, in any form, on the Internet, please
provide us with the location address or website name immediately so that we can
pursue a remedy.
Please contact us at with a link to the suspected
pirated material.
We appreciate your help in protecting our authors, and our ability to bring
you valuable content.
Questions
You can contact us at if you are having a problem with
any aspect of the book, and we will do our best to address it.
[x]
Introducing Data Analysis
and Libraries
Data is raw information that can exist in any form, usable or not. We can easily get
data everywhere in our lives; for example, the price of gold on the day of writing
was $ 1.158 per ounce. This does not have any meaning, except describing the price
of gold. This also shows that data is useful based on context.
With the relational data connection, information appears and allows us to expand
our knowledge beyond the range of our senses. When we possess gold price data
gathered over time, one piece of information we might have is that the price has
continuously risen from $1.152 to $1.158 over three days. This could be used by
someone who tracks gold prices.
Knowledge helps people to create value in their lives and work. This value is
based on information that is organized, synthesized, or summarized to enhance
comprehension, awareness, or understanding. It represents a state or potential for
action and decisions. When the price of gold continuously increases for three days, it
will likely decrease on the next day; this is useful knowledge.
[1]
Introducing Data Analysis and Libraries
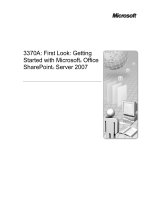
The following figure illustrates the steps from data to knowledge; we call this
process, the data analysis process and we will introduce it in the next section:
Decision making
Synthesising
Knowledge
Gold price will slightly
decrease on next day
Analysing
Summarizing
Gold price has risen
for three days
Information
organizing
Data
Gold price today is 1158$
Collecting
In this chapter, we will cover the following topics:
• Data analysis and process
• An overview of libraries in data analysis using different programming
languages
• Common Python data analysis libraries
Data analysis and processing
Data is getting bigger and more diverse every day. Therefore, analyzing and
processing data to advance human knowledge or to create value is a big challenge.
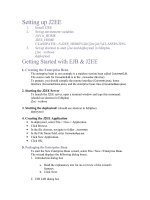
To tackle these challenges, you will need domain knowledge and a variety of skills,
drawing from areas such as computer science, artificial intelligence (AI) and
machine learning (ML), statistics and mathematics, and knowledge domain, as
shown in the following figure:
[2]
Chapter 1
Artificial
Intelligent &
Machine
Learning
Pr
s
hm
rit
go ....
Al
og
ra
... mm
.
in
g
Computer
Science
Data Analysis
se
rti
pe
ex ..
..
M
a
... th
.
ta
Da
Knowledge
Domain
Statistics &
Mathematics
Let's go through data analysis and its domain knowledge:
• Computer science: We need this knowledge to provide abstractions for
efficient data processing. Basic Python programming experience is required
to follow the next chapters. We will introduce Python libraries used in data
analysis.
• Artificial intelligence and machine learning: If computer science knowledge
helps us to program data analysis tools, artificial intelligence and machine
learning help us to model the data and learn from it in order to build smart
products.
• Statistics and mathematics: We cannot extract useful information from raw
data if we do not use statistical techniques or mathematical functions.
• Knowledge domain: Besides technology and general techniques, it is
important to have an insight into the specific domain. What do the data fields
mean? What data do we need to collect? Based on the expertise, we explore
and analyze raw data by applying the above techniques, step by step.
[3]
Introducing Data Analysis and Libraries
Data analysis is a process composed of the following steps:
• Data requirements: We have to define what kind of data will be collected
based on the requirements or problem analysis. For example, if we want to
detect a user's behavior while reading news on the internet, we should be
aware of visited article links, dates and times, article categories, and the time
the user spends on different pages.
• Data collection: Data can be collected from a variety of sources: mobile,
personal computer, camera, or recording devices. It may also be obtained in
different ways: communication, events, and interactions between person and
person, person and device, or device and device. Data appears whenever and
wherever in the world. The problem is how we can find and gather it to solve
our problem? This is the mission of this step.
• Data processing: Data that is initially obtained must be processed or
organized for analysis. This process is performance-sensitive. How fast can
we create, insert, update, or query data? When building a real product that
has to process big data, we should consider this step carefully. What kind of
database should we use to store data? What kind of data structure, such as
analysis, statistics, or visualization, is suitable for our purposes?
• Data cleaning: After being processed and organized, the data may still
contain duplicates or errors. Therefore, we need a cleaning step to reduce
those situations and increase the quality of the results in the following
steps. Common tasks include record matching, deduplication, and column
segmentation. Depending on the type of data, we can apply several types of
data cleaning. For example, a user's history of visits to a news website might
contain a lot of duplicate rows, because the user might have refreshed certain
pages many times. For our specific issue, these rows might not carry any
meaning when we explore the user's behavior so we should remove them
before saving it to our database. Another situation we may encounter is click
fraud on news—someone just wants to improve their website ranking or
sabotage a website. In this case, the data will not help us to explore a user's
behavior. We can use thresholds to check whether a visit page event comes
from a real person or from malicious software.
• Exploratory data analysis: Now, we can start to analyze data through a
variety of techniques referred to as exploratory data analysis. We may detect
additional problems in data cleaning or discover requests for further data.
Therefore, these steps may be iterative and repeated throughout the whole
data analysis process. Data visualization techniques are also used to examine
the data in graphs or charts. Visualization often facilitates understanding of
data sets, especially if they are large or high-dimensional.
[4]
Chapter 1
• Modelling and algorithms: A lot of mathematical formulas and algorithms
may be applied to detect or predict useful knowledge from the raw data. For
example, we can use similarity measures to cluster users who have exhibited
similar news-reading behavior and recommend articles of interest to them
next time. Alternatively, we can detect users' genders based on their news
reading behavior by applying classification models such as the Support
Vector Machine (SVM) or linear regression. Depending on the problem, we
may use different algorithms to get an acceptable result. It can take a lot of
time to evaluate the accuracy of the algorithms and choose the best one to
implement for a certain product.
• Data product: The goal of this step is to build data products that receive data
input and generate output according to the problem requirements. We will
apply computer science knowledge to implement our selected algorithms as
well as manage the data storage.
An overview of the libraries in data
analysis
There are numerous data analysis libraries that help us to process and analyze data.
They use different programming languages, and have different advantages and
disadvantages of solving various data analysis problems. Now, we will introduce
some common libraries that may be useful for you. They should give you an
overview of the libraries in the field. However, the rest of this book focuses on
Python-based libraries.
Some of the libraries that use the Java language for data analysis are as follows:
• Weka: This is the library that I became familiar with the first time I learned
about data analysis. It has a graphical user interface that allows you to run
experiments on a small dataset. This is great if you want to get a feel for what
is possible in the data processing space. However, if you build a complex
product, I think it is not the best choice, because of its performance, sketchy
API design, non-optimal algorithms, and little documentation (http://www.
cs.waikato.ac.nz/ml/weka/).
[5]
Introducing Data Analysis and Libraries
• Mallet: This is another Java library that is used for statistical natural
language processing, document classification, clustering, topic modeling,
information extraction, and other machine-learning applications on text.
There is an add-on package for Mallet, called GRMM, that contains support
for inference in general, graphical models, and training of Conditional
random fields (CRF) with arbitrary graphical structures. In my experience,
the library performance and the algorithms are better than Weka. However,
its only focus is on text-processing problems. The reference page is at
/>• Mahout: This is Apache's machine-learning framework built on top of
Hadoop; its goal is to build a scalable machine-learning library. It looks
promising, but comes with all the baggage and overheads of Hadoop.
The homepage is at />• Spark: This is a relatively new Apache project, supposedly up to a hundred
times faster than Hadoop. It is also a scalable library that consists of common
machine-learning algorithms and utilities. Development can be done in
Python as well as in any JVM language. The reference page is at
/>Here are a few libraries that are implemented in C++:
• Vowpal Wabbit: This library is a fast, out-of-core learning system sponsored
by Microsoft Research and, previously, Yahoo! Research. It has been
used to learn a tera-feature (1012) dataset on 1,000 nodes in one hour.
More information can be found in the publication at />abs/1110.4198.
• MultiBoost: This package is a multiclass, multi label, and multitask
classification boosting software implemented in C++. If you use
this software, you should refer to the paper published in 2012 in the
JournalMachine Learning Research, MultiBoost: A Multi-purpose Boosting
Package, D.Benbouzid, R. Busa-Fekete, N. Casagrande, F.-D. Collin, and B. Kégl.
• MLpack: This is also a C++ machine-learning library, developed by the
Fundamental Algorithmic and Statistical Tools Laboratory (FASTLab)
at Georgia Tech. It focusses on scalability, speed, and ease-of-use, and was
presented at the BigLearning workshop of NIPS 2011. Its homepage is at
/>• Caffe: The last C++ library we want to mention is Caffe. This is a deep
learning framework made with expression, speed, and modularity in mind.
It is developed by the Berkeley Vision and Learning Center (BVLC) and
community contributors. You can find more information about it at
/>[6]
Chapter 1
Other libraries for data processing and analysis are as follows:
• Statsmodels: This is a great Python library for statistical modeling and is
mainly used for predictive and exploratory analysis.
• Modular toolkit for data processing (MDP): This is a collection of
supervised and unsupervised learning algorithms and other data processing
units that can be combined into data processing sequences and more complex
feed-forward network architectures (rceforge.
net/index.html).
• Orange: This is an open source data visualization and analysis for novices
and experts. It is packed with features for data analysis and has add-ons
for bioinformatics and text mining. It contains an implementation of
self-organizing maps, which sets it apart from the other projects as well
( />• Mirador: This is a tool for the visual exploration of complex datasets,
supporting Mac and Windows. It enables users to discover correlation patterns
and derive new hypotheses from data ( />• RapidMiner: This is another GUI-based tool for data mining, machine
learning, and predictive analysis ( />• Theano: This bridges the gap between Python and lower-level languages.
Theano gives very significant performance gains, particularly for large
matrix operations, and is, therefore, a good choice for deep learning models.
However, it is not easy to debug because of the additional compilation layer.
• Natural language processing toolkit (NLTK): This is written in Python with
very unique and salient features.
Here, I could not list all libraries for data analysis. However, I think the above
libraries are enough to take a lot of your time to learn and build data analysis
applications. I hope you will enjoy them after reading this book.
Python libraries in data analysis
Python is a multi-platform, general-purpose programming language that can run
on Windows, Linux/Unix, and Mac OS X, and has been ported to Java and .NET
virtual machines as well. It has a powerful standard library. In addition, it has
many libraries for data analysis: Pylearn2, Hebel, Pybrain, Pattern, MontePython,
and MILK. In this book, we will cover some common Python data analysis libraries
such as Numpy, Pandas, Matplotlib, PyMongo, and scikit-learn. Now, to help you
get started, I will briefly present an overview of each library for those who are less
familiar with the scientific Python stack.
[7]
Introducing Data Analysis and Libraries
NumPy
One of the fundamental packages used for scientific computing in Python is Numpy.
Among other things, it contains the following:
• A powerful N-dimensional array object
• Sophisticated (broadcasting) functions for performing array computations
• Tools for integrating C/C++ and Fortran code
• Useful linear algebra operations, Fourier transformations, and random
number capabilities
Besides this, it can also be used as an efficient multidimensional container of
generic data. Arbitrary data types can be defined and integrated with a wide
variety of databases.
Pandas
Pandas is a Python package that supports rich data structures and functions for
analyzing data, and is developed by the PyData Development Team. It is focused on
the improvement of Python's data libraries. Pandas consists of the following things:
• A set of labeled array data structures; the primary of which are Series,
DataFrame, and Panel
• Index objects enabling both simple axis indexing and multilevel/hierarchical
axis indexing
• An intergraded group by engine for aggregating and transforming datasets
• Date range generation and custom date offsets
• Input/output tools that load and save data from flat files or PyTables/HDF5
format
• Optimal memory versions of the standard data structures
• Moving window statistics and static and moving window linear/panel
regression
Due to these features, Pandas is an ideal tool for systems that need complex
data structures or high-performance time series functions such as financial data
analysis applications.
[8]