Introduction to probability dimitri bertsekas and john n
Bạn đang xem bản rút gọn của tài liệu. Xem và tải ngay bản đầy đủ của tài liệu tại đây (1.66 MB, 285 trang )
LECTURE NOTES
Course 6.041-6.431
M.I.T.
FALL 2000
Introduction to Probability
Dimitri P. Bertsekas and John N. Tsitsiklis
Professors of Electrical Engineering and Computer Science
Massachusetts Institute of Technology
Cambridge, Massachusetts
These notes are copyright-protected but may be freely distributed for
instructional nonprofit pruposes.
Contents
1. Sample Space and Probability
1.1.
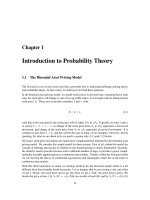
1.2.
1.3.
1.4.
1.5.
1.6.
1.7.
Sets . . . . . . . . . .
Probabilistic Models . . .
Conditional Probability .
Independence . . . . . .
Total Probability Theorem
Counting . . . . . . .
Summary and Discussion
2. Discrete Random Variables
2.1.
2.2.
2.3.
2.4.
2.5.
2.6.
2.7.
2.8.
. .
. .
. .
. .
and
. .
. .
. . .
. . .
. . .
. . .
Bayes’
. . .
. . .
. . .
. . .
. . .
. . .
Rule
. . .
. . .
.
.
.
.
.
.
.
.
.
.
.
.
.
.
.
.
.
.
.
.
.
.
.
.
.
.
.
.
.
.
.
.
.
.
.
.
.
.
.
.
.
.
.
.
.
.
.
.
.
.
.
.
.
.
.
.
.
.
.
.
.
.
.
.
.
.
.
.
.
.
.
.
.
.
.
.
.
.
.
.
.
.
.
.
. . . . . . . . . . . . . . . . .
Basic Concepts . . . . . . . . . . . .
Probability Mass Functions . . . . . .
Functions of Random Variables . . . . .
Expectation, Mean, and Variance . . . .
Joint PMFs of Multiple Random Variables
Conditioning . . . . . . . . . . . . .
Independence . . . . . . . . . . . . .
Summary and Discussion . . . . . . .
3. General Random Variables
3.1.
3.2.
3.3.
3.4.
3.5.
3.6.
3.7.
. . . . . . . . . . . . . . . .
.
.
.
.
.
.
.
.
.
.
.
.
.
.
.
.
.
.
.
.
.
.
.
.
.
.
.
.
.
.
.
.
.
.
.
.
.
.
.
.
.
.
.
.
.
.
.
.
.
.
.
.
.
.
.
.
.
.
.
.
.
.
.
.
.
.
.
.
.
.
.
.
.
.
.
.
.
.
.
.
.
.
.
.
.
.
.
.
.
.
.
.
.
.
.
.
.
.
.
.
.
.
.
.
. . . . . . . . . . . . . . . . .
Continuous Random Variables and PDFs
Cumulative Distribution Functions . . .
Normal Random Variables . . . . . . .
Conditioning on an Event . . . . . . .
Multiple Continuous Random Variables .
Derived Distributions . . . . . . . . .
Summary and Discussion . . . . . . .
.
.
.
.
.
.
.
.
.
.
.
.
.
.
.
.
.
.
.
.
.
.
.
.
.
.
.
.
.
.
.
.
.
.
.
.
.
.
.
.
.
.
.
.
.
.
.
.
.
.
.
.
.
.
.
.
.
.
.
.
.
.
.
.
.
.
.
.
.
.
.
.
.
.
.
.
.
.
.
.
.
.
.
.
.
.
.
.
.
.
.
4. Further Topics on Random Variables and Expectations . . . . . .
4.1. Transforms . . . . . . . . . . . . . . . . . . . . . . . . . . .
4.2. Sums of Independent Random Variables - Convolutions . . . . . . .
iii
iv
4.3.
4.4.
4.5.
4.6.
4.7.
Contents
Conditional Expectation as a Random Variable . .
Sum of a Random Number of Independent Random
Covariance and Correlation . . . . . . . . . .
Least Squares Estimation . . . . . . . . . . .
The Bivariate Normal Distribution . . . . . . .
. . . .
Variables
. . . .
. . . .
. . . .
. .
.
. .
. .
. .
.
.
.
.
.
.
.
.
.
.
.
.
.
.
.
5. The Bernoulli and Poisson Processes . . . . . . . . . . . . . .
5.1. The Bernoulli Process . . . . . . . . . . . . . . . . . . . . . .
5.2. The Poisson Process . . . . . . . . . . . . . . . . . . . . . . .
6. Markov Chains . . . . . . . . . . . . . . . . . . . . . . .
6.1.
6.2.
6.3.
6.4.
6.5.
Discrete-Time Markov Chains . . . . . .
Classification of States . . . . . . . . . .
Steady-State Behavior . . . . . . . . . .
Absorption Probabilities and Expected Time
More General Markov Chains . . . . . . .
.
.
.
to
.
. . . . . .
. . . . . .
. . . . . .
Absorption
. . . . . .
.
.
.
.
.
.
.
.
.
.
.
.
.
.
.
.
.
.
.
.
.
.
.
.
.
7. Limit Theorems . . . . . . . . . . . . . . . . . . . . . . .
7.1.
7.2.
7.3.
7.4.
7.5.
Some Useful Inequalities . . . . .
The Weak Law of Large Numbers .
Convergence in Probability . . . .
The Central Limit Theorem . . .
The Strong Law of Large Numbers
.
.
.
.
.
.
.
.
.
.
.
.
.
.
.
.
.
.
.
.
.
.
.
.
.
.
.
.
.
.
.
.
.
.
.
.
.
.
.
.
.
.
.
.
.
.
.
.
.
.
.
.
.
.
.
.
.
.
.
.
.
.
.
.
.
.
.
.
.
.
.
.
.
.
.
.
.
.
.
.
Preface
These class notes are the currently used textbook for “Probabilistic Systems
Analysis,” an introductory probability course at the Massachusetts Institute of
Technology. The text of the notes is quite polished and complete, but the problems are less so.
The course is attended by a large number of undergraduate and graduate
students with diverse backgrounds. Acccordingly, we have tried to strike a balance between simplicity in exposition and sophistication in analytical reasoning.
Some of the more mathematically rigorous analysis has been just sketched or
intuitively explained in the text, so that complex proofs do not stand in the way
of an otherwise simple exposition. At the same time, some of this analysis and
the necessary mathematical results are developed (at the level of advanced calculus) in theoretical problems, which are included at the end of the corresponding
chapter. The theoretical problems (marked by *) constitute an important component of the text, and ensure that the mathematically oriented reader will find
here a smooth development without major gaps.
We give solutions to all the problems, aiming to enhance the utility of
the notes for self-study. We have additional problems, suitable for homework
assignment (with solutions), which we make available to instructors.
Our intent is to gradually improve and eventually publish the notes as a
textbook, and your comments will be appreciated
Dimitri P. Bertsekas
John N. Tsitsiklis
v
1
Sample Space and
Probability
Contents
1.1.
1.2.
1.3.
1.4.
1.5.
1.6.
1.7.
Sets . . . . . . . . . .
Probabilistic Models . . .
Conditional Probability .
Total Probability Theorem
Independence . . . . . .
Counting . . . . . . .
Summary and Discussion
. .
. .
. .
and
. .
. .
. .
. . .
. . .
. . .
Bayes’
. . .
. . .
. . .
. . .
. . .
. . .
Rule
. . .
. . .
. . .
.
.
.
.
.
.
.
.
.
.
.
.
.
.
.
.
.
.
.
.
.
.
.
.
.
.
.
.
.
.
.
.
.
.
.
.
.
.
.
.
.
.
.
.
.
.
.
.
.
.
.
.
.
.
.
.
. p. 3
. p. 6
p. 16
p. 25
p. 31
p. 41
p. 48
1
2
Sample Space and Probability
Chap. 1
“Probability” is a very useful concept, but can be interpreted in a number of
ways. As an illustration, consider the following.
A patient is admitted to the hospital and a potentially life-saving drug is
administered. The following dialog takes place between the nurse and a
concerned relative.
RELATIVE: Nurse, what is the probability that the drug will work?
NURSE: I hope it works, we’ll know tomorrow.
RELATIVE: Yes, but what is the probability that it will?
NURSE: Each case is different, we have to wait.
RELATIVE: But let’s see, out of a hundred patients that are treated under
similar conditions, how many times would you expect it to work?
NURSE (somewhat annoyed): I told you, every person is different, for some
it works, for some it doesn’t.
RELATIVE (insisting): Then tell me, if you had to bet whether it will work
or not, which side of the bet would you take?
NURSE (cheering up for a moment): I’d bet it will work.
RELATIVE (somewhat relieved): OK, now, would you be willing to lose
two dollars if it doesn’t work, and gain one dollar if it does?
NURSE (exasperated): What a sick thought! You are wasting my time!
In this conversation, the relative attempts to use the concept of probability to
discuss an uncertain situation. The nurse’s initial response indicates that the
meaning of “probability” is not uniformly shared or understood, and the relative
tries to make it more concrete. The first approach is to define probability in
terms of frequency of occurrence, as a percentage of successes in a moderately
large number of similar situations. Such an interpretation is often natural. For
example, when we say that a perfectly manufactured coin lands on heads “with
probability 50%,” we typically mean “roughly half of the time.” But the nurse
may not be entirely wrong in refusing to discuss in such terms. What if this
was an experimental drug that was administered for the very first time in this
hospital or in the nurse’s experience?
While there are many situations involving uncertainty in which the frequency interpretation is appropriate, there are other situations in which it is
not. Consider, for example, a scholar who asserts that the Iliad and the Odyssey
were composed by the same person, with probability 90%. Such an assertion
conveys some information, but not in terms of frequencies, since the subject is
a one-time event. Rather, it is an expression of the scholar’s subjective belief. One might think that subjective beliefs are not interesting, at least from a
mathematical or scientific point of view. On the other hand, people often have
to make choices in the presence of uncertainty, and a systematic way of making
use of their beliefs is a prerequisite for successful, or at least consistent, decision
Sec. 1.1
Sets
3
making.
In fact, the choices and actions of a rational person, can reveal a lot about
the inner-held subjective probabilities, even if the person does not make conscious
use of probabilistic reasoning. Indeed, the last part of the earlier dialog was an
attempt to infer the nurse’s beliefs in an indirect manner. Since the nurse was
willing to accept a one-for-one bet that the drug would work, we may infer
that the probability of success was judged to be at least 50%. And had the
nurse accepted the last proposed bet (two-for-one), that would have indicated a
success probability of at least 2/3.
Rather than dwelling further into philosophical issues about the appropriateness of probabilistic reasoning, we will simply take it as a given that the theory
of probability is useful in a broad variety of contexts, including some where the
assumed probabilities only reflect subjective beliefs. There is a large body of
successful applications in science, engineering, medicine, management, etc., and
on the basis of this empirical evidence, probability theory is an extremely useful
tool.
Our main objective in this book is to develop the art of describing uncertainty in terms of probabilistic models, as well as the skill of probabilistic
reasoning. The first step, which is the subject of this chapter, is to describe
the generic structure of such models, and their basic properties. The models we
consider assign probabilities to collections (sets) of possible outcomes. For this
reason, we must begin with a short review of set theory.
1.1 SETS
Probability makes extensive use of set operations, so let us introduce at the
outset the relevant notation and terminology.
A set is a collection of objects, which are the elements of the set. If S is
a set and x is an element of S, we write x ∈ S. If x is not an element of S, we
write x ∈
/ S. A set can have no elements, in which case it is called the empty
set, denoted by Ø.
Sets can be specified in a variety of ways. If S contains a finite number of
elements, say x1 , x2 , . . . , xn , we write it as a list of the elements, in braces:
S = {x1 , x2 , . . . , xn }.
For example, the set of possible outcomes of a die roll is {1, 2, 3, 4, 5, 6}, and the
set of possible outcomes of a coin toss is {H, T }, where H stands for “heads”
and T stands for “tails.”
If S contains infinitely many elements x1 , x2 , . . ., which can be enumerated
in a list (so that there are as many elements as there are positive integers) we
write
S = {x1 , x2 , . . .},
4
Sample Space and Probability
Chap. 1
and we say that S is countably infinite. For example, the set of even integers
can be written as {0, 2, −2, 4, −4, . . .}, and is countably infinite.
Alternatively, we can consider the set of all x that have a certain property
P , and denote it by
{x | x satisfies P }.
(The symbol “|” is to be read as “such that.”) For example the set of even
integers can be written as {k | k/2 is integer}. Similarly, the set of all scalars x
in the interval [0, 1] can be written as {x | 0 ≤ x ≤ 1}. Note that the elements x
of the latter set take a continuous range of values, and cannot be written down
in a list (a proof is sketched in the theoretical problems); such a set is said to be
uncountable.
If every element of a set S is also an element of a set T , we say that S
is a subset of T , and we write S ⊂ T or T ⊃ S. If S ⊂ T and T ⊂ S, the
two sets are equal, and we write S = T . It is also expedient to introduce a
universal set, denoted by Ω, which contains all objects that could conceivably
be of interest in a particular context. Having specified the context in terms of a
universal set Ω, we only consider sets S that are subsets of Ω.
Set Operations
The complement of a set S, with respect to the universe Ω, is the set {x ∈
Ω|x ∈
/ S} of all elements of Ω that do not belong to S, and is denoted by S c .
Note that Ωc = Ø.
The union of two sets S and T is the set of all elements that belong to S
or T (or both), and is denoted by S ∪ T . The intersection of two sets S and T
is the set of all elements that belong to both S and T , and is denoted by S ∩ T .
Thus,
S ∪ T = {x | x ∈ S or x ∈ T },
S ∩ T = {x | x ∈ S and x ∈ T }.
In some cases, we will have to consider the union or the intersection of several,
even infinitely many sets, defined in the obvious way. For example, if for every
positive integer n, we are given a set Sn , then
∞
Sn = S1 ∪ S2 ∪ · · · = {x | x ∈ Sn for some n},
n=1
and
∞
Sn = S1 ∩ S2 ∩ · · · = {x | x ∈ Sn for all n}.
n=1
Two sets are said to be disjoint if their intersection is empty. More generally,
several sets are said to be disjoint if no two of them have a common element. A
collection of sets is said to be a partition of a set S if the sets in the collection
are disjoint and their union is S.
Sec. 1.1
Sets
5
If x and y are two objects, we use (x, y) to denote the ordered pair of x
and y. The set of scalars (real numbers) is denoted by ; the set of pairs (or
triplets) of scalars, i.e., the two-dimensional plane (or three-dimensional space,
respectively) is denoted by 2 (or 3 , respectively).
Sets and the associated operations are easy to visualize in terms of Venn
diagrams, as illustrated in Fig. 1.1.
Ω
Ω
S
Ω
S
S
T
T
T
(b)
(a)
(c)
Ω
Ω
T
U
S
U
T
(d)
Ω
T
S
S
(e)
(f)
Figure 1.1: Examples of Venn diagrams. (a) The shaded region is S ∩ T . (b)
The shaded region is S ∪ T . (c) The shaded region is S ∩ T c . (d) Here, T ⊂ S.
The shaded region is the complement of S. (e) The sets S, T , and U are disjoint.
(f) The sets S, T , and U form a partition of the set Ω.
The Algebra of Sets
Set operations have several properties, which are elementary consequences of the
definitions. Some examples are:
S∪T
S ∩ (T ∪ U )
(S c )c
S∪Ω
= T ∪ S,
= (S ∩ T ) ∪ (S ∩ U ),
= S,
= Ω,
S ∪ (T ∪ U )
S ∪ (T ∩ U )
S ∩ Sc
S∩Ω
= (S ∪ T ) ∪ U,
= (S ∪ T ) ∩ (S ∪ U ),
= Ø,
= S.
Two particularly useful properties are given by de Morgan’s laws which
state that
c
c
Sn
n
Snc ,
=
n
Sn
n
Snc .
=
n
To establish the first law, suppose that x ∈ (∪n Sn )c . Then, x ∈
/ ∪n Sn , which
implies that for every n, we have x ∈
/ Sn . Thus, x belongs to the complement
6
Sample Space and Probability
Chap. 1
of every Sn , and xn ∈ ∩n Snc . This shows that (∪n Sn )c ⊂ ∩n Snc . The converse
inclusion is established by reversing the above argument, and the first law follows.
The argument for the second law is similar.
1.2 PROBABILISTIC MODELS
A probabilistic model is a mathematical description of an uncertain situation.
It must be in accordance with a fundamental framework that we discuss in this
section. Its two main ingredients are listed below and are visualized in Fig. 1.2.
Elements of a Probabilistic Model
• The sample space Ω, which is the set of all possible outcomes of an
experiment.
• The probability law, which assigns to a set A of possible outcomes
(also called an event) a nonnegative number P(A) (called the probability of A) that encodes our knowledge or belief about the collective
“likelihood” of the elements of A. The probability law must satisfy
certain properties to be introduced shortly.
Probability
Law
Event B
Experiment
Event A
Sample Space Ω
(Set of Outcomes)
P(B)
P(A)
A
B
Events
Figure 1.2: The main ingredients of a probabilistic model.
Sample Spaces and Events
Every probabilistic model involves an underlying process, called the experiment, that will produce exactly one out of several possible outcomes. The set
of all possible outcomes is called the sample space of the experiment, and is
denoted by Ω. A subset of the sample space, that is, a collection of possible
Sec. 1.2
Probabilistic Models
7
outcomes, is called an event.† There is no restriction on what constitutes an
experiment. For example, it could be a single toss of a coin, or three tosses,
or an infinite sequence of tosses. However, it is important to note that in our
formulation of a probabilistic model, there is only one experiment. So, three
tosses of a coin constitute a single experiment, rather than three experiments.
The sample space of an experiment may consist of a finite or an infinite
number of possible outcomes. Finite sample spaces are conceptually and mathematically simpler. Still, sample spaces with an infinite number of elements are
quite common. For an example, consider throwing a dart on a square target and
viewing the point of impact as the outcome.
Choosing an Appropriate Sample Space
Regardless of their number, different elements of the sample space should be
distinct and mutually exclusive so that when the experiment is carried out,
there is a unique outcome. For example, the sample space associated with the
roll of a die cannot contain “1 or 3” as a possible outcome and also “1 or 4” as
another possible outcome. When the roll is a 1, the outcome of the experiment
would not be unique.
A given physical situation may be modeled in several different ways, depending on the kind of questions that we are interested in. Generally, the sample
space chosen for a probabilistic model must be collectively exhaustive, in the
sense that no matter what happens in the experiment, we always obtain an outcome that has been included in the sample space. In addition, the sample space
should have enough detail to distinguish between all outcomes of interest to the
modeler, while avoiding irrelevant details.
Example 1.1. Consider two alternative games, both involving ten successive coin
tosses:
Game 1: We receive $1 each time a head comes up.
Game 2: We receive $1 for every coin toss, up to and including the first time
a head comes up. Then, we receive $2 for every coin toss, up to the second
time a head comes up. More generally, the dollar amount per toss is doubled
each time a head comes up.
† Any collection of possible outcomes, including the entire sample space Ω and
its complement, the empty set Ø, may qualify as an event. Strictly speaking, however,
some sets have to be excluded. In particular, when dealing with probabilistic models
involving an uncountably infinite sample space, there are certain unusual subsets for
which one cannot associate meaningful probabilities. This is an intricate technical issue,
involving the mathematics of measure theory. Fortunately, such pathological subsets
do not arise in the problems considered in this text or in practice, and the issue can be
safely ignored.
8
Sample Space and Probability
Chap. 1
In game 1, it is only the total number of heads in the ten-toss sequence that matters, while in game 2, the order of heads and tails is also important. Thus, in
a probabilistic model for game 1, we can work with a sample space consisting of
eleven possible outcomes, namely, 0, 1, . . . , 10. In game 2, a finer grain description
of the experiment is called for, and it is more appropriate to let the sample space
consist of every possible ten-long sequence of heads and tails.
Sequential Models
Many experiments have an inherently sequential character, such as for example
tossing a coin three times, or observing the value of a stock on five successive
days, or receiving eight successive digits at a communication receiver. It is then
often useful to describe the experiment and the associated sample space by means
of a tree-based sequential description, as in Fig. 1.3.
Sample Space
Pair of Rolls
Sequential Tree
Description
4
1
3
2nd Roll
1, 1
1, 2
1, 3
1, 4
2
Root
Leaves
2
3
1
1
2
3
1st Roll
4
4
Figure 1.3: Two equivalent descriptions of the sample space of an experiment
involving two rolls of a 4-sided die. The possible outcomes are all the ordered pairs
of the form (i, j), where i is the result of the first roll, and j is the result of the
second. These outcomes can be arranged in a 2-dimensional grid as in the figure
on the left, or they can be described by the tree on the right, which reflects the
sequential character of the experiment. Here, each possible outcome corresponds
to a leaf of the tree and is associated with the unique path from the root to that
leaf. The shaded area on the left is the event {(1, 4), (2, 4), (3, 4), (4, 4)} that the
result of the second roll is 4. That same event can be described as a set of leaves,
as shown on the right. Note also that every node of the tree can be identified with
an event, namely, the set of all leaves downstream from that node. For example,
the node labeled by a 1 can be identified with the event {(1, 1), (1, 2), (1, 3), (1, 4)}
that the result of the first roll is 1.
Probability Laws
Suppose we have settled on the sample space Ω associated with an experiment.
Sec. 1.2
Probabilistic Models
9
Then, to complete the probabilistic model, we must introduce a probability
law. Intuitively, this specifies the “likelihood” of any outcome, or of any set of
possible outcomes (an event, as we have called it earlier). More precisely, the
probability law assigns to every event A, a number P(A), called the probability
of A, satisfying the following axioms.
Probability Axioms
1. (Nonnegativity) P(A) ≥ 0, for every event A.
2. (Additivity) If A and B are two disjoint events, then the probability
of their union satisfies
P(A ∪ B) = P(A) + P(B).
Furthermore, if the sample space has an infinite number of elements
and A1 , A2 , . . . is a sequence of disjoint events, then the probability of
their union satisfies
P(A1 ∪ A2 ∪ · · ·) = P(A1 ) + P(A2 ) + · · ·
3. (Normalization) The probability of the entire sample space Ω is
equal to 1, that is, P(Ω) = 1.
In order to visualize a probability law, consider a unit of mass which is
to be “spread” over the sample space. Then, P(A) is simply the total mass
that was assigned collectively to the elements of A. In terms of this analogy, the
additivity axiom becomes quite intuitive: the total mass in a sequence of disjoint
events is the sum of their individual masses.
A more concrete interpretation of probabilities is in terms of relative frequencies: a statement such as P(A) = 2/3 often represents a belief that event A
will materialize in about two thirds out of a large number of repetitions of the
experiment. Such an interpretation, though not always appropriate, can sometimes facilitate our intuitive understanding. It will be revisited in Chapter 7, in
our study of limit theorems.
There are many natural properties of a probability law which have not been
included in the above axioms for the simple reason that they can be derived
from them. For example, note that the normalization and additivity axioms
imply that
1 = P(Ω) = P(Ω ∪ Ø) = P(Ω) + P(Ø) = 1 + P(Ø),
and this shows that the probability of the empty event is 0:
P(Ø) = 0.
10
Sample Space and Probability
Chap. 1
As another example, consider three disjoint events A1 , A2 , and A3 . We can use
the additivity axiom for two disjoint events repeatedly, to obtain
P(A1 ∪ A2 ∪ A3 ) = P A1 ∪ (A2 ∪ A2 )
= P(A1 ) + P(A2 ∪ A3 )
= P(A1 ) + P(A2 ) + P(A3 ).
Proceeding similarly, we obtain that the probability of the union of finitely many
disjoint events is always equal to the sum of the probabilities of these events.
More such properties will be considered shortly.
Discrete Models
Here is an illustration of how to construct a probability law starting from some
common sense assumptions about a model.
Example 1.2. Coin tosses.
Consider an experiment involving a single coin
toss. There are two possible outcomes, heads (H) and tails (T ). The sample space
is Ω = {H, T }, and the events are
{H, T }, {H}, {T }, Ø.
If the coin is fair, i.e., if we believe that heads and tails are “equally likely,” we
should assign equal probabilities to the two possible outcomes and specify that
P {H} = P {T } = 0.5. The additivity axiom implies that
P {H, T } = P {H} + P {T } = 1,
which is consistent with the normalization axiom. Thus, the probability law is given
by
P {H, T } = 1,
P {H} = 0.5,
P {T } = 0.5,
P(Ø) = 0,
and satisfies all three axioms.
Consider another experiment involving three coin tosses. The outcome will
now be a 3-long string of heads or tails. The sample space is
Ω = {HHH, HHT, HT H, HT T, T HH, T HT, T T H, T T T }.
We assume that each possible outcome has the same probability of 1/8. Let us
construct a probability law that satisfies the three axioms. Consider, as an example,
the event
A = {exactly 2 heads occur} = {HHT, HT H, T HH}.
Sec. 1.2
Probabilistic Models
11
Using additivity, the probability of A is the sum of the probabilities of its elements:
P {HHT, HT H, T HH} = P {HHT } + P {HT H} + P {T HH}
1
1
1
+ +
8
8
8
3
= .
8
=
Similarly, the probability of any event is equal to 1/8 times the number of possible
outcomes contained in the event. This defines a probability law that satisfies the
three axioms.
By using the additivity axiom and by generalizing the reasoning in the
preceding example, we reach the following conclusion.
Discrete Probability Law
If the sample space consists of a finite number of possible outcomes, then the
probability law is specified by the probabilities of the events that consist of
a single element. In particular, the probability of any event {s1 , s2 , . . . , sn }
is the sum of the probabilities of its elements:
P {s1 , s2 , . . . , sn } = P {s1 } + P {s2 } + · · · + P {sn } .
In the special case where the probabilities P {s1 }), . . . , P({sn } are all the
same (by necessity equal to 1/n, in view of the normalization axiom), we obtain
the following.
Discrete Uniform Probability Law
If the sample space consists of n possible outcomes which are equally likely
(i.e., all single-element events have the same probability), then the probability of any event A is given by
P(A) =
Number of elements of A
.
n
Let us provide a few more examples of sample spaces and probability laws.
Example 1.3. Dice. Consider the experiment of rolling a pair of 4-sided dice (cf.
Fig. 1.4). We assume the dice are fair, and we interpret this assumption to mean
12
Sample Space and Probability
Chap. 1
that each of the sixteen possible outcomes [ordered pairs (i, j), with i, j = 1, 2, 3, 4],
has the same probability of 1/16. To calculate the probability of an event, we
must count the number of elements of event and divide by 16 (the total number of
possible outcomes). Here are some event probabilities calculated in this way:
P {the sum of the rolls is even} = 8/16 = 1/2,
P {the sum of the rolls is odd} = 8/16 = 1/2,
P {the first roll is equal to the second} = 4/16 = 1/4,
P {the first roll is larger than the second} = 6/16 = 3/8,
P {at least one roll is equal to 4} = 7/16.
Sample Space
Pair of Rolls
4
3
2nd Roll
Event
{at least one roll is a 4}
Probability = 7/16
2
1
1
2
3
1st Roll
4
Event
{the first roll is equal to the second}
Probability = 4/16
Figure 1.4: Various events in the experiment of rolling a pair of 4-sided dice,
and their probabilities, calculated according to the discrete uniform law.
Continuous Models
Probabilistic models with continuous sample spaces differ from their discrete
counterparts in that the probabilities of the single-element events may not be
sufficient to characterize the probability law. This is illustrated in the following
examples, which also illustrate how to generalize the uniform probability law to
the case of a continuous sample space.
Sec. 1.2
Probabilistic Models
13
Example 1.4. A wheel of fortune is continuously calibrated from 0 to 1, so the
possible outcomes of an experiment consisting of a single spin are the numbers in
the interval Ω = [0, 1]. Assuming a fair wheel, it is appropriate to consider all
outcomes equally likely, but what is the probability of the event consisting of a
single element? It cannot be positive, because then, using the additivity axiom, it
would follow that events with a sufficiently large number of elements would have
probability larger than 1. Therefore, the probability of any event that consists of a
single element must be 0.
In this example, it makes sense to assign probability b − a to any subinterval
[a, b] of [0, 1], and to calculate the probability of a more complicated set by evaluating its “length.”† This assignment satisfies the three probability axioms and
qualifies as a legitimate probability law.
Example 1.5. Romeo and Juliet have a date at a given time, and each will arrive
at the meeting place with a delay between 0 and 1 hour, with all pairs of delays
being equally likely. The first to arrive will wait for 15 minutes and will leave if the
other has not yet arrived. What is the probability that they will meet?
Let us use as sample space the square Ω = [0, 1] × [0, 1], whose elements are
the possible pairs of delays for the two of them. Our interpretation of “equally
likely” pairs of delays is to let the probability of a subset of Ω be equal to its area.
This probability law satisfies the three probability axioms. The event that Romeo
and Juliet will meet is the shaded region in Fig. 1.5, and its probability is calculated
to be 7/16.
Properties of Probability Laws
Probability laws have a number of properties, which can be deduced from the
axioms. Some of them are summarized below.
Some Properties of Probability Laws
Consider a probability law, and let A, B, and C be events.
(a) If A ⊂ B, then P(A) ≤ P(B).
(b) P(A ∪ B) = P(A) + P(B) − P(A ∩ B).
(c) P(A ∪ B) ≤ P(A) + P(B).
(d) P(A ∪ B ∪ C) = P(A) + P(Ac ∩ B) + P(Ac ∩ B c ∩ C).
† The “length” of a subset S of [0, 1] is the integral
dt, which is defined, for
S
“nice” sets S, in the usual calculus sense. For unusual sets, this integral may not be
well defined mathematically, but such issues belong to a more advanced treatment of
the subject.
14
Sample Space and Probability
Chap. 1
y
1
M
1/4
0
1/4
1
x
Figure 1.5: The event M that Romeo and Juliet will arrive within 15 minutes
of each other (cf. Example 1.5) is
M =
(x, y)
|x − y| ≤ 1/4, 0 ≤ x ≤ 1, 0 ≤ y ≤ 1 ,
and is shaded in the figure. The area of M is 1 minus the area of the two unshaded
triangles, or 1 − (3/4) · (3/4) = 7/16. Thus, the probability of meeting is 7/16.
These properties, and other similar ones, can be visualized and verified
graphically using Venn diagrams, as in Fig. 1.6. For a further example, note
that we can apply property (c) repeatedly and obtain the inequality
n
P(A1 ∪ A2 ∪ · · · ∪ An ) ≤
P(Ai ).
i=1
In more detail, let us apply property (c) to the sets A1 and A2 ∪ · · · ∪ An , to
obtain
P(A1 ∪ A2 ∪ · · · ∪ An ) ≤ P(A1 ) + P(A2 ∪ · · · ∪ An ).
We also apply property (c) to the sets A2 and A3 ∪ · · · ∪ An to obtain
P(A2 ∪ · · · ∪ An ) ≤ P(A2 ) + P(A3 ∪ · · · ∪ An ),
continue similarly, and finally add.
Models and Reality
Using the framework of probability theory to analyze a physical but uncertain
situation, involves two distinct stages.
(a) In the first stage, we construct a probabilistic model, by specifying a probability law on a suitably defined sample space. There are no hard rules to
Probabilistic Models
15
c
U
A B
B
A
A
A
U
Sec. 1.2
B
B
(b)
(a)
A
c
U
B
C
C
c
A
U
U
c
A
B
B
(c)
Figure 1.6: Visualization and verification of various properties of probability
laws using Venn diagrams. If A ⊂ B, then B is the union of the two disjoint
events A and Ac ∩ B; see diagram (a). Therefore, by the additivity axiom, we
have
P(B) = P(A) + P(Ac ∩ B) ≥ P(A),
where the inequality follows from the nonnegativity axiom, and verifies property (a).
From diagram (b), we can express the events A ∪ B and B as unions of
disjoint events:
A ∪ B = A ∪ (Ac ∩ B),
B = (A ∩ B) ∪ (Ac ∩ B).
The additivity axiom yields
P(A ∪ B) = P(A) + P(Ac ∩ B),
P(B) = P(A ∩ B) + P(Ac ∩ B).
Subtracting the second equality from the first and rearranging terms, we obtain
P(A ∪ B) = P(A) + P(B) − P(A ∩ B), verifying property (b). Using also the fact
P(A ∩ B) ≥ 0 (the nonnegativity axiom), we obtain P(A ∪ B) ≤ P(A) + P(B),
verifying property (c)
From diagram (c), we see that the event A ∪ B ∪ C can be expressed as a
union of three disjoint events:
A ∪ B ∪ C = A ∪ (Ac ∩ B) ∪ (Ac ∩ B c ∩ C),
so property (d) follows as a consequence of the additivity axiom.
16
Sample Space and Probability
Chap. 1
guide this step, other than the requirement that the probability law conform to the three axioms. Reasonable people may disagree on which model
best represents reality. In many cases, one may even want to use a somewhat “incorrect” model, if it is simpler than the “correct” one or allows for
tractable calculations. This is consistent with common practice in science
and engineering, where the choice of a model often involves a tradeoff between accuracy, simplicity, and tractability. Sometimes, a model is chosen
on the basis of historical data or past outcomes of similar experiments.
Systematic methods for doing so belong to the field of statistics, a topic
that we will touch upon in the last chapter of this book.
(b) In the second stage, we work within a fully specified probabilistic model and
derive the probabilities of certain events, or deduce some interesting properties. While the first stage entails the often open-ended task of connecting
the real world with mathematics, the second one is tightly regulated by the
rules of ordinary logic and the axioms of probability. Difficulties may arise
in the latter if some required calculations are complex, or if a probability
law is specified in an indirect fashion. Even so, there is no room for ambiguity: all conceivable questions have precise answers and it is only a matter
of developing the skill to arrive at them.
Probability theory is full of “paradoxes” in which different calculation
methods seem to give different answers to the same question. Invariably though,
these apparent inconsistencies turn out to reflect poorly specified or ambiguous
probabilistic models.
1.3 CONDITIONAL PROBABILITY
Conditional probability provides us with a way to reason about the outcome
of an experiment, based on partial information. Here are some examples of
situations we have in mind:
(a) In an experiment involving two successive rolls of a die, you are told that
the sum of the two rolls is 9. How likely is it that the first roll was a 6?
(b) In a word guessing game, the first letter of the word is a “t”. What is the
likelihood that the second letter is an “h”?
(c) How likely is it that a person has a disease given that a medical test was
negative?
(d) A spot shows up on a radar screen. How likely is it that it corresponds to
an aircraft?
In more precise terms, given an experiment, a corresponding sample space,
and a probability law, suppose that we know that the outcome is within some
given event B. We wish to quantify the likelihood that the outcome also belongs
Sec. 1.3
Conditional Probability
17
to some other given event A. We thus seek to construct a new probability law,
which takes into account this knowledge and which, for any event A, gives us
the conditional probability of A given B, denoted by P(A | B).
We would like the conditional probabilities P(A | B) of different events A
to constitute a legitimate probability law, that satisfies the probability axioms.
They should also be consistent with our intuition in important special cases, e.g.,
when all possible outcomes of the experiment are equally likely. For example,
suppose that all six possible outcomes of a fair die roll are equally likely. If we
are told that the outcome is even, we are left with only three possible outcomes,
namely, 2, 4, and 6. These three outcomes were equally likely to start with,
and so they should remain equally likely given the additional knowledge that the
outcome was even. Thus, it is reasonable to let
P(the outcome is 6 | the outcome is even) =
1
.
3
This argument suggests that an appropriate definition of conditional probability
when all outcomes are equally likely, is given by
P(A | B) =
number of elements of A ∩ B
.
number of elements of B
Generalizing the argument, we introduce the following definition of conditional probability:
P(A ∩ B)
P(A | B) =
,
P(B)
where we assume that P(B) > 0; the conditional probability is undefined if the
conditioning event has zero probability. In words, out of the total probability of
the elements of B, P(A | B) is the fraction that is assigned to possible outcomes
that also belong to A.
Conditional Probabilities Specify a Probability Law
For a fixed event B, it can be verified that the conditional probabilities P(A | B)
form a legitimate probability law that satisfies the three axioms. Indeed, nonnegativity is clear. Furthermore,
P(Ω | B) =
P(Ω ∩ B)
P(B)
=
= 1,
P(B)
P(B)
and the normalization axiom is also satisfied. In fact, since we have P(B | B) =
P(B)/P(B) = 1, all of the conditional probability is concentrated on B. Thus,
we might as well discard all possible outcomes outside B and treat the conditional
probabilities as a probability law defined on the new universe B.
18
Sample Space and Probability
Chap. 1
To verify the additivity axiom, we write for any two disjoint events A1 and
A2 ,
P (A1 ∪ A2 ) ∩ B
P(B)
P((A1 ∩ B) ∪ (A2 ∩ B))
=
P(B)
P(A1 ∩ B) + P(A2 ∩ B)
=
P(B)
P(A1 ∩ B) P(A2 ∩ B)
=
+
P(B)
P(B)
= P(A1 | B) + P(A2 | B),
P(A1 ∪ A2 | B) =
where for the second equality, we used the fact that A1 ∩ B and A2 ∩ B are
disjoint sets, and for the third equality we used the additivity axiom for the
(unconditional) probability law. The argument for a countable collection of
disjoint sets is similar.
Since conditional probabilities constitute a legitimate probability law, all
general properties of probability laws remain valid. For example, a fact such as
P(A ∪ C) ≤ P(A) + P(C) translates to the new fact
P(A ∪ C | B) ≤ P(A | B) + P(C | B).
Let us summarize the conclusions reached so far.
Properties of Conditional Probability
• The conditional probability of an event A, given an event B with
P(B) > 0, is defined by
P(A | B) =
P(A ∩ B)
,
P(B)
and specifies a new (conditional) probability law on the same sample
space Ω. In particular, all known properties of probability laws remain
valid for conditional probability laws.
• Conditional probabilities can also be viewed as a probability law on a
new universe B, because all of the conditional probability is concentrated on B.
• In the case where the possible outcomes are finitely many and equally
likely, we have
P(A | B) =
number of elements of A ∩ B
.
number of elements of B
Sec. 1.3
Conditional Probability
19
Example 1.6. We toss a fair coin three successive times. We wish to find the
conditional probability P(A | B) when A and B are the events
A = {more heads than tails come up},
B = {1st toss is a head}.
The sample space consists of eight sequences,
Ω = {HHH, HHT, HT H, HT T, T HH, T HT, T T H, T T T },
which we assume to be equally likely. The event B consists of the four elements
HHH, HHT, HT H, HT T , so its probability is
P(B) =
4
.
8
The event A ∩ B consists of the three elements outcomes HHH, HHT, HT H, so
its probability is
3
P(A ∩ B) = .
8
Thus, the conditional probability P(A | B) is
P(A | B) =
P(A ∩ B)
3/8
3
=
= .
P(B)
4/8
4
Because all possible outcomes are equally likely here, we can also compute P(A | B)
using a shortcut. We can bypass the calculation of P(B) and P(A ∩ B), and simply
divide the number of elements shared by A and B (which is 3) with the number of
elements of B (which is 4), to obtain the same result 3/4.
Example 1.7. A fair 4-sided die is rolled twice and we assume that all sixteen
possible outcomes are equally likely. Let X and Y be the result of the 1st and the
2nd roll, respectively. We wish to determine the conditional probability P(A | B)
where
A = max(X, Y ) = m ,
B = min(X, Y ) = 2 ,
and m takes each of the values 1, 2, 3, 4.
As in the preceding example, we can first determine the probabilities P(A∩B)
and P(B) by counting the number of elements of A ∩ B and B, respectively, and
dividing by 16. Alternatively, we can directly divide the number of elements of
A ∩ B with the number of elements of B; see Fig. 1.7.
Example 1.8. A conservative design team, call it C, and an innovative design
team, call it N, are asked to separately design a new product within a month. From
past experience we know that:
(a) The probability that team C is successful is 2/3.